Authors
Liliana Bettolo*
*These authors contributed equally to this work
Megan Knight*
*These authors contributed equally to this work
Heather Darby
Vern Grubinger
Lindsey Ruhl
About
Recommended citation for chapter
Bettolo, L., Knight, M., Grubinger, V., Ruhl, L., Darby, H., 2026. Chapter 6: Agriculture and Food Systems. In Galford, G.L., Balerna, J.A., Turner H.C., Sardonis, A., Peplinski, H. (Eds), The Vermont Climate Assessment 2025. Burlington, Vermont: Climate Measurements Center of Excellence, Gund Institute for Environment at the University of Vermont. DOI: 10.5281/zenodo.20272849. Accessed online at https://vtclimate.org.
Author Contributor Roles Taxonomy (CRediT) statement
Liliana Bettolo: Conceptualization, Methodology, Project Administration, Writing, Data Curation, Formal Analysis, Investigation, Visualization, Editing; Megan Knight: Conceptualization, Methodology, Project Administration, Writing, Data Curation, Formal Analysis, Investigation, Visualization, Editing; Heather Darby: Writing, Editing (6.3.2, 6.3.4, 6.4); Lindsey Ruhl: Writing, Editing (6.3.2, 6.3.4, 6.4); Vern Grubinger: Writing, Editing (6.4.4).
Acknowledgements
We thank Katherine Porterfield, Eric Roy, Jake Claro, Joshua Faulkner, Leslie Spencer, Bethany Pelletier, Sara Ziegler, Taylor Ricketts, Meredith Niles, Kellie Damann, Mollie Willis, Evan Horne, Lylee Rauch-Kacenski, and anonymous reviewers whose thoughtful reviews and contributions helped refine and strengthen this chapter. Liliana Bettolo was partially supported by the University of Vermont Food Systems Research Institute.
Downloads
Please use the following accessible downloads for your own needs.To find downloads of other chapters in VCA 2025, please go to Downloads.
Table of contents
- 6.0 Executive summary
- 6.1 Key messages
- 6.2 Background
- 6.3 Biophysical impacts on agricultural production
- 6.4 Agricultural sector impacts and adaptation strategies
- 6.5 Economic impacts and adaptation strategies
- 6.6 Social impacts and adaptation strategies
- 6.7 Food system emissions and mitigation
- 6.8 Food system resilience and transformation
- 6.9 Traceable accounts
- 6.10 References
6.0 Executive summary
Vermont’s food system is central to the state’s economy, landscape, and cultural identity. Farmers, farm workers, businesses, policymakers, and communities all have a stake in how climate change reshapes the food system, and they need actionable and reliable information to respond to uncertainty, risks, and opportunities. In Vermont, average annual temperatures are rising, causing hotter, more humid summers and milder winters. Earlier spring warming and later fall freezing are extending the growing season. Average annual precipitation is also increasing, with winters and springs expected to become significantly wetter. Extreme weather events may occur in short succession within the same growing season (floods into drought), making recovery more difficult and increasing production risks. While climate change may create new opportunities, these impacts will cause damage to crops and infrastructure and create uncertainty for producers. Many impacts of climate change on Vermont’s agriculture and food system can be addressed through adaptation and resilience planning.
Climate change is likely to impact crop suitability, soil health, pest and disease pressures, livestock health, and farm operations:
- Crops and soils: A lengthening growing season will shift harvest and planting dates and is likely to increase productivity and viability of some crops in Vermont. Increased heavy rainfall and flooding accelerate soil erosion and nutrient loss, damage crops, increase disease pressures, and can delay crop planting and harvesting. Drought and heat stress can reduce crop and forage yields and quality. Warmer annual temperatures and milder winters are likely to intensify and introduce new pest, weed, and disease pressures.
- Livestock: Warming temperatures increase heat stress which may negatively impact milk and meat production and increase pest, parasite, and disease pressures that threaten animal health and productivity.
- Infrastructure damage: Flooding will likely continue to cause substantial damage and disruption to cropland, equipment, processing facilities, and distribution networks.
- Farm operations: More variable seasonal rainfall can saturate soils during critical times for farm operations, thereby making it challenging for farmers to take advantage of earlier springs. Drought can negatively impact water availability, crop quality and yields, animal production, and increase demand for irrigation.
- Economic and social disruption: Flooding impacts homes and towns, processing facilities, and distribution networks. Climate-related losses and disruptions ripple beyond farms to food manufacturers, retailers, and service businesses. Food businesses may contend with new challenges to food safety and worker wellbeing.
The large-scale impacts on Vermont’s food system are still uncertain. It is unclear how supply chains, markets, and policy will respond. Climate stress compounds existing pressures like land development, changing consumer preferences and markets, labor shortages, trade variability, water quality issues, cost of living, and food insecurity.
Vermont’s farmers and food businesses are already responding to climate change. Producers are diversifying cropping systems, testing new crop varieties, and adopting soil health practices. Some are investing in protective infrastructure, nature-based solutions, or enterprise diversification strategies (e.g., perennial and annual cropping systems, crop and livestock integrated systems, value-added products, agritourism) to help buffer financial risk. State-level efforts (e.g., farmer-to-farmer learning programs, resilience funding) are strengthening capacity to respond during disasters. Public policy is providing incentives for climate adaptation and mitigation, technical assistance, and financing to support disaster recovery. Climate adaptation has economic, social, and environmental co-benefits and will increase Vermont’s food system resilience.
Agriculture and food systems are interconnected with other sectors. Soil and nutrient management practices have important implications for water resources and water quality goals (see 4 Water Resources). Climate-driven risks to public health, like heat exposure, air quality, and mental health, are especially relevant to farmers and farm workers (see 10 Human Health). Climate change adds new challenges to Vermont’s economic development and growth, as well as land use related to conservation and development (see 11 Community Development). Strengthening resilience in the food system requires coordinated action across environmental, economic, and social policy domains.
Climate change poses significant risks and challenges for Vermont’s agriculture and food systems, but it also creates opportunities for innovation and collaboration. Vermont’s vibrant and growing food system and its communities are a source of resilience that Vermont must continue to develop to withstand, adapt, and thrive in the face of increasing climate-related impacts.
6.1 Key messages
- Vermont’s growing season is lengthening, which may increase crop productivity and enable new crops, but introduces risks from greater variability in first and last freeze dates and expanded pest and pathogen pressures.
- Increasing annual precipitation and more frequent heavy precipitation days (>1 inch) disrupt farm operations, degrade soil function, increase crop disease and pest pressures, and cause substantial damage to crops and food system infrastructure.
- Rising temperatures and more frequent droughts negatively affect forage production, animal health, and milk and meat yields.
- The spring freeze–thaw period is occurring earlier but becoming more variable, increasing uncertainty for maple producers and the risk of early-season damage to sensitive crops.
- Strategies to increase climate adaptation in agriculture and food systems include improving soil health, water management, and infrastructure; enterprise and crop diversification; integrated pest management; and expanding nature-based solutions.
- Climate stressors on agriculture and the food system are correlated with other socioeconomic stressors. Strong local networks, economic and social support systems, and effective policies are required to strengthen resilience to future climate impacts.
6.2 Background
Vermont’s vibrant food system is integral to local economies, rural livelihoods, environment, and cultural identity. Climate change presents ongoing challenges to the economic, social, and environmental sustainability of Vermont’s food system. Climate-induced weather variability and extreme events already occur in Vermont with increasing frequency and intensity. Vermont’s food system will continue to face considerable disruption due to climate change, from impacts related to crop production and soil health to business viability and infrastructure. The lengthening growing season and increasing productivity of certain crops may also bring new opportunities to Vermont’s food and agriculture sector.
Climate change is one of many compounding challenges faced by Vermont’s food system. Farms, food businesses, and consumers face a constellation of challenges including land development pressures, changing consumer preferences and markets, income inequality, trade variability, water quality, and food insecurity. Food systems’ actors must make strategic planning decisions and try to increase resilience to both climate and non-climate challenges. In many cases, adaptation to climate change can support adaptation to other economic, social, and environmental pressures. Building resilience across the food system is essential to weathering the increasing frequency and severity of climate-related shocks. Achieving and maintaining resilience will require a diverse mix of strategies and collaborative action from government, businesses, communities, and individuals.
6.2.1 Vermont’s food system
The “food system” includes the complex network of all the actors (people, organizations, businesses, and government agencies) involved in the production, processing, distribution, consumption, and disposal of food products, as well as the economic, political, social, and natural environments where those actors and activities take place (USDA, 2026; Figure 6-1). This chapter takes a holistic approach to describing the impacts of climate change across the components of the food system.
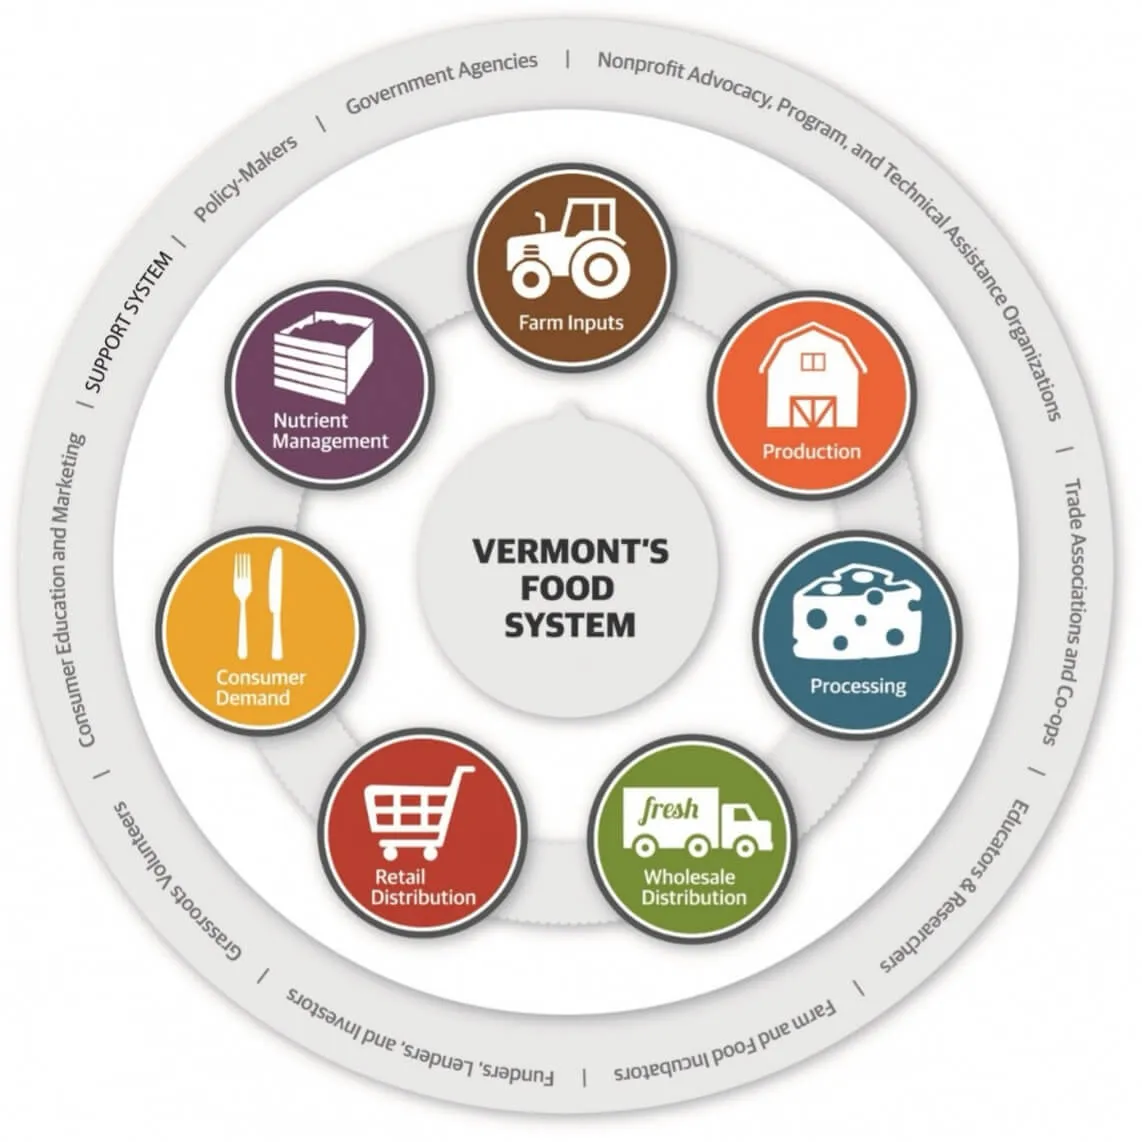
Source: Nottermann (2015)
Vermont’s food system is growing: Vermont’s farm and food sales, jobs, number of food enterprises, and local food consumption increased between 2011–2020 (VSJF, 2021). During that period, Vermont’s food system economic output expanded 48%, up to $11.3 billion, including $3 billion from food manufacturing, Vermont’s second-largest manufacturing industry (VSJF, 2021). Sales of farm products increased 32% from 2017–2022 and now exceed $1 billion (USDA, 2024). In 2020, local food purchases rose to $310 million, comprising 13.9% of the $2.2 billion spent on food in Vermont annually (VSJF, 2021).
While Vermont’s food system is growing, the number of farms in Vermont decreased by 4% to 6,537 farms from 2017–2022 (USDA, 2024). Vermont’s farm revenue and income remain low, with more than half of Vermont’s farms selling less than $10,000 of agricultural products per year, and only 43% of farms reporting net positive income (Grubinger, 2024a). Farm sales are heavily consolidated; only 3% of farms account for two-thirds of all agricultural sales (Grubinger, 2024a). Vermont’s market value of agricultural products was $10.3 billion in 2022, with 32% from crops and 68% from livestock and livestock products (USDA, 2024). Vermont’s top agricultural products by value of sales in 2022 were milk from cows (58%), maple syrup (11%), followed by other crops and hay (10%), cattle and calves (6%), and vegetables (4%) (USDA, 2024). Field crops, fruits, and nursery/floricultural products each comprised about 2% of agricultural product sales in 2022 (USDA, 2024). In 2021, Vermont produced almost half of the country’s maple syrup (NEFSPP, 2023), and in 2022, 323 Vermont farms were engaged in agritourism on the farm as a source of income diversification (USDA, 2024).
Vermont’s primary food manufacturing sales come from dairy, and Vermont had the highest percentage of food and beverage processing, manufacturing employment, and sales of all New England states in 2017 (NEFSPP, 2023). Vermont’s retail food sales are largely dominated by grocery stores (56%), restaurants (30%), liquor stores (4%), with direct-to-consumer sales only accounting for 1.6% of retail food sales in 2017 (NEFSPP, 2023).
Of the 12,470 producers captured in the 2022 United States Department of Agriculture (USDA) Census of Agriculture, 60% identified as male and 40% as female, 10% were under the age of 35 and 39% were over the age of 65, and the average age was 58 (USDA, 2024). Vermont’s food producers are also overwhelmingly white, with only 2.3% of producers identifying as non-white in the 2017 US Census of Agriculture, and 1.6% in 2022 (USDA, 2024). Almost half (43%) of producers reported that their primary occupation was farming, while 63% reported working some days off of the farm (USDA, 2024).
As of 2022, an estimated 1,173,890 acres of land in Vermont is within farms as woodland (49%), cropland (crops, hay, and pasture) (45%), pasture (8%), and farmsteads (7%) (USDA, 2024). Cropland is widely distributed across the state with high densities located near freshwater systems like Lake Champlain (U. Vermont Spatial Analysis Lab, 2022; Figure 6‑2). Of the total cropland (436,297 acres), 78% is used for livestock feed including 265,275 acres producing forage, and 74,880 growing corn silage (USDA, 2024).
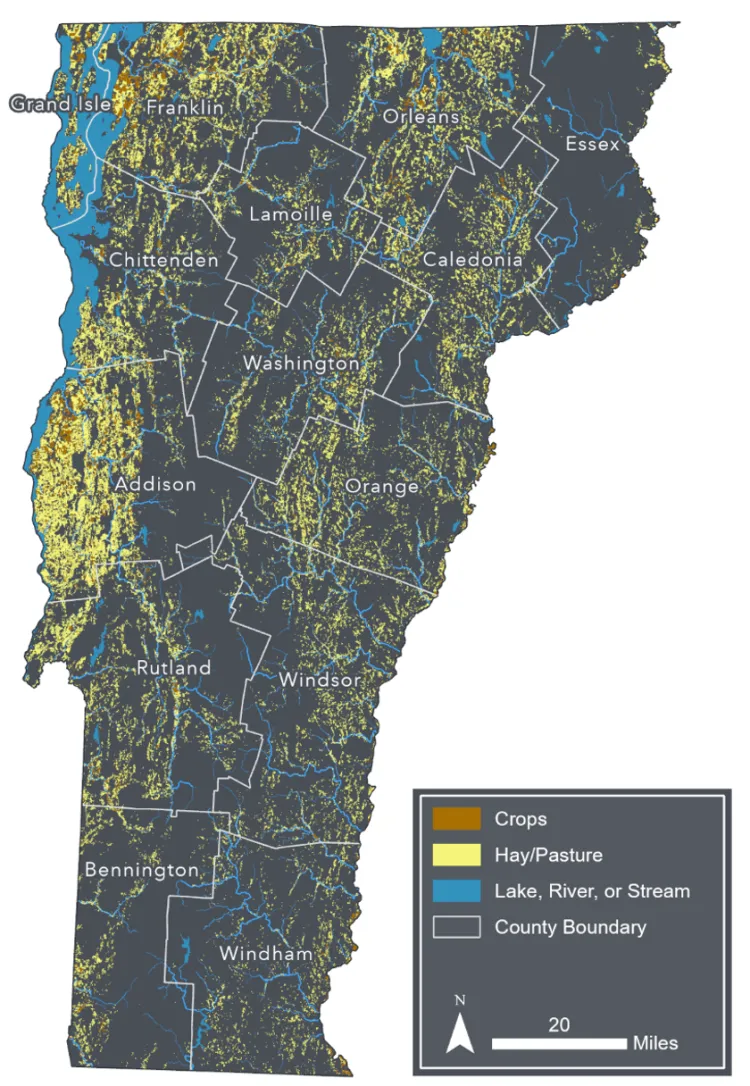
Source: U. Vermont Spatial Analysis Lab, 2022
Note: Visualization by Hannah C. Turner
Since 2017, Vermont has lost 19,547 acres of agricultural land, likely to residential and commercial development (Grubinger, 2024a). The American Farmland Trust estimates that Vermont could lose an additional 41,200–61,800 acres of farmland by 2040, depending on development planning decisions (NEFSPP, 2023). At present, 143,774 acres across 797 Vermont farms are conserved through easements (USDA, 2024).
6.2.2 Climate, food systems, and policy
Agriculture and food policy in Vermont includes land use regulations, environmental regulations, business and labor codes, food safety regulations, and trade and economic policies. National and state policies can increase or decrease resilience, risk, vulnerability, and exposure to climate hazards (Adger et al., 2011). Policies can provide incentives, technical assistance, and financing to help farmers adopt climate-resilient practices, recover from disasters, and mitigate environmental impacts. Public policy is an important tool to respond to the impacts of climate change. Effective policies that broadly support the viability and success of food businesses also will strengthen resilience to other challenges, including climate change (Harris et al., 2021).
As state and local governments respond to the threats and opportunities posed by climate change, they are updating Vermont’s agriculture and food policy. Vermont’s food and agricultural policies will need to further adapt to better support Vermont’s food system amid increasing variability, uncertainty, and intensity of climate hazards. Policy frameworks, including water quality regulations and land use planning (see Community Development 11.6), may require increased flexibility and responsiveness. Policies may need to increasingly balance regulatory objectives with farm viability, address equity across farm types and sizes, and strengthen resilience in food processing and distribution. The increasing risks from climate change highlight the importance of diverse, adaptive, and resilience-focused policies that support components across Vermont’s food system.
6.2.3 Food systems and rural communities
Food and agriculture are a key part of Vermont’s cultural identity. The various challenges and opportunities presented by climate change may affect Vermont communities’ senses of place, food cultures, and economic structures (see Community Development 11.0). Farmers, food workers, and food businesses are embedded in communities, economies, and landscapes, and thus the changing viability of those enterprises can reshape the fabric of towns and communities. Local food is linked to place, close relationships between producers and consumers, and a sense of pride (Westskog et al., 2024). Consumers buy local food in part because they value supporting farmers and the vitality of a rural, agricultural community (Westskog et al., 2024). Producers of local food are also motivated by preservation of local culture, livelihoods and lifeways, and agricultural landscapes (Hinrichs, 1998; Westskog et al., 2024). Some products, like maple syrup, have become emblematic of Vermont’s agriculture, community, food, culture, and heritage (Wang et al., 2025). Dairy and maple especially are included in local festivals, culinary practices, and many other community activities. Because of these factors, community social and cultural dimensions are deeply important to the way that food system actors are impacted by and respond to climate change (Dang et al., 2019). Vermont may benefit from future research examining the diversity of climate adaptation responses in our food system to better understand how and why Vermont’s farmers and food businesses choose to adapt, and how to best support adaptation and resilience in the food system.
6.3 Biophysical impacts on agricultural production
Agriculture is intrinsically dependent on biophysical systems and therefore highly sensitive to climate change. Changing temperature, precipitation, extreme weather, and atmospheric conditions have cascading effects on erosion, soil structure, and nutrient cycling in soils, as well as pollinators, weeds, pests, and disease. Key climate impacts on agriculture that impact all agroecosystems are summarized below.
Average annual temperature is increasing. Average temperature has increased by 3.6ºF (1.6ºC) since 1900, with an increase of 4.6ºF (2.5ºC) in the winter and 2.3ºF (1.3ºC) in the summer. There are now, on average, almost 16 fewer days below freezing in the winter (see Climate Change in Vermont 2.4).
Vermont’s growing season length is increasing. On average, there are almost 24 more days in the freeze-free period since the 1900s. In the past 35 years, the growing season length has increased at a rate of 4.5 days/decade (see Climate Change in Vermont 2.4.4 and 6.3.1).
Extreme heat events are increasing. Extreme heat events with maximum temperatures exceeding 90ºF (32.2ºC) occurred an average of seven days/year within the last half-decade, up from a long-term average of 5.6 days since 1900. Nighttime growing-season days where temperatures stay above 70ºF (21.1ºC) are 4.5 times more frequent (see Climate Change in Vermont 2.4.4).
Average annual precipitation is increasing. Average annual precipitation has increased 20% since 1900 (see Climate Change in Vermont 2.5.2). Not only are winters wetter, but there is also a growing portion of winter precipitation falling as rain instead of snow, as there is an increase in precipitation events occurring on winter days with above-freezing temperatures, altering the timing and distribution of when water is stored and released across the landscape (see Climate Change in Vermont 2.5.3)
Heavy precipitation events are increasing. Since 1900, the number of days annually with one inch (25 mm) or more of precipitation in Vermont has increased by 2.6 days (see Climate Change in Vermont 2.5.2 and 2.6.2). Although the most recent five years saw a decline in the total number of heavy precipitation days over one inch, the intensity of heavy precipitation days that did occur was notable. In 2024, Vermont experienced a record-high average of 0.8 days with more than four inches (102 mm) of rainfall (see Climate Change in Vermont 2.5.2 and 2.6.2).
Extreme weather events are increasing. Since 1980, NOAA has identified 19 weather weather/climate disaster events with financial impacts of more than $1 billion to the state of Vermont, four of which occurred within the last five years (2020–2024; NOAA NCEI, 2025).
6.3.1 Growing season and plant hardiness zones
Growing season length
The Vermont Climate Assessment calculates the growing season length and the freeze-free period as the number of consecutive days when the daily minimum air temperature is above freezing (i.e., 32°F/ 0°C). Frost can occur if air temperature is at or below 36°F (2.2°C) and is affected by the dew point and wind conditions (Longstroth, 2015). Both freeze-free and frost-free periods are important for crop production; however, since freeze incidence and timing only depend on air temperature, it is a way to consistently evaluate growing season length with the data readily available in Vermont.
Vermont’s growing season is lengthening (see Climate Change in Vermont 2.4.4; Figure 6-3). From 1900–2024, the growing season increased significantly by over three weeks (23.7 days, 19.7% increase). The rate of increase of growing season length has accelerated: from 1900–2024, it was 2.3 days longer per decade; from 1960–2024, it was 3.3 days longer per decade; and from 1990–2024, it was 4.5 days longer per decade (see Climate Change in Vermont 2.4.4). Comparing growing season length between climate divisions, Western Vermont is experiencing the greatest variability in first and last freeze dates and the slowest rate of change for growing season length since 1960 and 1990, likely due to the lake effects (See Climate Change in Vermont 2.4.4 and 2.10.4).
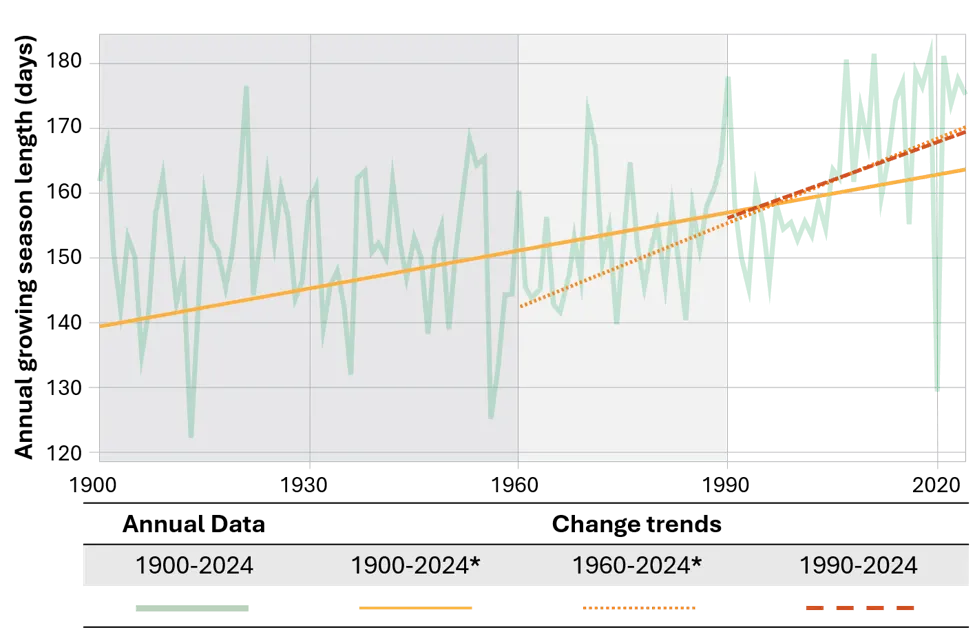
Source: NOAA NECI (2026)
Note: Original analysis by Liliana Bettolo using the NOAA RCC ACIS dataset. Daily temperature data for 15 weather stations across Vermont (see Climate Change in Vermont 2.5) was used to identify the last spring freeze and first fall freeze where minimum temperatures are 32°F (0°C) or below representing the growing season length. The fluctuating green line represents annual growing season lengths from 1900–2024. The straight, orange lines display linear regression trends. Considering most farmers in the state are interested in trends within their lifetime, both the mid-term (1960–2024; dotted orange line), and the near-term (1990–2024; dashed orange line) trends are highlighted in addition to the full-term trend (solid orange line)
The growing season length is increasing due to both the last spring freeze occurring earlier and first fall freeze occurring later (see Climate Change in Vermont 2.4.4; Figure 6‑4). From 1900–2024, the average date of the last spring freeze is almost a week earlier (6.4 days), advancing at a rate of 0.5 days earlier per decade. Over that same time period (1900–2024), the average date of the first fall freeze is over two weeks later (16.4 days), advancing at a rate of 1.3 days later per decade.
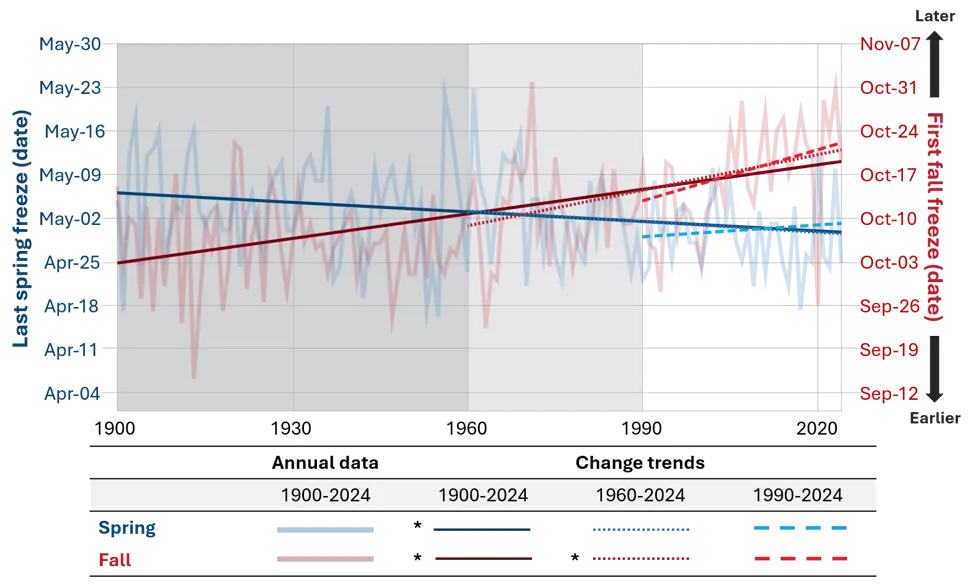
Source: NOAA NECI (2026)
Note: Original analysis by Liliana Bettolo using the NOAA RCC ACIS dataset. Daily temperature data for 15 weather stations across Vermont (see Climate Change in Vermont 2.5) was used to identify the last spring freeze and first fall freeze where minimum temperatures are 32°F (0°C) or below. The fluctuating blue and red lines represent annual first and last freeze dates from 1900–2024. The straight red and blue lines display linear regression trends. Considering most farmers in the state are interested in trends within their lifetime, both the mid-term (1960–2024; dotted red and blue lines), and the near-term (1990–2024; dashed red and blue lines) trends are highlighted in addition to the full-term trend (solid red and blue lines)
Within the last 35 years (Figure 6‑4, dashed blue line), the last spring freeze has sometimes been much earlier (e.g., mid-April) or much later (e.g., mid-May) compared to the 65-year average (Figure 6‑4, dotted blue line). There is no statistically significant trend during the last 35 years. Conversely, shifts in the first fall freeze are consistently accelerating over time; the rate of change increased to an average of 1.9 days later per decade from 1960–2024 (Figure 6‑4, dotted red line) and 2.8 days later per decade from 1990–2024 (Figure 6‑4, dashed red line). These trends are most distinct in the northeast and southeast of Vermont since 1990, while western Vermont has experienced slower changes for both first fall freeze and last spring freeze, correlating with a slower rate of freeze-free lengthening overall (see Climate Change in Vermont 2.4.4 and 2.10.4).
While timing for first fall freeze and last spring freeze has shifted over time, interannual variability remains high. To assess whether the timing of the first or last freeze has become more variable over time, a 10-year rolling standard deviation was calculated for last spring freeze and first fall freeze dates for a subset of monitoring stations that each had the longest period of record (n=6; see Climate Change in Vermont Figure 2-4). No significant trends in variability were detected for either metric, suggesting that year-to-year variability in freeze timing has remained relatively stable despite significant trends in average freeze dates and growing season length. Although variability has not increased over time, freeze timing remains highly variable from year to year. This persistent variability represents an important management consideration, as unusually late spring freezes or early fall freezes can still occur and influence planting dates, crop selection, and other agricultural management decisions. As climatic conditions continue to change, ongoing monitoring of both average freeze dates and interannual variability will be important for understanding future agricultural risks and opportunities.
USDA Plant Hardiness Zones
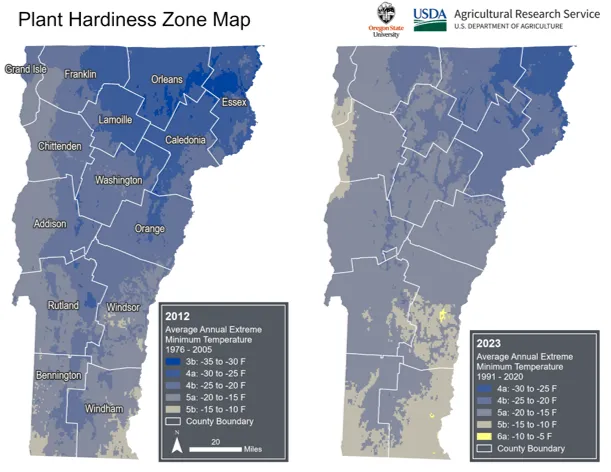
The USDA Plant Hardiness Zone metric classifies plant growing conditions based on average annual extreme minimum temperature, which can determine the survival of perennial plants and winter annual crops (Daly & Rounsaville, 2025; USDA, 2023). Vermont’s hardiness zones have shifted warmer and northward between 2012 and 2023 (Figure 6‑5). Vermont’s coldest zone (3b) has completely disappeared, and the second coldest zone (4a) has shrunk significantly, while a new warmest zone (6a) is now included in the state. Zone 5a now covers most of the state, and zone 5b has increased in southern Vermont and along the coast of Lake Champlain.
Source: Daly et al. (2012)
Note: Visualization by Hannah C. Turner
6.3.2 Soils
The increasing frequency of high-intensity, short-duration rainfall events has intensified erosion on agricultural lands (DEC, 2026; Ross et al., 2019). Following the 2024 flooding events, farmers across Vermont reported substantial agricultural losses, with “damage to soils or land” being the most frequently reported impact (VAAFM, 2024b). Lost topsoil cannot be replaced quickly and often leads to overall soil degradation and decreased crop yields (Magdoff & Van Es, 1993; Shirzaei et al., 2021).
Soil erosion can require significant time and financial investment for farmers to manage, depending on its type and severity. Sheet erosion refers to uniform removal of a thin layer of soil, while rill erosion occurs when runoff concentrates and creates small channels. Both sheet and rill erosion result in a loss of topsoil and potential productivity, but farm operations can usually continue after soil is smoothed out by tillage (Workman, 2017). Gully erosion is characterized by deep, defined channels that form from fast-flowing runoff with high erosive energy. Gully erosion is typically too deep for tillage operations to repair and can require costly restoration work with earth-moving or structural interventions (Knight & Hodgson, 2018; Workman, 2017). As heavy precipitation events become more frequent, the risk of all three types of erosion is expected to increase.
Through surface runoff, leaching, and erosion, essential plant nutrients are lost from agricultural fields. These nutrients must be replaced to maintain productivity, increasing production costs and dependence on external inputs. Some Vermont farmers describe nutrient runoff as “throwing money away” (White et al., 2021a). Nutrient loss contributes to declining downstream water quality, a problem exacerbated by climate change (see Water Resources 4.5.2). Strategies to reduce soil erosion and maintain nutrients on the farm include maintaining vegetation cover (e.g., cover crops, mulch), reducing soil disturbance through conservation tillage, crop rotation, strip cropping (e.g., planting alternating strips of erosion-resistant crops like hay or legumes with erosion-prone row crops like corn), and contour planting (e.g., cultivating along a fields natural elevation lines; NRCS, 2009).
Soil health relies heavily on soil structure, which is the network of soil aggregates and pore spaces that enable water infiltration, air exchange, and root growth (Rabot et al., 2018). During high-intensity rainfall events, raindrops detach soil particles from aggregates, and some material is redeposited onto the soil surface, partially filling pores and creating impermeable crusts that reduce soil function (Yang et al., 2020). Minimal soil disturbance and continuous ground cover can improve aggregate stability (e.g., the ability of soil to resist detaching when exposed to wind and water).
Livestock grazing and machinery-use on wet soils can cause compaction, further restricting water infiltration, root penetration, and crop establishment (Utemuratov et al., 2025). As the average last spring frost shifts earlier (Figure 6‑4), models project increasing rainfall in the three weeks preceding planting (Figure 6‑6), raising the likelihood for wet soils during planting time. Farmers may face increased compaction risk as they strive to maximize the growing season. Conversely, efforts to avoid compaction under wet spring conditions may delay field operations, potentially reducing crop yields and limiting access to early-season markets when crop value is highest (Wolfe et al., 2018).
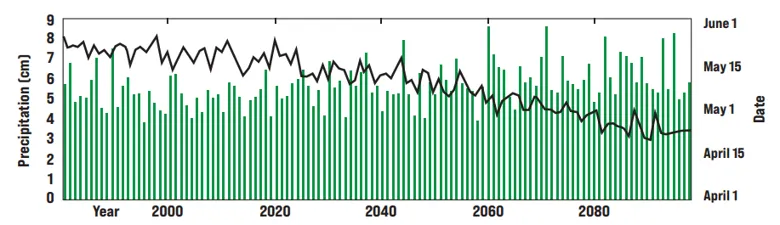
Source: Adapted from Wolfe et al. (2018)
Note: Projections on the impacts on climate change on temperature and precipitation are based on the Coupled Model Intercomparison Project Phase and downscaled to the Northeast U.S. Simulations of historical and future conditions in the 1979–2099 time period were based on a high emissions scenario
Cover crops help to address compaction and improve soil structure by maintaining roots that penetrate compacted layers in the soil, decompose over time, and form pockets and root channels in the soil (DeJong-Hughes & Daigh, 2022; Jabro et al., 2021). Certain cover crops, like those with deep taproots, are better at breaking up highly-compacted soil (DeJong-Hughes & Daigh, 2022; Jabro et al., 2021; Lawley, 2016). Repeated cycles of wetting and drying can cause Vermont’s clay-rich soils to swell and contract, which may help alleviate compaction (DeJong-Hughes & Daigh, 2022). However, these processes can also lead to the formation of deep cracks and preferential flow paths in the soil, potentially increasing sub-surface nutrient runoff (Ruggiero et al., 2022). Compaction can also be addressed by tilling below the normal plow depth to break up compacted soil layers (i.e., subsoiling). However, its effectiveness depends on soil type, soil moisture conditions, and subsequent management. In some cases, subsoiling can introduce tradeoffs, including reduced soil organic matter and an increased risk of erosion (Alves et al., 2024; DeJong-Hughes & Daigh, 2022; Grubinger, 2010).
Variable temperature and precipitation patterns can alter soil’s nutrient cycling, depending on soil type and management practices. For farmers, this means changes in how efficiently nutrients from manure and fertilizer are retained and made available to crops. Variations in temperature and soil moisture influence microbial activity and oxygen availability, which regulate biogeochemical processes. In some cases, warming conditions can increase microbial activity and nutrient release, but prolonged wet or dry extremes can disrupt these processes and make nutrient availability less predictable (Mao et al., 2025). For example, increased incidence of soil saturation creates anaerobic environments that promote microbial conversion of nitrate (NO3) to nitrogen gas (N2), increasing nitrogen losses as nitrous oxide (N2O) and reducing bioavailable nitrogen for crop uptake (Butterbach-Bahl et al., 2013). At the same time, reduced oxygen in saturated conditions slows decomposition rates, increasing soil organic matter (Butterbach-Bahl et al., 2013). Minimal soil disturbance through reduced or no till management can build soil organic matter and more stable nutrient cycling (NRCS, 2026), thereby helping buffer changes to nutrient dynamics under changing climate conditions. However, the effectiveness of any management practice will vary by soil type and daily weather patterns across Vermont.
Maintaining soil health is critical for farm resilience and climate change mitigation via carbon storage and sequestration, but these efforts can also be challenged by climate change (see 6.7.2). For more details on soil carbon sequestration in Vermont’s agriculture sector, see Chapter 10 in the Vermont Climate Assessment 2020 (Galford et al., 2021).
6.3.3 Native bee pollinators
In addition to domesticated honeybees, many Vermont farms rely on native pollinators like bees, flies, beetles, moths, wasps, hummingbirds, and bats to pollinate their crops (NRCS, 2017). Vermont is home to 352 species of native bees, more than any other New England state. About 60% of these species are considered vulnerable (Hardy et al., 2025). Native bee populations are declining due to pesticide use, habitat loss, pathogens, invasive and introduced species, and climate change (Albacete et al., 2023; Hardy et al., 2022; Nicholson et al., 2024; Potts et al., 2010; Richardson et al., 2019; see Box 6-1 and 6.4.2; see Fish and Wildlife 5.4.1 and 5.7.2).
These interacting factors can compound adverse effects; for example, climate-driven warmer winters can disrupt hibernation increasing native bees’ susceptibility to pesticide harm (Albacete et al., 2023). Climate-related changes in the Northeast U.S., including warmer winters, more intense precipitation, and higher maximum temperatures, are associated with a lower abundance of native bees, with different species experiencing varying degrees of impact (Kammerer et al., 2021). For example, intense precipitation and flooding can impact nesting activity, wash away pollen, and drown adults or larvae for native bees that nest underground (Xerces Society, 2026).
Population decline in native pollinators poses cascading risks to agriculture in the region. Native bees increase the yield and quality of various crops in Vermont. For example, blueberry yields have been shown to increase by 50–80% in the presence of native insect pollinators (Button & Elle, 2014), and native bees have been shown to improve both fruit quantity and quality (Nicholson et al., 2024).
Rising temperatures shift the suitable geographic ranges of native bees and the plants that depend on them (Liczner et al., 2023; Rahimi & Jung, 2024), threatening northern species especially (Hardy et al., 2022). Warming temperatures may cause plants to bloom or bees to emerge earlier, with potential for phenological mismatch (see Fish and Wildlife 5.7.2). Warm weather combined with periods of drought can decrease the amount of nectar available from plants, negatively impacting pollinator health and reproduction (Schweiger et al., 2010). Conversely, some species may benefit from longer growing seasons and milder winters, and southern species may expand northward into Vermont in the coming decades (Hardy et al., 2022).
Farmers can increase resilience to the effects of climate change on pollinators by improving habitats via planting hedgerows with diverse native plant species, allowing cover crops to flower, and adjusting mowing practices (Phillips et al., 2022). Farms can bolster ground-nesting species by minimizing ground disturbance, leaving woody debris on the ground, and reducing pesticide exposure (Phillips et al., 2022). Protecting native pollinators is critical for Vermont’s agricultural and ecological resilience. Climate change, habitat loss, and pesticide exposure threaten these species, but proactive measures like farmland habitat enhancement and shifting management practices for reduced pesticide use can help mitigate these risks, while sustaining pollinator populations and farm productivity.
6.3.4 Insect pests, weeds, and diseases
Warmer annual temperatures, longer frost-free seasons, reduced snow cover, and higher annual precipitation are increasing the prevalence of agricultural pests, weeds, and diseases in the Northeast U.S. (Wolfe et al., 2018). Projecting changes to pest pressures is complex due to the compounding impacts of climate change on host crops and natural enemies of insect pests (Heeb et al., 2019). New insect pests may arrive in Vermont as their ranges expand northward with a warming climate, some existing pests may become more prolific, and others may decline (Grubinger, 2011; see Forests 3.7.1). Damaging weed species, such as Johnsongrass, may also expand northward. Weeds like lamb’s quarters, ragweed, and Canadian thistle have a strong positive growth response to increasing atmospheric carbon dioxide (CO2) concentration, and so may become more prevalent (Heeb et al., 2019).
Longer, warmer summers may lead to migratory insects arriving earlier in the season (Wolfe et al., 2008) and enable more insect generations per season (Heeb et al., 2019), potentially leading to more rapid development of resistance to pesticides (Ma et al., 2021). With greater storm frequency (see Climate Change in Vermont 2.5), pest migration patterns could be altered potentially resulting in expanded pest geographic range, increased abundance, and increased arrival time variability (Sujayanand & Karuppaiah, 2016). Overwintering pests will likely become more abundant as milder winters increase their survival rates (Skendžić et al., 2021).
As dominant pest species shift, northern states like Vermont may have to adopt new pest management and monitoring strategies. Uncertainty in pest pressures make on-farm and regional monitoring crucial to understand how pests are changing and migrating (Grubinger, 2011; Heeb et al., 2019). Adapting to changing pest pressures will require establishing proactive pest monitoring to track changes over time, new or updated pest prediction models, and development of non-chemical control strategies and rapid-response plans for targeted control of invasive weeds and pests (Sutherst et al., 2011; Wolfe et al., 2018). New strategies, technologies, and practices must be carefully assessed to minimize risk from unintended environmental consequences and to ensure that climate vulnerabilities are not exacerbated.
Climate change will affect the incidence and severity of animal and crop diseases by affecting the growth, reproduction, dispersal, and survival of pathogens and the susceptibility of host organisms (Heeb et al., 2019; Hossain, 2024). Critical host-pathogen systems that may increase prevalence due to climate change in the Northeast U.S. include (1) arthropods, including mosquitoes and mosquito-borne arboviruses, biting midges and Bluetongue virus, and ticks and tick-borne diseases (see Fish and Wildlife 5.4.2); (2) livestock viruses, especially bovine viral diarrhea; (3) pathogenic avian influenza; (4) enteric protozoans in livestock and poultry (e.g., Giardia, Cryptosporidium, Eimeria); and (5) gastrointestinal and pulmonary nematodes of livestock (Hristov et al., 2018). Excess rainfall can influence crop diseases, many of which require moisture to survive and spread (Singh et al., 2023), as well as promote root pathogens and foliar diseases that thrive in wet conditions (Grubinger, 2011; Heeb et al., 2019). Periods of drought may reduce some disease pressures, while increasing plant stress and susceptibility to other diseases (Heeb et al., 2019; see 6.4).
6.3.5 Atmospheric conditions
The atmospheric concentration of CO₂—which drives photosynthesis—has steadily increased over the last century. Increasing CO₂ levels can may increase crop yields, though measuring this is challenging due to the influence of multiple interacting factors (Zhu et al., 2023).
Climate change is causing more intense wind events and stronger storms, fueled by warmer temperatures (Dupigny-Giroux et al., 2018; Hayhoe et al., 2018; see Climate Change in Vermont 2.6). These intensified storm and wind events can damage farm infrastructure, exacerbate soil erosion, exacerbate pest and disease pressures, and harm crops. Climate change is also increasing the conditions for wildfire development and expansion. Wildfires in Canada have contributed to periods of poor air quality across Vermont, which can impact crop productivity (Kabeshita et al., 2023) and expose farmworkers and livestock to smoke and particulate matter (See Human Health 10.5.3).
Ozone levels are rising and are predicted to increase 25% by 2050 and 60% by 2100 (Nowroz et al., 2024). Ozone in the upper atmosphere (stratosphere), commonly known as the “ozone layer,” protects Earth from solar UV radiation, but ozone present at the ground layer (troposphere) can disrupt plant physiology, including respiration and water and nutrient uptake (EPA, 2026; Nowroz et al., 2024). Ozone is most common in urban and industrial areas but can be transported to rural areas by wind (EPA, 2026). Vermont’s observed ozone concentrations have been decreasing and visible foliar injury is rarely observed, largely due to effective regulations on emissions (Leon & Nevins, 2018; Whitney et al., 2014). Current ground-level ozone concentrations in Vermont are above natural conditions, and plant impacts, such as reduced photosynthesis, reduced plant growth, and increased susceptibility to disease and insect damage, can occur without visible foliar injury at current ozone concentrations (Leon & Nevins, 2018; Nowroz et al., 2024).
6.4 Agricultural sector impacts and adaptation strategies
6.4.1 Summary of production impacts
Climate change can lead to agricultural land that is too wet (excess moisture, flooding), too dry (drought and water stress), too hot (warming and heat stress), or too variable (Table 6‑1). Impacts and adaptation strategies on dairy and livestock, field and forage crops, vegetables, maple, and fruit crop sectors are described below.
| Climate Category | Climate Impacts | Adaptation & Resilience |
|---|---|---|
| Excess Moisture, Flooding & Wet Soils |
|
|
| Drought & Water Stress |
|
|
| Warming & Heat Stress |
|
|
Note: There are several strategies for managing overall climate impacts and increased uncertainty: protect soil health and water quality, build high tunnels, maintain crop variety and diversify species’ selections, upgrade and maintain equipment, apply integrated pest management, diversify plant breeding, and apply agroforestry practices
6.4.2 Dairy and livestock
Changes in temperature and precipitation affect animal health, quality and quantity of feed, and grazing land management for livestock producers.
Temperature
Higher temperatures and increased humidity are expected to increase heat stress for large livestock like dairy and beef cattle, with dairy production most impacted (Hristov et al., 2018). Heat stress affects feed intake, metabolism, and physiological function, leading to declines in milk yield and quality (Hristov et al., 2018; Rhoads et al., 2009). Heat stress risk is commonly estimated using the Temperature-Humidity Index (THI), a metric combining air temperature and relative humidity (Hristov et al., 2018). Milk production begins to decrease when THI is above 72 (Freitas et al., 2006; Ravagnolo & Misztal, 2000) and production drops by approximately 1% for each unit above that threshold (Jordan, 2003). High-yielding cows that produce more than 77 lb (35 kg) of milk per day could incur losses of nearly 5 lb per day when the average THI is 68 or higher for 17 hours or more a day (Collier et al., 2012). While the number of heat stress days under late-twentieth century conditions in Montpelier averaged below 20 days, this is projected to increase to over 80 days by the end of this century under a high-emissions climate change (i.e., business-as-usual) scenario (Gunn et al., 2019; USDA, 2020; Figure 6‑7).
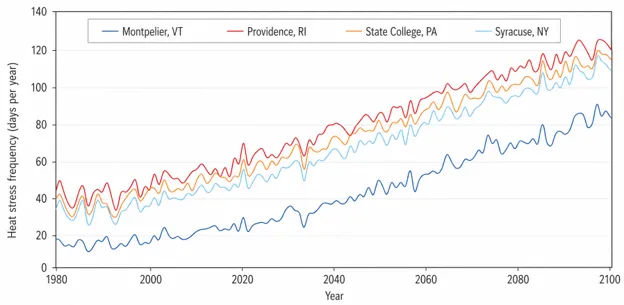
Source: USDA (2020)
In areas of the U.S. with temperate climates, one climate model using a high-emissions (RCP 8.5) scenario estimates that milk production will decrease 2.7% (4.78 billion pounds), between 2005–2100 due to heat stress (Thornton et al., 2022; USDA, 2006). A meta-analysis of 34 studies highlights heat stress impacts on milk quality, with energy-corrected milk (i.e., milk adjusted for energy content) decreasing by 17.9% and milk protein decreasing by 3.9% (Chen et al., 2024). Additional physiological responses to heat stress include altered hormone status, reduced nutrient absorption, increased inflammation, impaired immune function, and reduced growth and reproduction (Hristov et al., 2018; Rhoads et al., 2009). Animals held in warm, humid barns may be more vulnerable to infections and diseases, as heat stress suppresses immune response, and high humidity increases exposure to pathogens and parasites (Hristov et al., 2018).
For cattle, pigs, and poultry, heat stress can negatively affect meat quality through acute or chronic stress, dehydration, and other physiological responses (Gonzalez-Rivas et al., 2020). While beef cattle may respond to heat stress by reducing feed intake and growth, research suggests that the magnitude of productivity loss due to heat stress is generally lower than that of dairy cattle due to their lower metabolic rates, and because calving typically occurs during cooler spring months (Hristov et al., 2018). In poultry, heat stress may reduce egg production and quality, inhibit pullet growth, and increase mortality (Hristov et al., 2018).
Sheep and goats generally have a greater tolerance for temperature variation compared to cattle due to their relatively small body size, lower feed and water requirements, and efficient feed conversion (Joy et al., 2020; Pardo & Prado, 2020). Heat stress in lactating sheep and goats can reduce milk yield and quality (Joy et al., 2020), and reductions in milk fat and protein content can be a significant issue for cheese production.
Adaptation strategies
Livestock producers can invest in cooling and ventilation systems to alleviate heat stress (Gunn et al., 2019). Natural and mechanical ventilation in livestock barns and housing can improve air quality and reduce heat stress. Some recommend a minimum air speed of about 200 ft/min (1 m/s) over cows resting areas for cooling (Reuscher et al., 2023). Sprinklers and misting can be used as an additional cooling mechanism. While some cooling strategies might not be economical in Vermont in the short-term, climate forecasts through 2100 highlight how cost-benefit analysis for investing in cooling systems may shift as climate change intensifies (Gunn et al., 2019). Heat stress increases water demand from livestock, so reliable water delivery systems, adequate flow rates, and strategic trough placement are important adaptation measures (Carrico, 2024).
On grazing lands, agroforestry practices like silvopasture (i.e., the integration of trees, forage, and livestock) and windbreaks help protect grazing livestock from temperature extremes (Brandle & Schoeneberger, 2014). Shade reduces heat load from direct solar radiation and has been shown to improve milk yield, increase conception rates, and decrease mastitis in dairy cattle (Schoeneberger et al., 2017). Shade also can enhance forage quality, supporting animal health and productivity (Schoeneberger et al., 2017). Research suggests that cattle provided with shade could reach their target body weight up to 20 days earlier than those without (Schoeneberger et al., 2017). Reductions in body temperatures of up to 1.4°F (0.77°C) have been associated with increases in weight gain of as much as 1.25 lb (0.57 kg) per day during summer heat stress periods (Brantly, 2013). Windbreaks can create localized microclimates, which protect livestock and improve temperature regulation. The potential benefits of these agroforestry practices must be balanced against reductions in available grazing areas and increased management costs.
Box 6-1 Climate impacts on honeybees
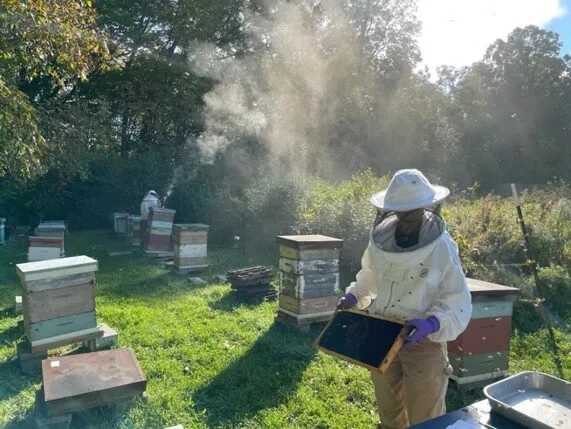
Vermont is home to an active community of beekeepers who produce honey and other value-added products and whose bees support pollination and crop production (Alger et al., 2022). In 2024, Vermont had 18,013 registered hives, a record high for the state, and 1,156 apiaries (VAAFM, 2025). Vermont’s beekeepers face numerous challenges, including climate change, pests, pathogens, and pesticides. In a 2024/2025 survey of 12 beekeeping operations in Vermont representing 35.7% of colonies, beekeepers reported an annual loss of 56.1% of colonies (Alger et al., 2026), similar to national averages of 55% losses. This was Vermont’s highest loss rate reported since annual losses were first tracked (2010–2011) and 14.2% higher than the 14-year average annual loss rate (41.4%) (Giacobino et al., 2025). According to Vermont respondents, top causes of colony loss were pesticide exposure and Varroa mites, followed by nutrition and disease (Alger et al., 2026). The Varroa mites spread deformed wing virus and acute bee paralysis virus to nearly all colonies tested at six large commercial beekeeping operations that transport hives across the U.S. (Lamas et al., 2025). For honeybees, warmer temperatures in late fall and winter are disrupting foraging patterns, colony age structure, and resource utilization, which increases colonies’ vulnerability to pests like Varroa mites and winter colony losses (Cox-Foster & DeGrandi-Hoffman, 2020). Additionally, increased droughts and extreme rainfall due to climate change are altering the phenology of flowering plants and causing pollen degradation and reduced nectar quality, thus disrupting food sources for bees (Cox-Foster & DeGrandi-Hoffman, 2020; Lawson & Rands, 2019).
Vermont lacks long-term data on bee losses, which is important to understanding causal relationships to habitat loss, pesticide use, pests, and pathogens (Alger et al., 2022). Supporting pollinator habitation, maintaining healthy bee stock adapted to Vermont’s climate, mitigating harmful pesticide exposure, and breeding for Varroa mite resistance are key adaptation strategies for apiculture (Alger et al., 2022; Charbonneau, 2025).
6.4.3 Field and forage crops
Vermont’s field crops mainly consist of small grains (e.g., barley, rye, wheat, oats, corn, and rice) and legumes (e.g., dry beans, soybeans) grown for food, forage, or oil. Forage crops include perennial cool-season grasses, perennial legumes, and corn silage grown to feed livestock as pasture, hay, or silage. About 70% of Vermont’s agricultural crop land is used for production of livestock forage (USDA, 2024). Rye and winter wheat are typically a cover crop in rotation with other field and forage crops.
Climate change is altering temperature, precipitation, and frequency of extreme weather events in Vermont, impacting crop productivity, quality, and management for field and forage production.
Temperature
While longer growing seasons and increased atmospheric CO2 may increase heat stress, drought, pest pressure, and reduce nutritional value (Tobin et al., 2015), they also have the potential to increase yields for field and forage crops. For example, farmers can use longer season corn hybrids or double cropping with small grains to increase total forage productivity per acre (Hristov et al., 2018). Longer growing seasons may also expand the grazing season or allow for more hay harvests (Thivierge et al., 2023).
Vermont’s annual number of very cold days (minimum temperature <0°F/-17.8°C) declined by 3.6 days per decade since 1990 (see Climate Change in Vermont 2.4.3), which may benefit perennial forage crops by reducing winter cold injury. However, this depends heavily on water availability and seasonal timing of precipitation. For example, increasing winter thaws and reduction in precipitation as snow may reduce snow cover, thereby increasing susceptibility to injury from ice encasements with more frequent freeze-thaw cycles (Qian et al., 2024). More frequent freeze thaw cycles can result in soil heaving, or expansion and contraction, and push tap-rooted forages like alfalfa out of the soil (Qian et al., 2024). False springs can reduce crop yields by breaking plant dormancy early and increasing susceptibility to damage by a hard frost or freeze (Kral-O’Brien et al., 2019).
Precipitation
While field and forage crops may benefit from a longer growing season, increasing precipitation during late winter and early spring months may delay pasture access and hay harvest (Hristov et al., 2018; Wertlieb & Smith, 2019). Delayed planting due to spring rainfall can shorten corn’s growing season, resulting in immature corn that yield 65–85% of mature silage and exhibit variable energy content (Darby & Bosworth, 2024). Delayed harvest due to heavy rainfall in the fall increases the risk of frost damage, damage from pests and disease, and corn drying down too much, resulting in poorer quality feed and possible issues with fermentation (Ortez et al., 2023; Thomison et al., 2011). The combination of saturated soils and wind can also cause lodging in corn stands where plants partially or fully fall over (Lindsey et al., 2024). Excessive rain and increasingly variable weather patterns can also damage small grain and legume crops, delay planting and harvesting, reduce grain quality, and increase disease (Tobin et al., 2015).
Dry beans (including soybeans) are sensitive to both early season soil saturation and excessive rainfall near harvest, which can reduce yields (Darby et al., 2024). In addition, warmer springs and more intense rainfall events elevate the prevalence of seed- and soil-borne diseases, including anthracnose, Ascochyta leaf spot, white mold, bacterial blights, and damping-off, which negatively impact the productivity, quality, and marketability of beans (Sassi & Hazelrigg, 2025).
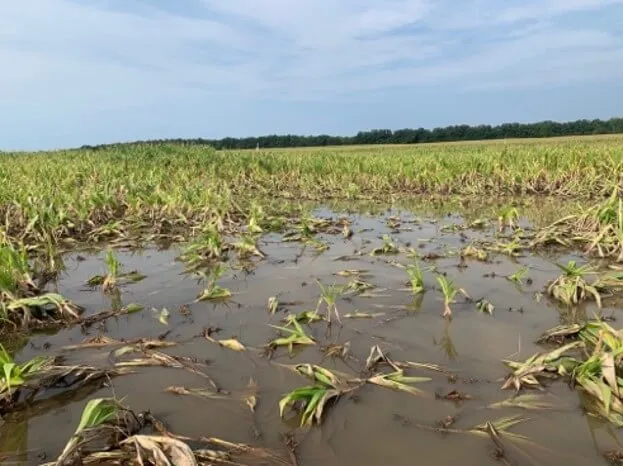
Field and forage crops contaminated by floodwater may be unusable, depending on the presence of silt, bacteria, fungi, chemicals, and heavy metals (FDA, 2024). Floodwaters may introduce and spread fungi like Fusarium, which produces several toxins of great concern for animal health. The likelihood of infection in corn starts with wet conditions and increases the longer the corn stands in the field (Darby, 2023). Toxin production can be mitigated by limiting oxygen and creating optimum fermentation conditions post-harvest (Darby, 2023). Farmers have to handle flood-contaminated forage crops for feed on a case-by-case basis, creating additional management burden (Bosworth et al., 2023; FDA, 2024). Crops grown for human consumption may be jeopardized entirely, due to food safety concerns (FDA, 2011).
Drought
Drought poses significant risks to field and forage crops’ yields and quality. Growth rates of cool-season perennial species like timothy, orchard grass, and clover slow considerably when conditions are hot and dry, colloquially referred to as the “summer slump” (UVM Extension, 2021). Extended heat and drought increase the time required for these plants to fully recover following harvesting/grazing, potentially reducing the number of harvests and total yield. Farm income can decrease directly through reduced sales or indirectly through increased feed purchases to meet livestock feed needs (Gaffney, 2025). Insufficient recovery time between harvests leads to decreased plant root growth, ultimately impacting plant productivity and longevity. Maintaining adequate production may require costly reseeding, adding irrigation, or renovation, all of which would further increase production costs.
While corn is better adapted to hot and dry conditions than cool-season species, drought conditions during key developmental stages can reduce corn silage yield and quality. Drought stress experienced early in the year largely reduces overall dry matter yield as vegetative growth is slowed. Drought during reproductive stages—e.g., beginning after tasseling—reduces grain formation and silage energy content (Ortez et al., 2023).
Recent floods and droughts in the state posed unique challenges to those Vermont farmers who experienced both a flood and a drought in the same growing season (Box 6-2).
Adaptation strategies
In response to increasingly variable and extreme conditions, Vermont field and forage growers are advancing a range of adaptation strategies. Crop diversification—both in species and varieties—can help maintain production during temperature and precipitation extremes and increases in disease and pests (UVM Extension, 2021). Incorporating annual forages into perennial systems can help buffer farmers against climate and economic challenges by compensating for seasonal decline in cool-season grasses. Increasing diversification within crop rotations and cover cropping can improve soil health and maintain water quality. Rye has become a leading cover crop in the Northeast U.S. because it is cold-hardy, provides rapid soil cover, and its deep-rooting system helps prevent both erosion and surface-level compaction (Grubinger, 2021).
Vermont farmers are experimenting with novel flood-tolerant grain crops, such as rice, as they seek to continue to use frequently water saturated soils. Rice has developed unique growth adaptations to survive in submerged conditions by transferring oxygen between shoots and roots (Nishiuchi et al., 2012). These adaptations allow most rice plants to survive 5–7 days under submerged conditions, while corn may only survive 48 hours (Timmerman et al., 2018; Zhu et al., 2023). In addition to flood resilience, rice may capture higher returns than other field crops. One farmer estimated a return of $12,000 per acre of rice compared to $350–$850 per acre for corn (Kelley, 2023). While flood tolerance is the main advantage of rice cultivation, rice can be grown in dry conditions, as exemplified in trials at the Cornell Cooperative Extension Tioga County’s Hilltop Community Farm (Kelley, 2023). The potential of rice to be agronomically viable on otherwise marginal land must be matched with a reliable market as a new crop for the region.
Adaptive harvest management is a helpful strategy for heat stress and drought. While frequent cutting maintains species in high-nutrient vegetative stages, excessively low-cut stands can affect productivity, forage quality, and weed pressure. Farmers can adapt forage harvest management with consideration for warmer and drier conditions by adjusting harvest frequency and cutting height.
Agricultural drainage strategies can help address reduced crop yields caused by excess water (Ghane, 2025). Subsurface tile drainage is an increasingly popular strategy for poorly drained soils in Vermont, lowering the water table below the crop root zone to reduce waterlogging (Ghane, 2025). When properly designed and managed, tile drainage can improve crop yields (Rui et al., 2024) and reduce nutrient loss from surface runoff (Klaiber et al., 2020). However, in Vermont’s clay-rich soils, natural shrink-swell behavior can create large cracks that act as preferential flow pathways, increasing nutrient losses through tile drains to downstream waters (Ruggiero et al., 2022). Potential water quality impacts are among the foci of ongoing research evaluating tile drainage in combination with other best management practices (Seyler, 2026).
Sustaining Vermont’s field and forage systems under climate change will require integrated strategies that combine crop diversity, soil health management, adaptive harvest timing, and water management for emerging crops. Productivity gains from longer growing seasons will be realized only if they are matched with resilience to precipitation extremes, drought stress, and evolving pest and disease pressures.
Box 6-2 Flood and drought losses of forage crops
Weather patterns are shifting rapidly between extremes, and farmers may be challenged by more than one precipitation and temperature extreme in the same or consecutive years. In 2025, Vermont farmers experienced two record-setting precipitation events, extreme spring rainfall, and summer drought, and it was the third year in a row of weather-related agricultural disasters. Farmer surveys of losses and damages due to flooding and drought (2023 and 2024) describes the scope and scale of damages to farms but is not a comprehensive accounting of losses.
2023 Flood Loss and Damage Survey (VAAFM, 2023a):
- 34% loss of feed crops was the most significant damage type to their operation.
- 53% anticipated feed shortage or problems with feed quality due to the severe weather and flooding.
2024 Flood Loss and Damage Survey (VAAFM, 2024a):
- 19% loss of feed crops was the most significant damage type to their operation.
- 40% anticipated feed shortage or problems with feed quality due to the severe weather and flooding.
2025 Drought Impact Survey (VAAFM, 2026):
- 31% loss of feed crops was the most significant damage type to their operation.
- 52% reported feed shortages, with 24% rating their shortage as severe, and 28% as moderate.
- 42% reported having to purchase more feed.
27% reported reduced production from animals.
6.4.4 Vegetables
Vegetable production is growing in Vermont; in the last 20 years there has been an 80% increase in the number of farms, a 39% increase in acreage, and a 302% increase in sales (Grubinger, 2024a). Vegetable farms in Vermont tend to be highly diversified, growing a mix of vegetables and other specialty crops like berries, flowers, herbs, and tree fruits (Grubinger, 2024a). Climate change presents both challenges and opportunities for Vermont’s vegetable farms, and the degree of impact varies by crop type and management practices. Extreme and increasingly variable weather, excessive rainfall, more frequent flooding and drought, heat stress, and changing pest pressures create major production risks. The lengthening growing season can improve yields, extend planting windows, and increase the number of sequential plantings per season for certain crops.
Temperature and growing season
Warmer summer temperatures, specifically the number of days above 90°F (32°C), coupled with potentially increasing periods of drought, will expose more crops to heat stress during the growing season. Heat stress in vegetable crops can delay germination, scorch or sunburn leaves, inhibit root and shoot growth, cause poor fruit set, and decrease crop quality (Aleem et al., 2020). Cool-season vegetables like potatoes, lettuce, cabbage, and peas may become more challenging to grow, while tropical crops like tomatoes, peppers, and melons may benefit from warmer temperatures (Aleem et al., 2020; Tobin et al., 2015), although heat stress during critical stages of development can damage even warm season crops (Tobin et al., 2015). The lengthening growing season can improve yields of fall-harvested crops (e.g., winter squash), add to the number of sequential plantings per season for crops (e.g., sweet corn), and extend the planting window for cover crops (e.g., rye and oats; V. Grubinger, personal communication, 2025). Variable growing seasons and warmer temperatures may prompt adoption of warm-season crops in rotations, heat-tolerant cultivars, and shifted planting dates to avoid mid-summer heat exposure. Management adaptation strategies like cooling overhead irrigation, shade cloths in high tunnels and greenhouses, and altering types and timing of soil surface mulches may help minimize heat stress (Tobin et al., 2015).
Precipitation
Climate change is causing Vermont’s average annual precipitation to increase; however, the timing and intensity of rainfall is more variable and often results in periods of flooding and drought. Water is among the key determinants of vegetable yield, and producers are likely to face production challenges without sufficient water for irrigation (Tobin et al., 2015). However, drought conditions minimize the presence of foliar and soil-borne diseases due to lack of moisture, which can be favorable for vegetable production when adequate irrigation is available.
A grower survey found 84% of vegetable farms use irrigation on some portion of their fields, with 47% reporting that they irrigated most or all their production (Grubinger, 2023). It is likely that additional irrigation will be put in place to adapt to more frequent dry periods.
Water consumption and availability for crops can be optimized by scheduling irrigation to match crop needs. Drip irrigation is the most efficient way to apply water as it is delivered directly to crop roots, whereas overhead (solid-set or traveler) systems use more water, apply it to the entire field, and typically require more labor to operate (Schattman et al., 2020). Sprinkler systems require larger pumps because they move more water and, thus, consume more energy to operate. Farms that irrigate from deep wells, rivers, lakes, or municipal water may withstand a long drought, but farms that rely on ponds, streams, or shallow wells may run out of water during periods of drought or water stress.
Excessive and extreme rainfall can reduce crop yield and health by impeding soil cultivation and delaying planting, crop maintenance, and harvesting (Tobin et al., 2015). Intense rainfall can damage crops directly by breaking off leaves, stems, flowers, and fruit, or indirectly by saturating soils and depriving roots of oxygen. Installation of raised beds, tile drains, and/or field swales can help remove excess moisture from soil. Frequent rain almost always leads to crop disease, because many plant pathogens thrive in moist conditions. Diseases may reduce the quality and marketability of crops even when yields are unaffected. Increased rainfall can lead farmers to increase their applications of fungicides to protect crop tissue.
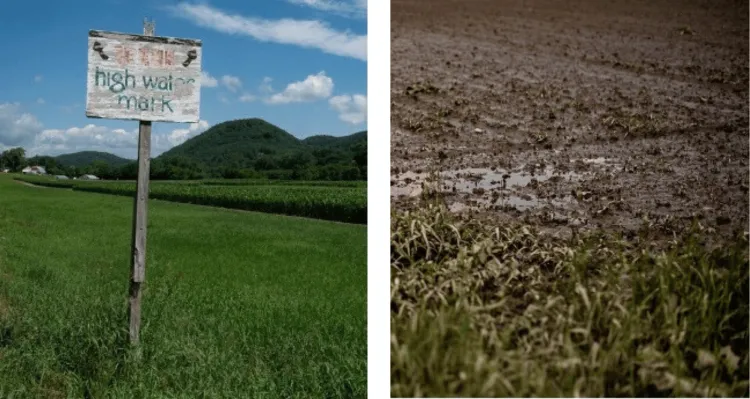
Floodplains are well-suited to crop production because they are flat, fertile, and near an irrigation water source. Many vegetable farmers have fields that flood in the spring after snow melts, and farmers can cope by delaying planting until soils dry out. More intense flooding later in the season due to climate change will be more disruptive to vegetable farms and farmers may not be able to as easily adapt. Flooding can damage crops, erode soil, disrupt management routines, and render relatively unscathed vegetable crops unmarketable (Box 6-3). The U.S. Food and Drug Administration have a zero-risk policy that deems any edible portion of a crop that is touched by floodwater to be potentially unsafe for human consumption (FDA, 2011). Floodwater can contain biological and chemical contamination, including pathogens—such as E. coli, Salmonella and hepatitis— that cause foodborne illnesses (FDA, 2011; see Human Health 10.8.3). Chemical contamination of hydrocarbons and heavy metals from overflowing sewers and industrial sites pose additional risks (FDA, 2011).
Pests and diseases
Vegetable farmers identified Alternaria leaf spot as a top disease in brassica plants (e.g., cabbage, broccoli, kale), which is projected to become more common under higher temperatures and elevated CO2 (Gullino et al., 2018; UVM Extension, 2020). Key pests include flea beetles, which thrive after milder winters, and cabbage loopers, which favor the wetter conditions from prolonged precipitation (UVM Extension, 2020). A threat to nightshade vegetables is the Colorado potato beetle, which develops and feeds more rapidly with warming temperatures (Hazard, 2022). The tomato hornworm, an overwintering pest, may increase threat to tomatoes under milder winters (Hazelrigg, 2023). Tomato plants that receive inconsistent soil moisture while the plant is young are more vulnerable to blossom-end rot, even if there is sufficient calcium in the soil (Hazelrigg, 2023). Warmer temperatures are also expected to increase weed pressures (Tobin et al., 2015), especially when combined with wet weather impeding timely cultivation.
Adaptation strategies
Members of the Vermont Vegetable and Berry Grower Association identified climate change and extreme weather as a top issue affecting the success of vegetable and berry farming, second only to farm labor availability (Grubinger, 2023). Farmers’ comments underscored the immediacy and breadth of these concerns:
Extreme weather could make it too discouraging to continue farming.
Climate change [is my] #1 issue as it affects almost everything.
The weather in Vermont has become incredibly unpredictable and with a warmer climate, we will be forced to learn how to manage new pests and diseases.
Climate change means wetter weather in the Northeast. We need help adapting which means drainage, disease control, and crop protection structures.
While many Vermont vegetable farms are already highly diversified, maintaining or increasing diversification in crops and production methods is a key climate change adaptation strategy. Diversification strategies include selecting crop varieties with a diverse range of tolerances to adverse conditions, as well as spreading out the timing of planting and harvest to reduce vulnerability to specific extreme weather events. Producers can match crops to landscape position and risk; for example, sequential plantings of fast-maturing crops such as lettuce may reduce mid-season flood losses compared to slower-maturing crops like winter squash in flood-prone areas. Diversification extends to distributing production across fields with differing environmental characteristics to reduce overall risk. This may include farming both within and outside floodplains or across a range of soil textures; for example, planting in fields with well-drained sandy soils that recover quickly after heavy rainfall as well as fields with heavier clay soils that retain moisture during dry periods. Some farms have these options within their mix of fields; other farms may be seeking new locations to rent or purchase to increase their overall operational resilience to extreme weather.
There are many tools that modify or protect the crop microclimate and can be used to adapt to climate change impacts. These include low and high tunnels, row covers, insect netting, shade cloth, synthetic mulches, landscape fabrics, and tarps (Ng & Ghimire, 2023). Adaptations like high tunnels that provide a protected growing environment can help limit the negative impacts of climate change for vegetable and berry growers but they have their own vulnerabilities. Most vegetable farms in the state use high tunnels to control temperature and moisture for crops sensitive to weather variabilities and to extend the growing season. While high tunnels are a useful adaptation strategy, like many other farm structures, they are vulnerable to damage from high winds, snow, and flooding. To best prepare high tunnels for extreme weather, producers can avoid building in wet or flood-prone areas, install drainage, leave room for snow clearing around tunnels, consider locations where there will be good cross ventilation, and apply structural reinforcement to support snow loads and withstand high winds (Maden et al., 2024; Practical Farmers of Iowa, 2021). Other key adaptation strategies for vegetable producers include cultivating new varieties, shifting planting dates, and increasing use of integrated pest management (IPM; Tobin et al., 2015).
Box 6-3 Adaptation on farms in floodplains
As farms in floodplains are at increased risk of flooding, farmers are exploring changes to their farm businesses. For example, some have shifted to growing shorter cycle crops like leafy greens, which are easy to harvest right before risk of floods (Munson, 2024).
Spanning 350 acres in Burlington’s floodplains, the Intervale Community Farm lost the majority of production in the July 2023 and 2024 floods (Sadoff & Barton, 2018). One independent farm within the Intervale lost all their crops in 2023, a loss of $250,000–$300,000 (Tara, 2024).
A farm in Royalton lost 75% of their crop in 2023 flooding and have adopted several adaptation strategies. They are using strip cropping, planting in long rows and placing more mature and flood-resilient crops near riverbanks and planting higher value crops closer together in areas less likely to flood. They have planted vegetables within banks of rye and clover to stabilize soils. They established riparian buffers ~30–50 feet wide along the riverbed to slow water down and reduce flooding (Russell, 2024; Storrow, 2025).
Farmers also emphasize diversification as an important strategy to combat flooding (Cavanaugh et al 2024).
6.4.5 Maple
Climate change is expected to have a significant impact on the maple industry in Vermont. Maple sap harvest timing and maple syrup production are sensitive to climatic conditions before and during production and exhibit substantial interannual variability (Duchesne & Houle, 2014; Skinner et al., 2010). Climate change affects the maple sector through three key pathways: 1) by changing the timing and variability of the sap harvest season; 2) by shifting habitat and pest pressures; and 3) by shifting precipitation patterns, which can damage trees and sap collection systems (Wang et al., 2025).
Temperature and spring freeze-thaw
Maple trees require a daily variation in temperature to induce sap flow in the leafless state. Freezing temperatures (at or below 32°F/0°C) followed by above-freezing temperatures generate pressure differentials within the tree xylem, resulting in sap flow when the bark is pierced. Historically, these freeze-thaw cycle conditions occur in Vermont between mid-February and early-April.
Warming winter and early spring temperatures result in an earlier sap flow period (Houle et al., 2015). The sap flow period now starts about 8 days earlier and stops about 11 days earlier compared to 40 years ago (Perkins, 2018; see Forests 3.8). The onset of the sap harvest period is projected to advance by another 4 days for every 1.8°F (1°C) degree increase in the average January–April temperature (Houle et al., 2015). Under future climate scenarios, this could result in the production season occurring 9–13 days earlier by the middle of this century, and 15–19 days earlier by 2100 (Houle et al., 2015). The timing of the sap flow period is expected to exhibit strong year-to-year variability under projected climate scenarios (Houle et al., 2015); however, models predict the number of sap flow days will change very little through 2100 for the Vermont region (Houle et al., 2015; Skinner et al., 2010). It is inconclusive whether this shift in sap flow timing will substantially decrease overall maple syrup yields (Houle & Duchesne, 2020; Rapp et al., 2019). The impact on producers’ sap yield and quality will depend on their ability to adjust harvest operation methods and timing in accordance with long-term trends (Filteau, 2025; Houle et al., 2015).
Analysis of USDA National Agricultural Statistics Service (NASS) maple survey data indicates that Vermont maple producers have shifted their maple sugaring season significantly earlier since the 1960s (Figure 6‑8). Both average season start and end dates showed a statistically significant shift across the period, demonstrating that surveyed producers’ tapping seasons now begin and end earlier in the calendar year than in previous decades. Average tapping season start date advanced by approximately 2.2 days per decade, and average season end dates also shifted about 1.5 days earlier per decade. Reported season length did not exhibit a statistically significant long-term trend, which is consistent with model predictions for the region (Houle et al., 2015; Skinner et al., 2010). Together, these results suggest that producers are already adapting their tapping seasons in response to shifting sap flow periods. It is important to note that this analysis relies on producer-reported survey responses, and the data reflect producer management decisions in addition to climate conditions. Changes in respondent composition over time and potential recall or nonresponse bias may influence observed trends. Accordingly, results should be interpreted as changes in the timing of maple production activity rather than purely biological responses to climate.
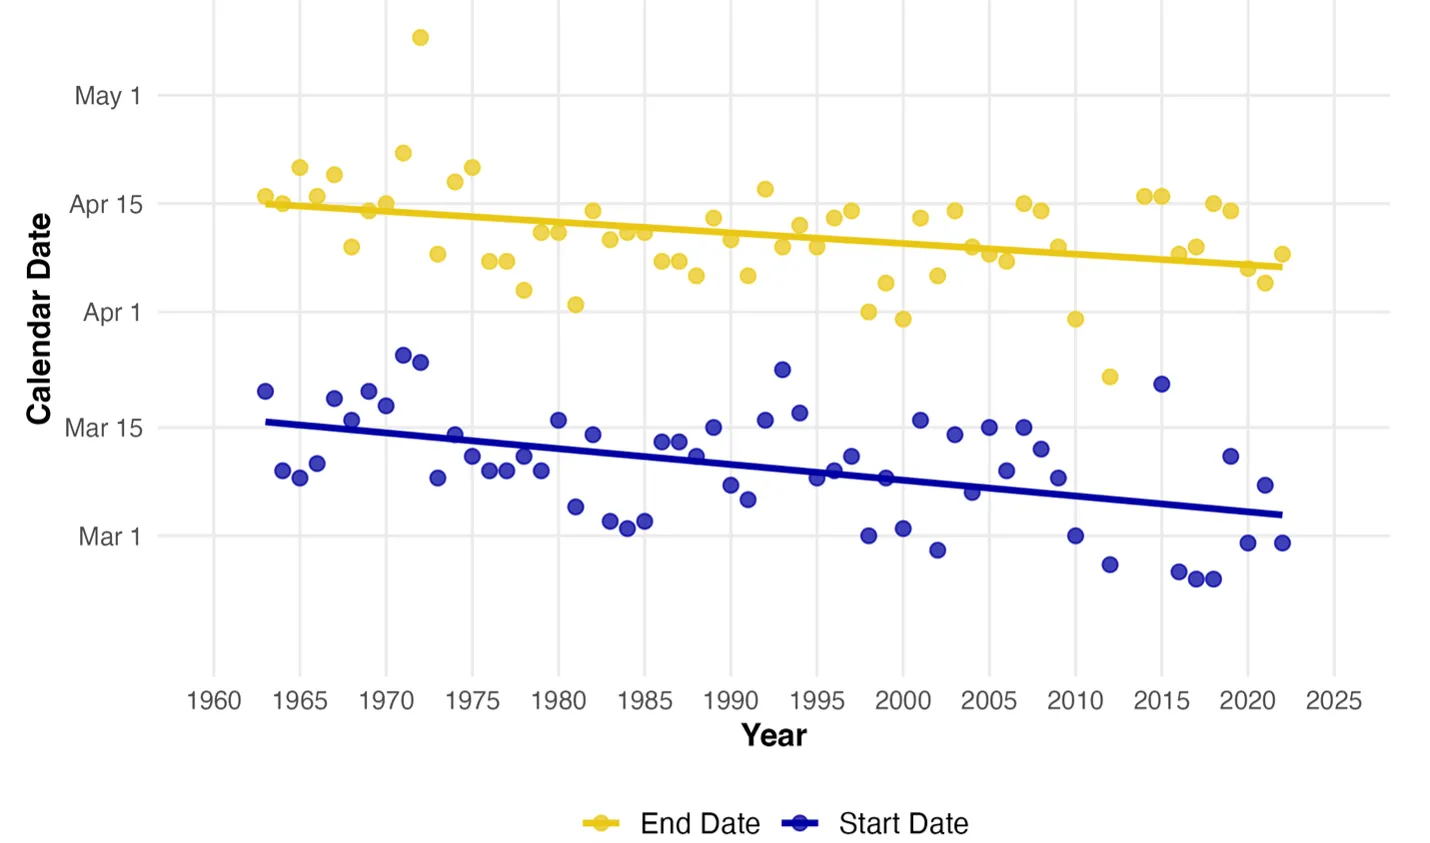
Source: USDA (2024)
Note: Original analysis by Megan Knight using USDA NASS Maple Syrup Inquiry Survey Data. Data was collected via mail and online surveys followed by interviews. Data were unavailable for season start dates in 2011, 2013, and 2014, and season end dates were unavailable in 2011 and 2013. These years were omitted from the analysis and no extrapolation was performed
Warmer temperatures outside of the sap flow season may also affect sap yield and quality (Duchesne & Houle, 2014; Wang et al., 2025). Relatively warmer and drier conditions during the preceding growing season have a positive effect on the following year’s sap flow, while high mean January temperatures in the preceding year are negatively correlated with yield (Duchesne & Houle, 2014). Climate variability may explain as much as 44.5% of the annual and regional variability in maple syrup yield (Duchesne & Houle, 2014). However, other factors like tree health and site characteristics affect maple syrup yield. Some research suggests these factors have more bearing on sap yields than climate-related interannual variability (Rademacher et al., 2023).
Future projections suggest a trend toward lower and more variable sap sugar content by 2100, decreasing by as much as 21–27% across the entire maple range (Morelli & Stinson, 2018). However, research is inconclusive on the significance of climate variability to explain variation in sap sugar content, with some research suggesting significant declines and others suggesting a potential increase in sugar content with warmer growing seasons (Houle & Duchesne, 2020; Rapp et al., 2019). Rising temperatures are also linked to changes in sap composition, such as increased mannitol levels, which can have a negative impact on syrup flavor and quality (Wang et al., 2025).
Climate change may shift the sap collection period earlier in relation to maple tree dormancy release, or bud break (see Forests 3.5.1), after which sap quality defects increase (Filteau, 2025). This means producers may experience a longer time period for collecting high quality sap and a decrease in end-of-season quality issues. This effect has a greater influence on gravity collection, highlighting the importance of adaptive harvesting methods when considering climate impacts on maple production (Filteau, 2025).
Habitat and pest pressures
Like many North American tree species, climate change is expected to shift the species range for the sugar maple northward (Talluto et al., 2017; Wang et al., 2025; see Forests 3.5.2). However, Vermont is highly likely to continue to be a suitable habitat for maple trees due to its position within the northern portion of the native range (Peters et al., 2020).
Models predict that 55–84% of sugar maples in Vermont will likely experience moderate to severe stress from climate change by 2071 (Oswald et al., 2018; see Forests 3.5). Sugar maple decline over the last 40 years has been linked, but is not entirely attributable to, a changing climate (Bishop et al., 2015; Oswald et al., 2018). Other weather and environmental factors play a significant role in the overall health of the maple population (Boakye et al., 2023). Increased climate stress may make trees more susceptible to other stressors, like pests and disease (Oswald et al., 2018; Silvestro et al., 2025). Increasing incidence of invasive species, pests, and disease outbreaks in forests (see Forests 3.7) pose a significant threat to the maple industry (Silvestro et al., 2025; Wang et al., 2025).
Precipitation and extreme weather events
Heavy rainfall, flooding, and storms can damage sugar maple trees and sap harvesting infrastructure (Wang et al., 2025). High wind speeds can exacerbate these damages (Wang et al., 2025). Winter precipitation in Vermont falling more often as rain than snow has resulted in a significant decrease in average annual snowpack. This is important, as winter moisture and snow are positively correlated with tree growth (Stern et al., 2023). Additionally, smaller snowpack can increase frequency and depth of soil freezing, damaging tree roots and inhibiting maple growth (see Forests 3.6.1). Drought may also negatively impact maple tree growth (see Forests 3.6.2). Overall, maple syrup yield has been found to be more sensitive to temperature than to average annual precipitation, with variation in rainfall associated with a small yield variation during the subsequent sap flow period (Duchesne & Houle, 2014).
Adaptation strategies
Maple is a unique production system that depends on weather conditions, as well as the long-term health of sugarbushes and forests. Vermont’s average annual maple production has been increasing due to higher tapping effort and new technologies like vacuum tubing that maximize sap yields. Many maple producers are already adapting to a changing climate (Ahmed et al., 2023) in harvesting methods and decisions, stand management, and sap processing practices.
Technologies like vacuum tubing that increase harvesting efficiency and overall production also serve to mitigate the effects of variable freeze-thaw cycles on sap flow (Morelli & Stinson, 2018). Research to determine how these practices affect overall tree physiology and to further understand how climate affects sap quality and quantity is ongoing. Producers need to carefully monitor the status of pests and diseases and potentially implement selective harvesting to avoid stressed trees (Ahmed et al., 2023).
Structural and ecological diversity in sugarbush forests can contribute to climate resiliency. Producers can work with University of Vermont (UVM) Extension agents and other professionals to identify the best climate adaptation interventions for their specific sites. Stand management practices may include thinning or planting, mulching, improving soil organic matter, integrated pest and disease management, tapping different maple varieties, and diversifying stand species (Ahmed et al., 2023).
Maple producers can explore business and economic adaptations, such as changing product offerings or marketing practices, increasing the production of value-added maple products, and finding new markets for marginal quality syrup (Wang et al., 2025).
6.4.6 Fruit crops
Climate change creates both risks and opportunities for Vermont’s production of tree fruits, berries, and grapes. Major climate-related stressors include late spring frosts, variable precipitation, heat stress, and increased pest and disease pressures.
Temperature and last frost
The combination of a warm spring followed by a late spring frost is a key climate change risk for perennial fruit production in Vermont. Once flowers begin to develop, they become increasingly vulnerable to cold temperatures with the highest level of risk occurring when flowers are fully open (Zinn et al., 2010). The critical temperature at which fruit development is harmed varies among crop species and stage of fruit development (Łysiak & Szot, 2023). Warmer springs may cause fruit trees to break their dormancy period earlier, resulting in earlier bud break and increased susceptibility to spring frosts (Bendorf et al., 2025). In 2023, Vermont experienced a late frost from May 17–18 when temperatures dropped to 25°F (-3.8°C) in Montpelier; this devasted primary buds for fruit crops and severely impacted that year’s yields (Krupp, 2023). A self-selected survey from UVM’s Fruit Program reported $5.8 million in orchard losses and most farmers reported losing 95% of revenue. Orchards that did not participate in the survey likely lost an additional $10 million (Scott et al., 2023).
Warmer winter temperatures, consistent with shifts in Plant Hardiness Zones, have reduced the likelihood of winter injury from fruit crops like peaches (Fairfax, 2025). However, peach flower buds and blossoms are very susceptible to cold temperature damage in the spring, so if warmer springs with late frosts become more common, production will be increasingly inconsistent.
Precipitation
Rising temperatures can reduce soluble sugars, fructose, and protein content in fruit crops, (Alaba et al., 2024). Climate change affects fruit production through a combination of heat stress and drought. For most fruit crops in the Northeast U.S, water demand is typically the highest in July, when temperatures are high and average precipitation may be very low. Increasing incidence of summertime drought will limit nutrient uptake, fruit development, and return bloom for the following growing season (Bendorf et al., 2025). Rising temperatures can also reduce soluble sugars, fructose, and protein content in fruit crops, which may undermine the nutritional value and marketability of wild blueberries (Alaba et al., 2024).
Increased precipitation and duration of precipitation events are impacting fruit plants and management. Higher spring precipitation will wet open blossoms, reducing pollen availability for pollination, and decreasing pollen viability (Bendorf et al., 2025). Extended periods of soil saturation in the spring can also affect nutrient uptake, root development, and overall tree growth (Bendorf et al., 2025). Saturated soils may delay the establishment of new fruit trees and grape vines (Bendorf et al., 2025). Soil management (e.g. cover crops to improve soil drainage) is essential to mitigate the effects of wet and dry soils (Bendorf et al., 2025). Increased drought will likely increase irrigation needs and associated infrastructure costs.
Pest and disease pressures
Climate change can increase pest and disease pressures (see 6.3.4) due to milder winters, warmer temperatures, and persistent wet conditions. Farmers in the region have already reported increased pest pressures, such as flies laying eggs in berries and destroying fruit (Fleury, 2022). Longer, warmer summers can enable more insect generations per season, allowing pests like codling moths (a major apple pest in the Northeast U.S.) to complete a third generation during the growing season (Heeb et al., 2019). The invasive spotted winged drosophila (Drosophila suzukii) may overwinter more frequently as winter temperatures increase (Tobin et al., 2015). Pests that arrive on storm fronts, like leafhoppers, may also increase in severity with climate change. Humidity and wet soils will favor insect larvae that thrive in moist soil, while drought will advantage others (Bendorf et al., 2025). Warmer and wetter conditions promote fungal pathogens, leading to earlier and prolonged epidemics. Powdery mildew may become more common in orchards and vineyards due to higher humidity and milder winters, though at temperatures above 95°F (35°C), mildew germination is inhibited (Bendorf et al., 2025). Similarly, instances of fungal diseases like grape black rot (Guignardia bidwellii) may increase due to increased moisture, temperature, and leaf wetness (Weigle, 2014).
Adaptation strategies
Adaptation to spring frost damage includes using wind machines and heaters, overhead sprinkler irrigation, and selecting cultivars that bud break later in the season (Bendorf et al., 2025). As temperatures warm and growing seasons extend, new varieties of fruits could be an adaptation option for Vermont’s growers. However, farmers should test and experiment with new varieties and work with UVM Extension agents or service providers to minimize risk before making large-scale changes in species or varieties. To cope with drought and preservice soil moisture, mulching with organic materials is typical in strawberry crops, and wood chips are commonly applied to blueberries; however, mulches can also increase the risk of rodent damage to tree fruits (Bradshaw, 2024). Installation of drip irrigation systems can help maintain consistent soil moisture for perennial fruit crops (Grubinger, 2014). Changing trends and severity of pests can be managed through IPM strategies. Overall, farmers will need to increase pest and disease monitoring and be prepared to take pest management action at different times in the season than they have historically.
6.5 Economic impacts and adaptation strategies
The economic impacts of climate change extend to the agricultural workforce, operating costs, food storage and transportation, and commodity prices (Walsh et al., 2020; Figure 6‑9). This section analyzes economics impacts and adaptation strategies at each stage of the food supply chain. Isolating the economic impacts of climate change alone is difficult—as it is one of many factors that affect the economic health of farms and food businesses (Walsh et al., 2020). Economic effects tend to “ripple” across the food industry, creating an additional challenge to measuring and quantifying climate change impacts. Food systems have a multiplier impact on local economies: analysis of New England's local food system found an average job multiplier in Vermont of 1.77, meaning that for every job created in Vermont's local food system, an additional 0.77 jobs are created in other economic sectors in the state (Rockler, 2023).
Vermont is impacted by climate change's impacts outside of the state through connections to regional, national, and international markets for food and agricultural products (Box 6-4).
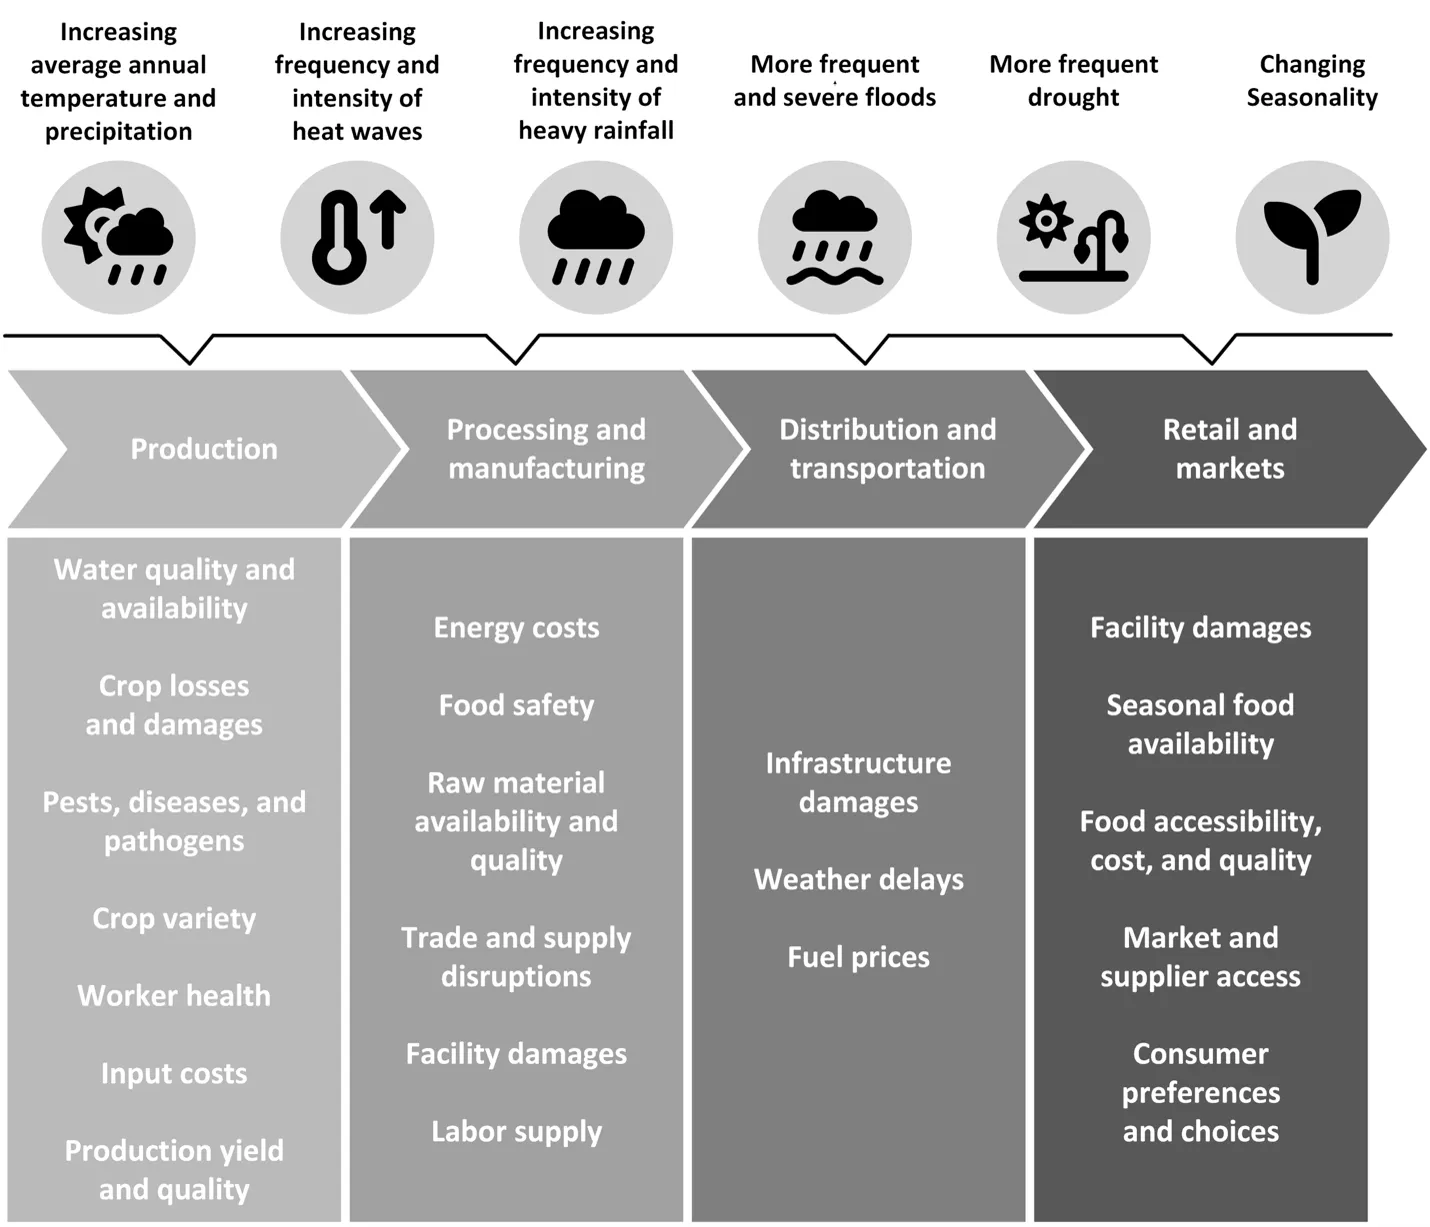
Source: Adapted from Mitchell et al. (2023)
6.5.1 Agricultural production
Climate change-related economic costs for Vermont’s farmers include crop and infrastructure losses and damages, labor hours required to clean up and recover from extreme events, insurance premiums, cost of input supplies and new infrastructure, and cost of additional adaptation strategies. There is a lack of reliable and accurate information quantifying the economic impact of climate change on Vermont’s agricultural producers. Economic impact indicators that are useful in other areas of the country, like crop insurance claims and payouts, are less reliable in Vermont because the majority of crops are not covered by insurance (VAAFM, 2023a).
Extreme weather losses and damages
While information on losses and damages from extreme weather events in Vermont is available, data is often specific to acute disasters (e.g., floods) and relies on self-reporting surveys, both of which likely create underestimates of damages. The Vermont Agency of Agriculture, Food, & Markets (VAAFM) launched Flood Loss and Damage Surveys in response to July 2023 and 2024 flood events, which displaced livestock and caused extensive damage to crops, soils, and infrastructure (VAAFM, 2023a). On average, respondents lost 28% of their annual income in 2023 and 25% in 2024 (VAAFM, 2023a, 2024a). In 2023, 57.6% of respondents reported that they expected a negative cash flow in the next year because of the severe weather and flooding; in 2024, 60% of respondents reported the same. In the 2023 survey, agricultural producers reported losses that exceeded $16,063,054 (VAAFM, 2023a) and $5,356,114 in the 2024 survey (VAAFM, 2024a).
Additionally, surveys conducted by the UVM Tree Fruit Program and Vermont Vegetables and Berry Growers Association reported widespread damage to fruit crops due to a late spring freeze in May 2023, with respondents reporting at least 95% crop losses, even though 70% of orchards had implemented frost-protection measures (VAAFM, 2023b). In total, this damage represented $10 million in orchard losses, and $1.2 million in vineyard losses (VAAFM, 2023b).
Follow-up review of damages reported to the Business Emergency Gap Assistance Program (BEGAP) estimates much larger economic losses compared to these initial surveys in both 2023 and 2024 (VAAFM, 2023b, 2024c). In 2023, $44,678,570 in damages to agricultural producers was reported and $69,592,774 in damages was reported when including food services, food and agriculture related retail, and manufacturing and processing damages (VAAFM, 2023b). As of December 17, 2024, $13,236,143 in damages was reported through BEGAP applications; though, detailed reporting that differentiates between agricultural producers and other related sectors (e.g., food services, food and agriculture related retail) is not available (VAAFM, 2024c). Some of these reported damages may be delayed submissions from 2023. Farmers have been largely unable to recover losses from extreme weather due to limited disaster relief funds and lack of insurance.
Farm recovery mechanisms
Financial support for farmers in emergencies includes crop insurance, emergency grant funding, and emergency loan financing available at local, state, and federal levels (Grubinger, 2024c). Most Vermont farmers are not insured against crop losses: a 2023 VAAFM survey found that 70% of farmers lack crop insurance, and only 7% of vegetable and berry growers had crop insurance (Rich, 2025). Farms may be covered by the Whole Farm Revenue Protection program or, for farms with approved revenue up to $350,000, the Micro Farm Revenue Protection program (FCIC, 2024, 2025). Participation is very low in both programs in Vermont, likely because they are not well understood and perceived as not cost-effective (Wells-Spackman, 2025). The Noninsured Crop Disaster Assistance Program is available for crops not covered by crop insurance; however, it provides very small payments relative to total losses according to grower feedback. In response to this gap, an act was proposed in 2025 to establish The Farm Security and Forestry Operations Security Special Fund (S.60), a state-level safety net to provide grants to help farmers recover from uninsured climate losses (Farm Security Special Fund, 2026).
Federal disaster assistance for farms is primarily administered by USDA’s Farm Service Agency and Natural Resources Conservation Service. At the state level, VAAFM runs the BEGAP for financial gaps and the Feed-Finder Marketplace to address feed shortages during crises. Nonprofit partners like the Vermont Community Foundation also provide financial support. Local efforts include the Emergency Loan Program administered by the Center for Agricultural Economy (CAE, 2026) and emergency grand funding from the Northeast (NOFA’s) Farming Association’s Farmer Emergency Fund (NOFA-VT, 2026). In response to the 2023 and 2024 floods, acute recovery campaigns such as the Intervale Farmer Recovery Fund and crowdfunding also provided important financial aid to farmers (Jad, 2024; Traynor, 2024).
Building long-term resilience requires investments that support farmers beyond the immediate aftermath of a disaster. UVM Extension’s survey following Hurricane Irene in 2011 found that crop diversification, non-farm income, pest planning, overproduction, and crop insurance were key strategies for managing risk (Cannella, 2013). Today, programs such as USDA’s Resilient Food Systems Infrastructure Initiative, Vermont Agency of Agriculture Working Lands Initiative, and the NOFA’s resilience grants all help strengthen farm viability by funding processing infrastructure, equipment, and on-farm projects. Additional opportunities to support diversification and ecosystem restoration include VAAFM’s Small Farm Diversification and Transition Grant, the Specialty Crop Block Grant, and USDA conservation programs, which restore surrounding ecosystems to better buffer farms against climate-related disasters.
Farm profitability and viability
Farmers in Vermont and New England define farm viability as their ability to stay in business and keep their land in agricultural production (Bruce et al., 2025). Many also include the social and environmental sustainability of their farm, and their ability to maintain their own health and wellbeing (Bruce et al., 2025). Traditionally, farm viability is defined as producing enough income from the farm enterprise to sustain the business and support the needs of the farm family; however, farmer reliance on non-farm revenue has increased significantly in the U.S., with over 90% of farmers now reliant on off-farm income for personal income (Bruce et al., 2025). Profits that are generated by farm enterprises are more often invested back into business operations than taken home by farmers (Bruce et al., 2025). The small or non-existent profit margins and reliance on off-farm income for farmers in Vermont highlight the unique vulnerability of small farms. After the historic floods in July 2023 and 2024, many farms were in danger of losing viability or report being overfinanced and underinsured (VAAFM, 2023a).
Farm business adaptation
Many farms are actively adapting to the impacts of climate change; however, cost and financial capacity are often a barrier to investment in adequate adaptation measures (Faulkner et al., 2022). Only 45% of farmers reported that they have the financial capacity to deal with extreme weather conditions (Faulkner et al., 2022). Farmers can face high barriers to implementing capital-intensive adaptation methods like new, upgraded, or relocated infrastructure, but the cost of insufficient adaptation measures may be even higher. Physical infrastructure, like high tunnels, greenhouses, livestock cooling facilities, crop storage facilities, and irrigation or drainage systems, represent a substantial capital investment which may require taking on debt.
Cost-share programs for specialized equipment may lessen the financial burden of adaptation equipment and infrastructure, like Natural Resources Conservation Service EQIP high tunnel initiative (NRCS, 2025). Alternative financial streams such as community-supported agriculture programs can help farms with upfront costs like farm improvements or adaption strategies. However, there is still a gap in access to financial tools that farmers need to adapt to climate change (White et al., 2018, 2021b). Farmers can develop climate adaptation plans outlining their specific risks and impacts to help them prioritize adaptation investment options. VAAFM has extensive resources in business-planning for farmers based on farm size and need (VAAFM, 2026).
Farms may modify and diversify their business strategies to cope with increased weather variability (e.g., diversifying crop production, expanding income through new markets or agritourism, adding value-added products, finding new markets for marginal or damages crops). Climate change may present new business opportunities as new crops become suitable and some crops become more productive in Vermont (see 6.4). Changing planting or harvest dates are among the most affordable adaptation strategies to cope with changing growing seasons and to potentially avoid exposure to select extreme events (Wolfe et al., 2008). Alternative crop varieties present another lower-cost option, but only when those varieties are available and not significantly more expensive to purchase. Farmers also consider the marketability and desirability of new varieties for the consumer—varieties more similar in size, color, and taste may be more palatable and require less marketing by the farmer to consumers. Agroforestry can be an effective and cost-efficient adaptation strategy to increase farm business revenue by diversifying crop production (e.g., wood fiber, lumber, fruit, nuts, other specialty forest products), either for commercial sale or farm use (Schoeneberger et al., 2017). Agroforestry presents an opportunity to use marginal land, protect waterways, and offer windbreaks that reduce energy usage up to 40% annually (Alvez et al., 2022). Windbreaks can also protect crop fields and livestock directly resulting in increased production and/or decreased input costs that generally exceed the cost of taking some land out of active production (Brandle & Schoeneberger, 2014).
Agritourism may be an effective adaptation strategy for Vermont farms, but it is not immune to climate change impacts (Solsaa, 2024). Vermont agritourism activities include direct-to-consumer sales of local food, agricultural education, hospitality, recreation, and entertainment (Chase et al., 2022). Vermont is a leader in agritourism in New England and the number of farms reporting income from agritourism is steadily increasing (Chase et al., 2022). In 2022, 323 producers reported $4,671,000 in income from agritourism and recreational services. Further, the number of farms participating in agritourism in 2022 increased over 50% compared to 2017 (USDA, 2024). There are ample opportunities for new research and data on the economic impacts of climate change on agritourism activities in Vermont due to its increasing economic importance and role in income diversification as a strategy for climate adaptation.
6.5.2 Food processing and manufacturing
Food manufacturing, Vermont’s second largest manufacturing industry (Fowler et al., 2022), is impacted by climate-induced weather variability and extreme events. Primary impacts of extreme weather on food businesses include uncertainty or unavailability of crop supply, negative impacts on raw material quality, and increased likelihood of foodborne diseases (Geijer, 2024). Reliable data on the impacts of climate change on Vermont’s food processing and distribution industry is lacking, including from major food manufacturers like cheesemakers, breweries, bakeries, food hubs, and others. VAAFM estimated that financial impacts of losses in the 2023 growing season exceeded $24,914,174 for Vermont’s food services, food- and agriculture-related retail, and manufacturing and processing businesses combined (VAAFM, 2023b).
Adaptation for food businesses is specific to the type of enterprise and risk faced in their supply chains and access to markets. Generalizable adaptation strategies across food businesses include diversifying sourcing, seeking closer relationships with producers, more flexible contracts with clients, strategic inventory management to dampen supply shocks, creative substitution of raw materials, and taking advantage of emerging agricultural products (Geijer, 2024).
Box 6-4 Climate change and Vermont’s international supply chains
Climate change is disrupting food supply chains that support Vermont’s producers, processors, and consumers. Even products that do not grow locally, like cacao, are affected (Newton & Ehnstrom, 2025). Shifts in rainfall and temperatures in tropical cacao-producing regions have reduced yields and caused global shortages. Vermont producers that depend on cocoa for value-added products, like chocolate milk and confectionery, have struggled to source supplies and find alternative ingredients. This shortage has forced local businesses to pivot their product offerings and adapt their sourcing strategies to maintain production.
The Vermont Food System Plan identifies climate disruption of local and global supply chains as a key threat to food security in Vermont, noting that supporting on-farm adaptation and resilient local food networks will help buffer against systemic shocks (VSJF, 2021). Strengthening regional processing, diversifying sourcing, and improving transportation resilience are critical to ensuring that Vermont’s food businesses can continue to produce in a rapidly changing climate.
6.5.3 Food distribution, transportation, and retail sales
Climate change can disrupt food transportation, impacting food businesses and consumers. Land, water, and air transportation are all vulnerable to climate change-related shocks, which can impact transit time, reliability, and efficiency, which in turn might affect the cost and availability of goods (McGuirk et al., 2009; see Infrastructure 7.3).
Many of Vermont’s food retail businesses, including grocery stores, restaurants, and farmers’ markets, have been impacted by extreme weather. During and after the 2023 and 2024 extreme flooding events, Vermont’s retail establishments lost inventory and experienced post-flood supply delays due to washed-out roadways (Hamstra, 2023). Other food distributors, including food pantries, lost inventory or were forced to temporarily or permanently relocate (Tanier, 2023). There is notable proximity of major food distribution centers to flood hazard zones across Vermont, including critical areas like Hardwick, Montpelier, and Barre (Figure 6‑10). Food distribution centers include food hubs, independent grocery stores, large grocery stores, and wholesale distributors; while not representative of all food access points in the region this analysis highlights the need to understand how flooding is impacting food access and distribution within the state.
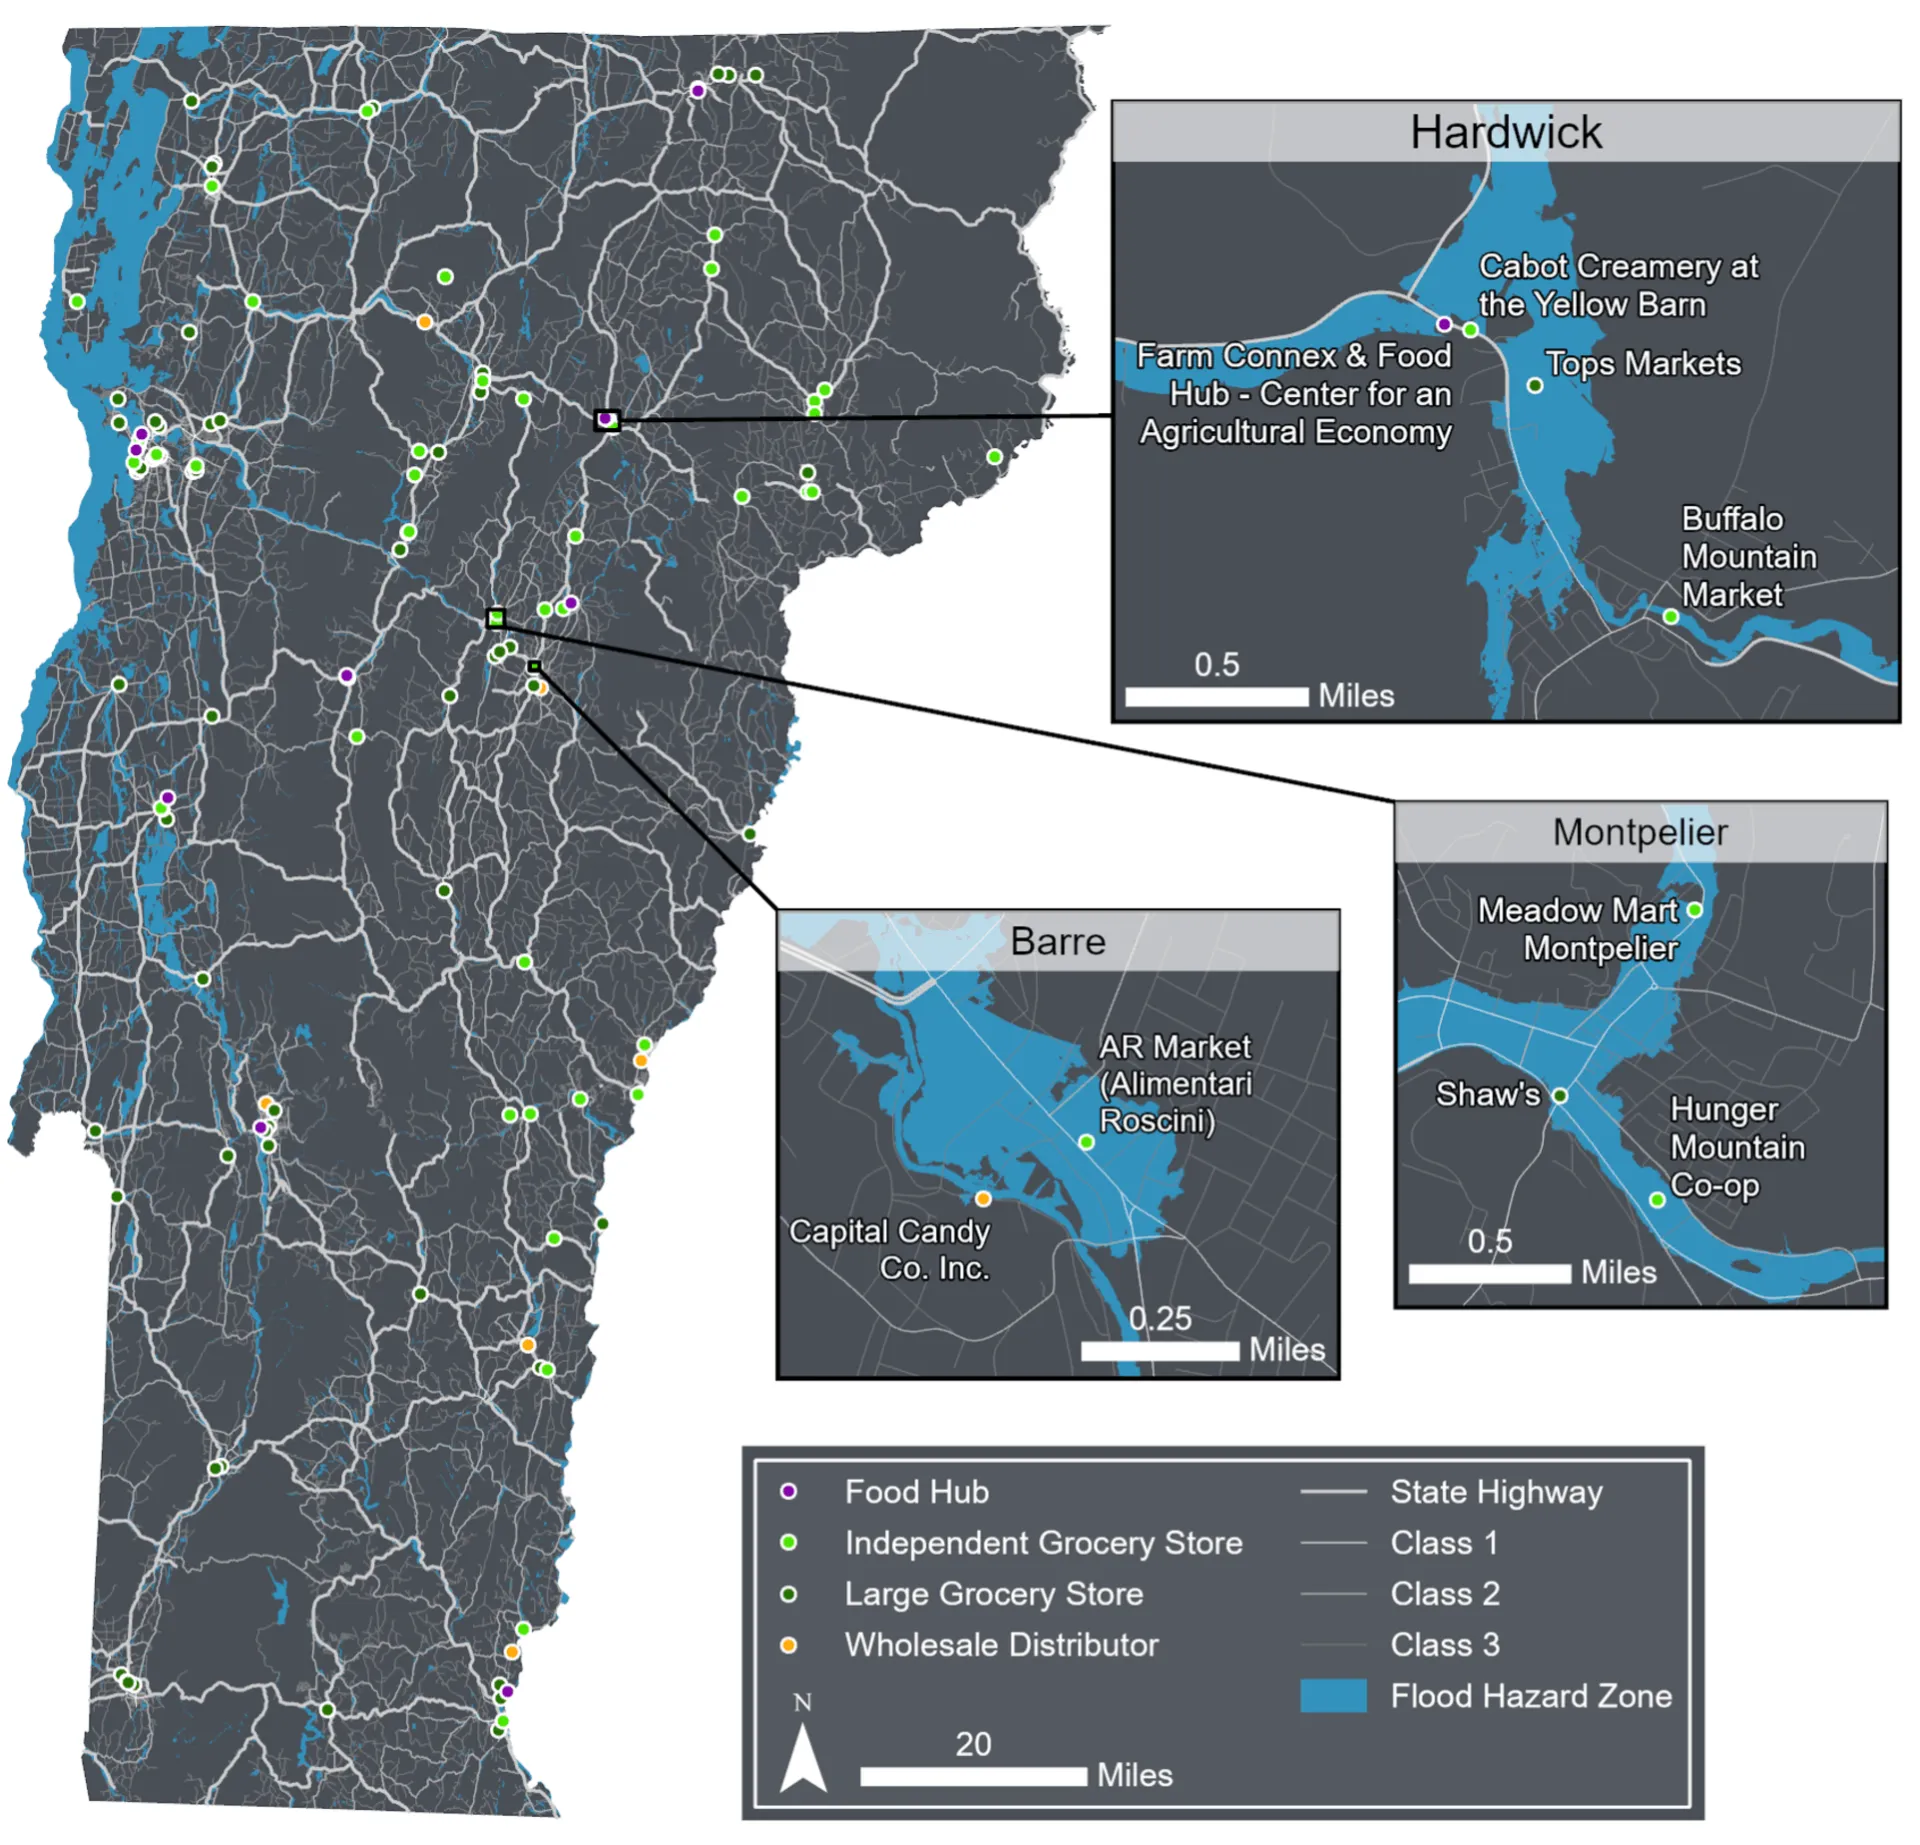
Source: Flood hazard zones (FEMA, 2024; VCGI, 2022); Food distribution centers (Farm Connex, 2025; FoodCoDirectory, 2026; A. McCarthy, 2023; USDA, 2026a; VT Farm to Plate, 2026); State and town highways (Vermont Agency of Transportation, 2021)
Note: Visualization by Hannah C. Turner; Geospatial data on flood hazard zones were a combination of the Vermont Center for Geographic Information (VCGI) floodplain layer and the FEMA National Flood Hazard Layer Where the datasets overlapped, the VCGI flood hazard zone layer superseded the FEMA layer; FEMA flood zone data were retained only in areas not covered by the VCGI layer. Highlighted insets were informed by discussions with distribution partners at the Center for Agricultural Economy’s Farm Connex program
Flood insurance can provide financial relief, but premiums may be too expensive for some businesses and retailers. Businesses owned by migrants or new Americans may face additional challenges accessing resources after disasters like foods due to language barriers (Cain, 2023; see Community Development 11.5.4). Comprehensive data on the impacts of climate change on Vermont’s retail supply chains and charitable food distributors like food banks and pantries is lacking, presenting an opportunity for further research and analysis.
Vermont’s restaurants play a key role in the economy and shape the way Vermonters and visitors alike eat and think about food. Through purchases of locally grown food, restaurants are key contributors to the success of Vermont’s farms. Because restaurants require consistent product quality and supply, crop loss or damage from extreme weather events can cause significant disruption. Strengthening restaurant and farm partnerships is key for the economy and the overall financial sustainability and resilience of rural communities (see Box 6-5).
Climate change impacts compound other systemic challenges and stressors on food suppliers and retailers in Vermont. Consolidation in retail and distribution businesses exacerbates downward price pressure, decreases suppliers’ negotiating power, and creates barriers for new suppliers to enter retail markets (Harlow et al., 2022). Consolidation and acquisition are also happening in independent and rural stores, shifting consumer purchases away from community-owned and -operated stores and decreasing the food income flowing back into Vermont’s communities (Harlow et al., 2022). Economic diversification is a strong climate adaptation strategy that will increase the viability of Vermont’s food retail sector.
Box 6-5 Center for an Agricultural Economy Food Hub
Lylee Rauch-Kacenski, Center for an Agricultural Economy
Agriculture can and must work towards climate resilience at all levels. The Center for an Agricultural Economy (CAE) designed the Food Hub in Hardwick, Vermont with energy efficiency and the environment in mind. As of March of 2025, the 12,500 sq. ft. facility supports the needs of farms, food businesses, and the community with tangible, climate-forward infrastructure. The Hub is home to Farm Connex, CAE’s logistics and transportation service, which moves $13 million of local food annually from farms to markets. The Hub features cooler and freezer storage, allowing local farmers and food businesses an efficient and reliable way to store product off-farm. The Food Hub offers a multi-use community room featuring a full kitchen. The flexible space has been used to make soup for local food pantries, for farmers market gatherings, and to prepare community meals and host meetings and events.
The Food Hub features efficient heating, cooling, and power system. The refrigeration system uses CO2 instead of freon, which does not contribute to greenhouse gas emissions, to power the 5,000 sq. ft. of cooler and freezer space. The scale of refrigeration at the Food Hub allows for heat recapture, taking what would otherwise be waste heat from the refrigeration compressors and turning it into the primary heat source for the facility. The other three climate-conscious investments are heat pump hot water heaters, high efficiency wood pellet boilers, and a 400-panel solar array.
Learn more about the Center for an Agricultural Economy at caevt.org.
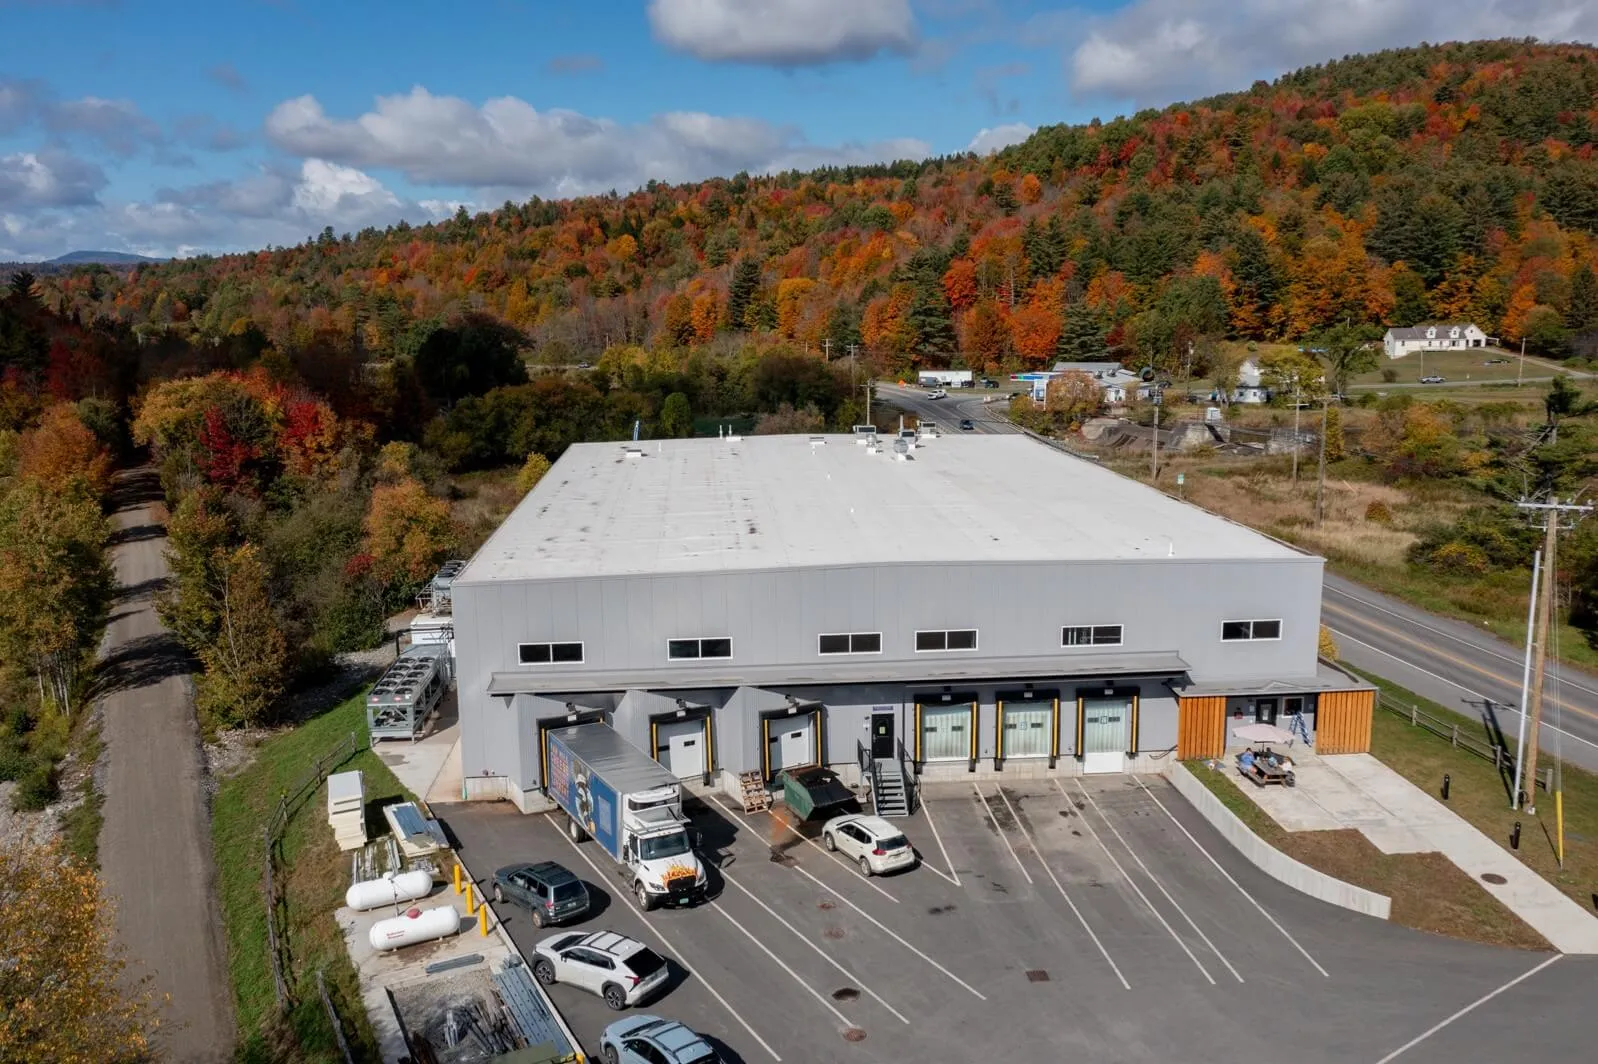
6.6 Social impacts and adaptation strategies
6.6.1 Food safety
Climate change can impact the safety of the food supply chain through multiple pathways, including altering the sources and modes of pathogen transmission as well as pathogen growth and survival in food (Duchenne-Moutien & Neetoo, 2021). Climate change can exacerbate the occurrence of foodborne illnesses by affecting the occurrence and persistence of disease-causing microorganisms, pesticides, fungicides, and other chemicals that can compromise food safety (Duchenne-Moutien & Neetoo, 2021). Climate change increases stress on plants and animals, increasing their susceptibility to pathogens that compromise food safety (Duchenne-Moutien & Neetoo, 2021; Human Health 10.8).
Temperature
Increased temperatures have been linked to the proliferation of bacteria in produce, increased mastitis in cows, and increased salmonella in poultry (Duchenne-Moutien & Neetoo, 2021). The predicted rise in average air temperature will likely increase the heat load on the cold chain (i.e., storage and movement of refrigerated food from harvest to consumption), which could increase food spoilage and poisoning (Duchenne-Moutien & Neetoo, 2021). Pathogens, especially bacteria like E. coli and Listeria, may proliferate on vegetables during high temperatures (Duchenne-Moutien & Neetoo, 2021; Liu et al., 2013). Mycotoxin contamination, originating from fungi that infect crops like corn, grains, feed crops, fruits, and vegetables, may also be exacerbated by high temperatures (Duchenne-Moutien & Neetoo, 2021).
Mastitis, a common disease in dairy cattle, can lead to the transfer of pathogens into milk and subsequently into humans if the milk is not properly pasteurized (Duchenne-Moutien & Neetoo, 2021). Cows treated with antibiotics can transfer antibiotic-resistant pathogens and antibiotic residues into milk, which may increase antibiotic resistance in humans (Duchenne-Moutien & Neetoo, 2021). Dairy cattle may become more susceptible to infection by mastitis-causing bacteria and to thermal stress from climate change, decreasing milk quality and quantity.
Research has shown that salmonella and Campylobacter infections in poultry increase with increasing temperatures (Duchenne-Moutien & Neetoo, 2021). Proper surveillance, monitoring, and disinfection can mitigate pathogen prevalence and prevent bacteria from passing into the food chain. Milder winters and higher temperatures may increase the survivability of animal disease vectors like flies (Duchenne-Moutien & Neetoo, 2021). Microbial infections are predicted to rise with warmer average temperatures, which may increase antimicrobial usage and resistance in both livestock and crops (Duchenne-Moutien & Neetoo, 2021).
Precipitation
Extreme precipitation events can directly and indirectly impact food safety. Produce is more likely to be contaminated with pathogens due to heavy precipitation, flood, and drought (Duchenne-Moutien & Neetoo, 2021). After heavy precipitation, airborne bacteria can increase by more than 25 times in agricultural fields, and splash dispersal can contaminate produce with bacteria from the soil (Cevallos-Cevallos et al., 2012). Increased precipitation affects internalization of E. Coli and salmonella into leafy green vegetables (Ge et al., 2012; Liu et al., 2013), and heavy rainfall increases the risk of splash dispersal of salmonella on tomatoes (Cevallos-Cevallos et al., 2012). During drought, increased irrigation combined with a shortage of available clean water may push farmers to use contaminated irrigation water for crop production, increasing food- and waterborne-disease risk (Duchenne-Moutien & Neetoo, 2021).
Flooding increases the probability of crop contamination with sewage, chemicals, heavy metals, and pathogenic organisms in floodwaters (Duchenne-Moutien & Neetoo, 2021). U.S. Food and Drug Administration regulation requires the safe disposal of crops if the edible portion is exposed to floodwaters, as there is no method of reasonably assuring food safety after floodwater contamination (FDA, 2011). After the July 2023 floods, the UVM Agricultural and Environmental Testing Lab and the University of Maine Soil Test Lab conducted over 190 soil tests covering at least 391 acres of flooded soils to inform replanting decisions by growers (Grubinger, 2024b). Most samples showed no heavy metal contamination; however, some samples showed elevated aluminum, boron, copper, iron, manganese, or zinc levels (Grubinger, 2024b). Soil tests comparing flooded and non-flooded fields showed some flooded fields had E. coli levels above the 10 MPN/g threshold for soil replanting; however, levels of E. coli reduced substantially after 60 days (Grubinger, 2024b).
6.6.2 Food and agriculture worker wellbeing
Food and agricultural workers are uniquely vulnerable to the health impacts of climate change due to their exposure to environmental hazards and intersecting economic and social vulnerabilities (see Human Health Table 10-1). Workers in Vermont’s food system, especially food service workers, are paid some of the lowest wages of any occupational category in the state, and the median hourly wages for many jobs in the food system are below living wage levels (NEFSPP, 2023). Farmworkers, especially undocumented and migrant workers, are particularly vulnerable to the effects of climate change (Tigchelaar et al., 2020). Undocumented and migrant workers have fewer workplace protections due to their legal status, as well as limited access to healthcare, social services, and financial resources to cope with workplace stress and injury (Tigchelaar et al., 2020).
Food and agricultural workers face increased risk due to heat and air pollution exposure outdoors and hot environments indoors (EPA, 2025a; see Human Health Table 10-1). Heat-related stress and death are significantly higher for farmworkers than for other U.S. workers, and the annual number of unsafe working days is expected to double by 2050 (Mitchell et al., 2023). Extreme heat is known to negatively impact human health in a variety of ways (see Human Health 10.3.1). Outdoor workers are also at a higher risk of exposure to tick and insect bites that may carry Lyme disease or West Nile virus (EPA, 2025a; see Human Health 10.6). Increasing agricultural pests and disease pressures due to climate change may increase agricultural use of pesticides and fungicides, which could increase chemical exposures for agricultural workers and nearby communities (EPA, 2025a).
Farmers, farm workers, and other workers in the food chain can experience adverse mental health effects due to the impacts of climate change on their work environment and businesses (EPA, 2025a). These workers face cumulative stress from repeated exposure to environmental hazards (see Human Health 10.9). Farmers’ mental health can have a significant effect on the ability to cope with climate impacts, and farm viability is directly dependent on farmers’ physical and emotional ability to maintain the farm enterprise over time (Bruce et al., 2025).
To adapt to these challenges, farmers, workers, and managers should ensure that employees stay cool and hydrated during the workday, make plans to prevent heat illnesses, train employees to recognize heat hazards, monitor outdoor air quality and take steps to improve indoor air quality, use preventative measures for insect bites, use proper personal protective equipment (PPE), and ensure workers are properly trained when working with pesticides or other agricultural chemicals (EPA, 2025a). Employers should also ensure workers have access to proper mental health services, especially following extreme weather events, climate-related disasters, or workplace injuries (EPA, 2025a; see Human Health 10.9.3).
6.6.3 Food security
Climate change can affect food security by impacting food availability, access, and use (Box 6-6). Disruptions occurring at any point along the supply chain—from food production, transportation, and distribution to food retail and storage—can lead to food insecurity (Figure 6‑11). Food security in Vermont is highly dependent on food supply from outside the state, with local food accounting for only 10.1% of the state’s food expenditures (NEFSPP, 2022). While climate change is highly likely to affect global, regional, and local food security (Brown et al., 2015), climate change thus far has not been a major driver of food insecurity in Vermont. Increasing food insecurity, due to climate change, and resulting changes in consumer behavior, could have significant effects on Vermont’s local food system; however, there is a gap in research and evidence for this relationship.
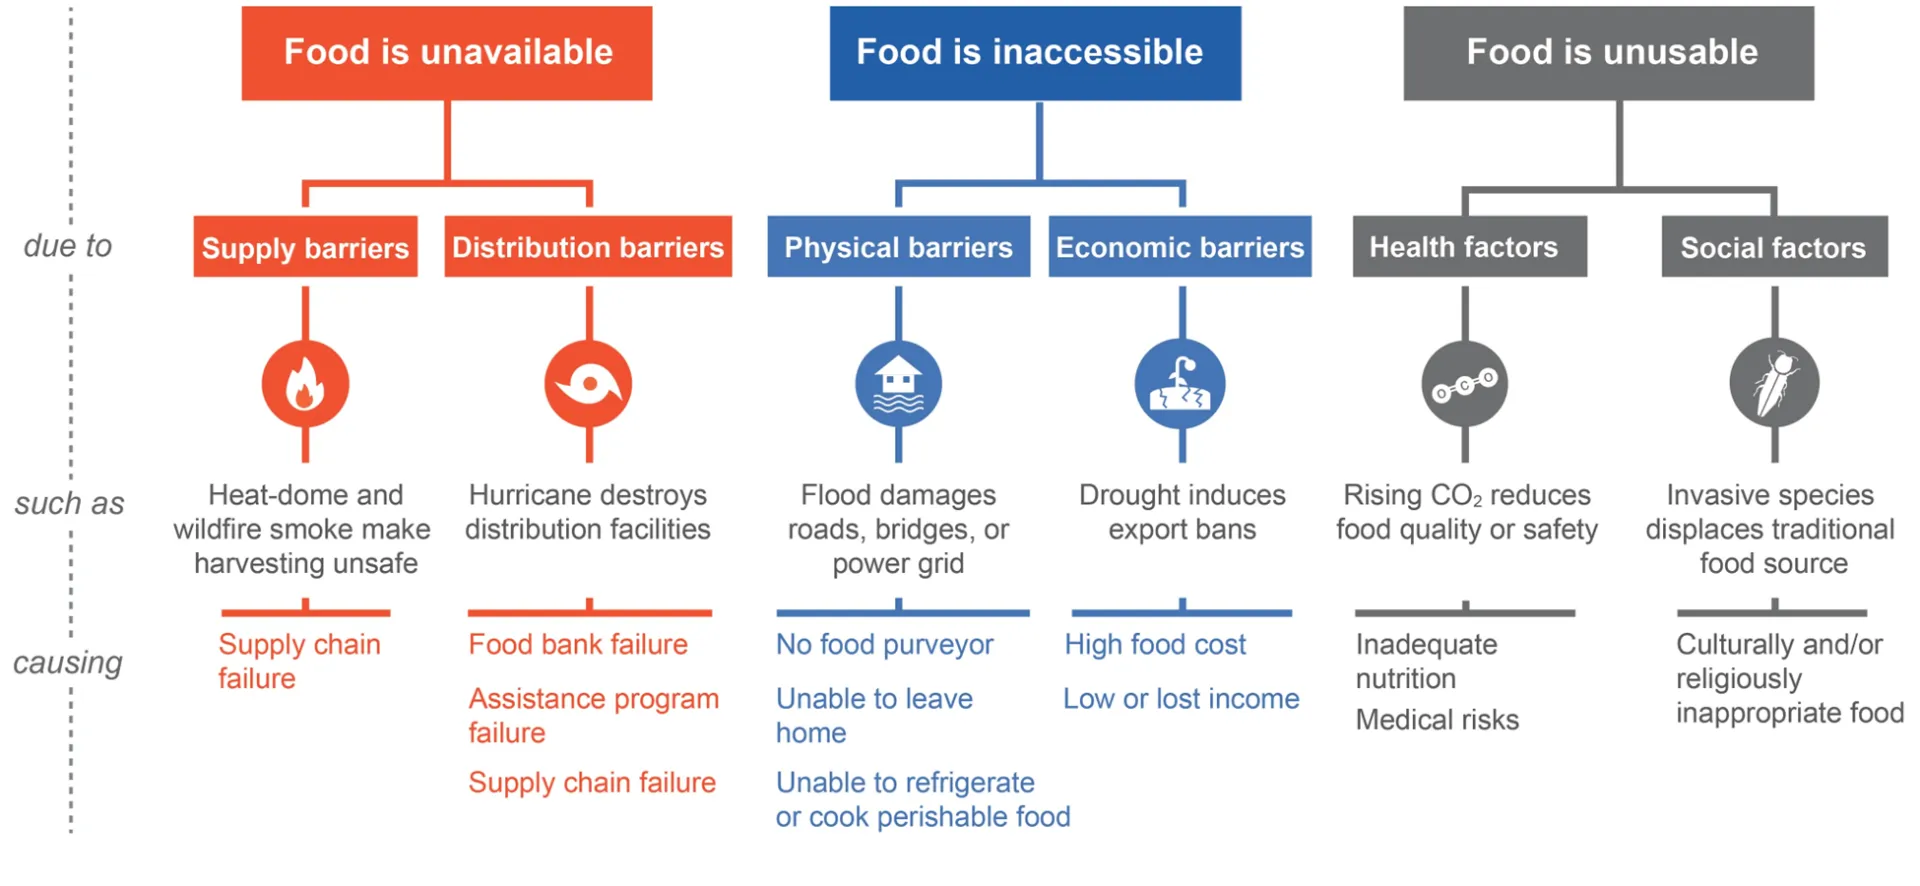
Source: Mitchell et al. (2023)
Climate change-induced food system disruptions may exacerbate food insecurity for already vulnerable groups, including low-income communities, women, children, older adults, racial and ethnic minorities, and new Americans (Mitchell et al., 2023; see Human Health 10.8). A 2022 survey of Vermont residents found 40% experienced food insecurity in the prior 12-month period, and 91% said that rising food prices affected their food purchasing (McCarthy et al., 2022). Indigenous people face unique threats to food security due to climate change (Mitchell et al., 2023), including the loss of access to culturally significant land, food, and seeds, which harms the physical and mental health of Indigenous peoples and communities (Whitehead et al., 2023). Increasing equity and justice in the food system for Indigenous peoples, like all forms of food justice, creates a stronger and more resilient food system for all. Additionally, U.S. farm workers disproportionately experience food insecurity, which can be worsened when extreme events reduce demand for farm labor (Mitchell et al., 2023). Ensuring a living wage for workers, especially essential workers producing Vermont’s food, will contribute to both food security and food justice in the face of climate change. Food security for Vermonters, especially the accessibility and affordability of local food, is important to strengthening Vermont’s food system to ensure a secure, reliable, and resilient food supply during emergencies and disruptions (VSJF, 2024; Box 6-7).
Box 6-6 What is food security and insecurity?
Food security means access to enough food for an active, healthy life by all people at all times. The USDA defines food insecurity as reduced quality, variety, or desirability of diet, and in severe cases includes disrupted eating patterns and reduced food intake. This can look like households who report that they run out of food and do not have money to buy more, cannot afford to eat balanced meals, or cut the size of meals or skip meals due to lack of money for food (Hales et al., 2026).
Box 6-7 Vermont Emergency Eats supports food security during emergencies and disasters
During the July 2023 floods, damage to homes, businesses, and transportation and utility infrastructure made it difficult for Vermonters to access and prepare food. In response, the state launched Vermont Emergency Eats (VEE), an emergency meal distribution program designed to support food security and local economies in the wake of the disaster. VEE paid local restaurants $10 for each free meal provided to the community, strongly encouraged the use of local ingredients, and used a “hub” model to distribute food to affected counties.
- VEE spent $700,000, with over 49,000 meals distributed and used 25% locally sourced ingredients.
- Participating restaurants reported over $703,500 in total flood damages, showing a strong need for support after the flooding.
VEE was an innovative, systems-level approach to improving food security during a crisis. By connecting local restaurants, farms, and food producers, the program significantly improved economic resilience and food security. Thanks to the program’s focus on locally owned restaurants and locally sourced ingredients, it had an economic multiplier effect: independent impact analysis estimated that $1.12 million was re-spent in Vermont’s local economy on supplies and labor.
VEE also played a crucial role in keeping businesses open: 70% of participating restaurants agreed that the program provided the restaurant with a critical revenue source during the months following the floods (Schuster & Klieger, 2023).
6.6.4 Climate and food justice
Climate justice is the recognition that low-income communities, communities of color, and other marginalized people are disproportionately impacted by climate change (UC CCJ, 2026). The Fifth National Climate Assessment reported with high likelihood and confidence that climate-related hazards are disproportionately impacting certain communities in the Northeast U.S., including racial and ethnic minorities, people of lower socioeconomic status, and older adults (Whitehead et al., 2023). Climate justice is an approach to addressing climate change that simultaneously addresses social, racial, and environmental injustices (UC CCJ, 2026). Strategies to strengthen climate resilience are made stronger by the inclusion of diverse perspectives, so that inequities are not perpetuated or exacerbated, and so all members of our communities are included in climate solutions (UC CCJ, 2026).
Climate justice and food justice are inherently intertwined. Food justice states that everyone, regardless of race, gender, income, or location, has the right to access nutritious, affordable, and culturally appropriate food produced in a socially and environmentally sustainable way (Cirillo, 2023). Food justice connects consumers, workers, and producers in the food system through a commitment to access living wages and incomes, healthy environments, and respect for human rights. Climate change can exacerbate food injustices and inequality, challenging the affordability and availability of nutritious and culturally appropriate food, the safety of food workers, and the sustainability of farm livelihoods. Inequities are present in Vermont’s food system, from land access to worker rights, is rooted in the historical marginalization of racial and ethnic groups in the state (Peña et al., 2022). Marginalized groups in Vermont still face challenges accessing farmland, capital, fair wages, food, and safe working conditions as they actively contribute to the vibrancy, diversity, economic impact, and strength of Vermont’s food system (Peña et al., 2022).
6.7 Food system emissions and mitigation
6.7.1 Vermont’s impact on climate change
Vermont’s agricultural sector contributes about 15.6% of the state’s total net greenhouse gas (GHG) emissions (EPA, 2024; VT ANR, 2024). Net GHG emissions from agricultural land use decreased from ~0.7 million metric tons of CO2 equivalent (MMT CO2e) in 1990 to ~0.5 MMT CO2e in 2020. The decrease was largely due to reduction in land used for livestock as opposed to changes in management practices (Galford et al., 2021). The Vermont Carbon Budget quantifies GHG exchange as a) net to the atmosphere (emissions) and b) net to the land (storage or sequestration). The majority of emissions, 0.4 MMT CO2e (about 80%), are from dairy and non-milking cattle enteric emissions (Galford et al., 2021). The remainder of emissions are from manure, cropland (i.e., tillage and residue management), and nutrient management (Galford et al., 2021). These estimates are for agriculture-only emissions and do not include broader food system impacts accounted for in other sectors (e.g., food waste is accounted for in the Waste Sector).
Under Vermont’s Global Warming Solutions Act, the agriculture sector must reduce GHG emissions by 40% below 1990 levels by 2030, and 80% by 2050, assuming sectoral-emissions reductions are proportional to contribution (Vermont Global Warming Solutions Act of 2020, 2020). These reduction targets can be achieved by focusing on emission reductions and carbon sequestration. Perennial hay and haylage sequesters 80% of the carbon stock in agriculture (Galford et al., 2021). This section outlines mitigation opportunities on-farm and within the broader food systems supply chain. Additional details on statewide actions to meet the requirements of the Global Warming Solutions Act are provided in the Vermont Climate Action Plan, the state’s comprehensive climate strategy developed by the Vermont Climate Council (2025), which identifies specific initiatives, programs, and policies to reduce emissions and build climate resilience across all sectors (Box 6-8).
While it continues to be important that farms pursue mitigation opportunities, especially those with co-benefits of improved soil health, climate change resilience, and reduced dependence on external inputs, there are some key caveats to consider:
- Current GHG emissions accounting does not consider forests and trees on agriculture land (e.g., riparian buffers) that may have a considerable impact on estimated sinks (Galford et al., 2021; Vermont Climate Council, 2021a).
- It is estimated that 2% of non-CO2 emission reductions related to livestock and 18% related to croplands are possible without funding (EPA, 2025b), whereas other reductions require considerable investment. Many on-farm actions will be challenging, in some cases impossible, for farmers to pay for on their own.
- The soil carbon sequestration potential of agricultural management practices in Vermont is uncertain and likely influenced by site-specific factors such as soil type, geography, land use history, and climate, as outlined in detail in the Vermont Climate Assessment 2020 (Galford et al., 2021).
- Reducing dairy production will lead to the greatest decrease of GHG emissions in Vermont’s agriculture sector; however, as farming communities are also knowledge communities, there are considerable implications with shifting knowledge, supply chain resources, infrastructure, and markets to alternative agricultural products. It is important to consider how the environmental burden may simply be displaced to other regions if there are not concurrent shifts in diets that reduce dairy and beef consumption.
With these considerations, the following sections summarize Vermont’s current emission mitigation efforts, as well as future mitigation opportunities, many of which may offer co-benefits for farmers and food businesses.
Box 6-8 Collaborative farm-scale planning for adaptation and resilience to climate change
Written by: Evan Horn, Vermont Climate Action Office
Vermont’s 2025 Climate Action Plan (Vermont Climate Council, 2025) recognizes natural and working lands as one of the state’s greatest opportunities to both absorb GHG emissions and adapt to a changing climate. A priority action within the plan is to increase funding for, enhance, and adapt existing Vermont programs that support these dual goals on working lands. To operationalize this, the state is advancing strategies that bridge the gap between high-level policy and farm-level practice.
An example is the “Collaborative Farm-Scale Planning for Adaptation and Resilience to Climate Change” initiative. Led by American Farmland Trust, this initiative has successfully piloted whole-farm resilience planning with a cohort of Vermont farms. These plans help farmers navigate the threats of extreme weather events by identifying site-specific interventions.
The Vermont Climate Action Office, in partnership with VAAFM, is expanding this framework so that farmers can also understand how adaptation practices (e.g., reduced tillage, cover cropping, riparian buffers) can reduce emissions and/or sequester carbon. This highlights the link between soil health and climate mitigation—healthy soils store more carbon.
This holistic approach moves beyond qualitative planning to generate data-driven estimates. These metrics will allow the state to better track progress toward emissions reduction goals, while providing farmers with the information needed to make evidence-based management decisions. This ensures that Vermont’s transition to agriculture practices that mitigate emissions is grounded in science, supporting a working landscape that is both economically viable and ecologically resilient.
6.7.2 On-farm mitigation efforts & practices
Methane (CH4) from enteric fermentation (rumen livestock like cattle, sheep, and goats emit through their digestion process) is the source of 80% of agricultural emissions in Vermont. Current enteric emission mitigation strategies include using feed additives (both rumen modifiers and direct inhibitors), altering genetic selection, using cattle masks, improving feed quality, and adjusting diet formulations (Arndt et al., 2022; Kebreab et al., 2023; Vermont Climate Council, 2025). Studies at Cornell Dairy Research Facility are assessing the effectiveness of different feed additives in climate-controlled respiration chambers (Cornell CALS, 2026), while researchers at UVM are exploring the effectiveness of seaweed additives (WCAX, 2021) as well as how traditional and novel forages in the Northeast U.S. affect animal productivity relative to environmental impact (UVM OVPR, 2026). In addition to effectiveness, viability of these solutions depends on commercial readiness, cost, and impacts to milk production. The feed supplement 3-Nitrooxypropanol (3nop) is effective at reducing enteric methane emissions, has shown no adverse effects, and in some cases even improves animal performance (Kim et al., 2020; van Gastelen et al., 2024). However, it currently costs about $100 per cow per year; it is still very new; and ongoing real-world farm data are shaping its economic viability (Pupo et al., 2025). The Vermont Climate Action Plan suggests the state invest in future research on feed amendments and forage quality to reduce enteric emissions that considers downstream impacts and equity before implementation (Vermont Climate Council, 2021b). The EPA estimated the GHG reduction potential as well as the cost of several livestock-related emission mitigation strategies (Figure 6‑12), showcasing tradeoffs between costs and effectiveness of different strategies, including feed additives.
Manure management is a key contributor to livestock-related GHG emissions. Manure stored in open lagoons generates a significant amount of methane, and farmers and researchers have had some success with additives to manure pits to reduce methane emissions (Cornell, 2025; Head, 2025). Mitigation can be achieved by shifting away from liquid storage to solid storage, bedded packs, anaerobic digestion, or composting (Andrews et al., 2021; UVM Extension, 2024). Over a dozen Vermont farms host anaerobic digesters, which capture and use the biogas from organic waste (typically cow manure) to generate heat and electricity for the farm (Milideo, 2025). More recent research efforts successfully converted manure to propane, requiring a shorter process with reduced environmental impact and greater ease of transport (Thomas, 2025). However, digesters are capital- and labor-intensive and thus not suitable for small farms (Wang et al., 2011). To be financially viable, biogas recovery systems require at least 500 cows (EPA, 2018). Community anaerobic digesters or composting operations using manure from multiple farms could help to overcome scale hurdles but have had variable success (Wang et al., 2021).
Agriculture-related CO2 emissions from croplands primarily stem from nutrient cycling in soils, driven by microbial decomposition and root respiration (Schlesinger & Andrews, 2000). Soils store roughly three times more carbon than the atmosphere (Batjes, 2014), so even small shifts in soil organic carbon globally can meaningfully influence atmospheric CO₂ concentrations (Amelung et al., 2020). Changes in soil carbon stocks reflect the balance between carbon inputs and losses; although management practices can shift this balance. The sequestration potential of agricultural practices in Vermont remains uncertain (Galford et al., 2021).
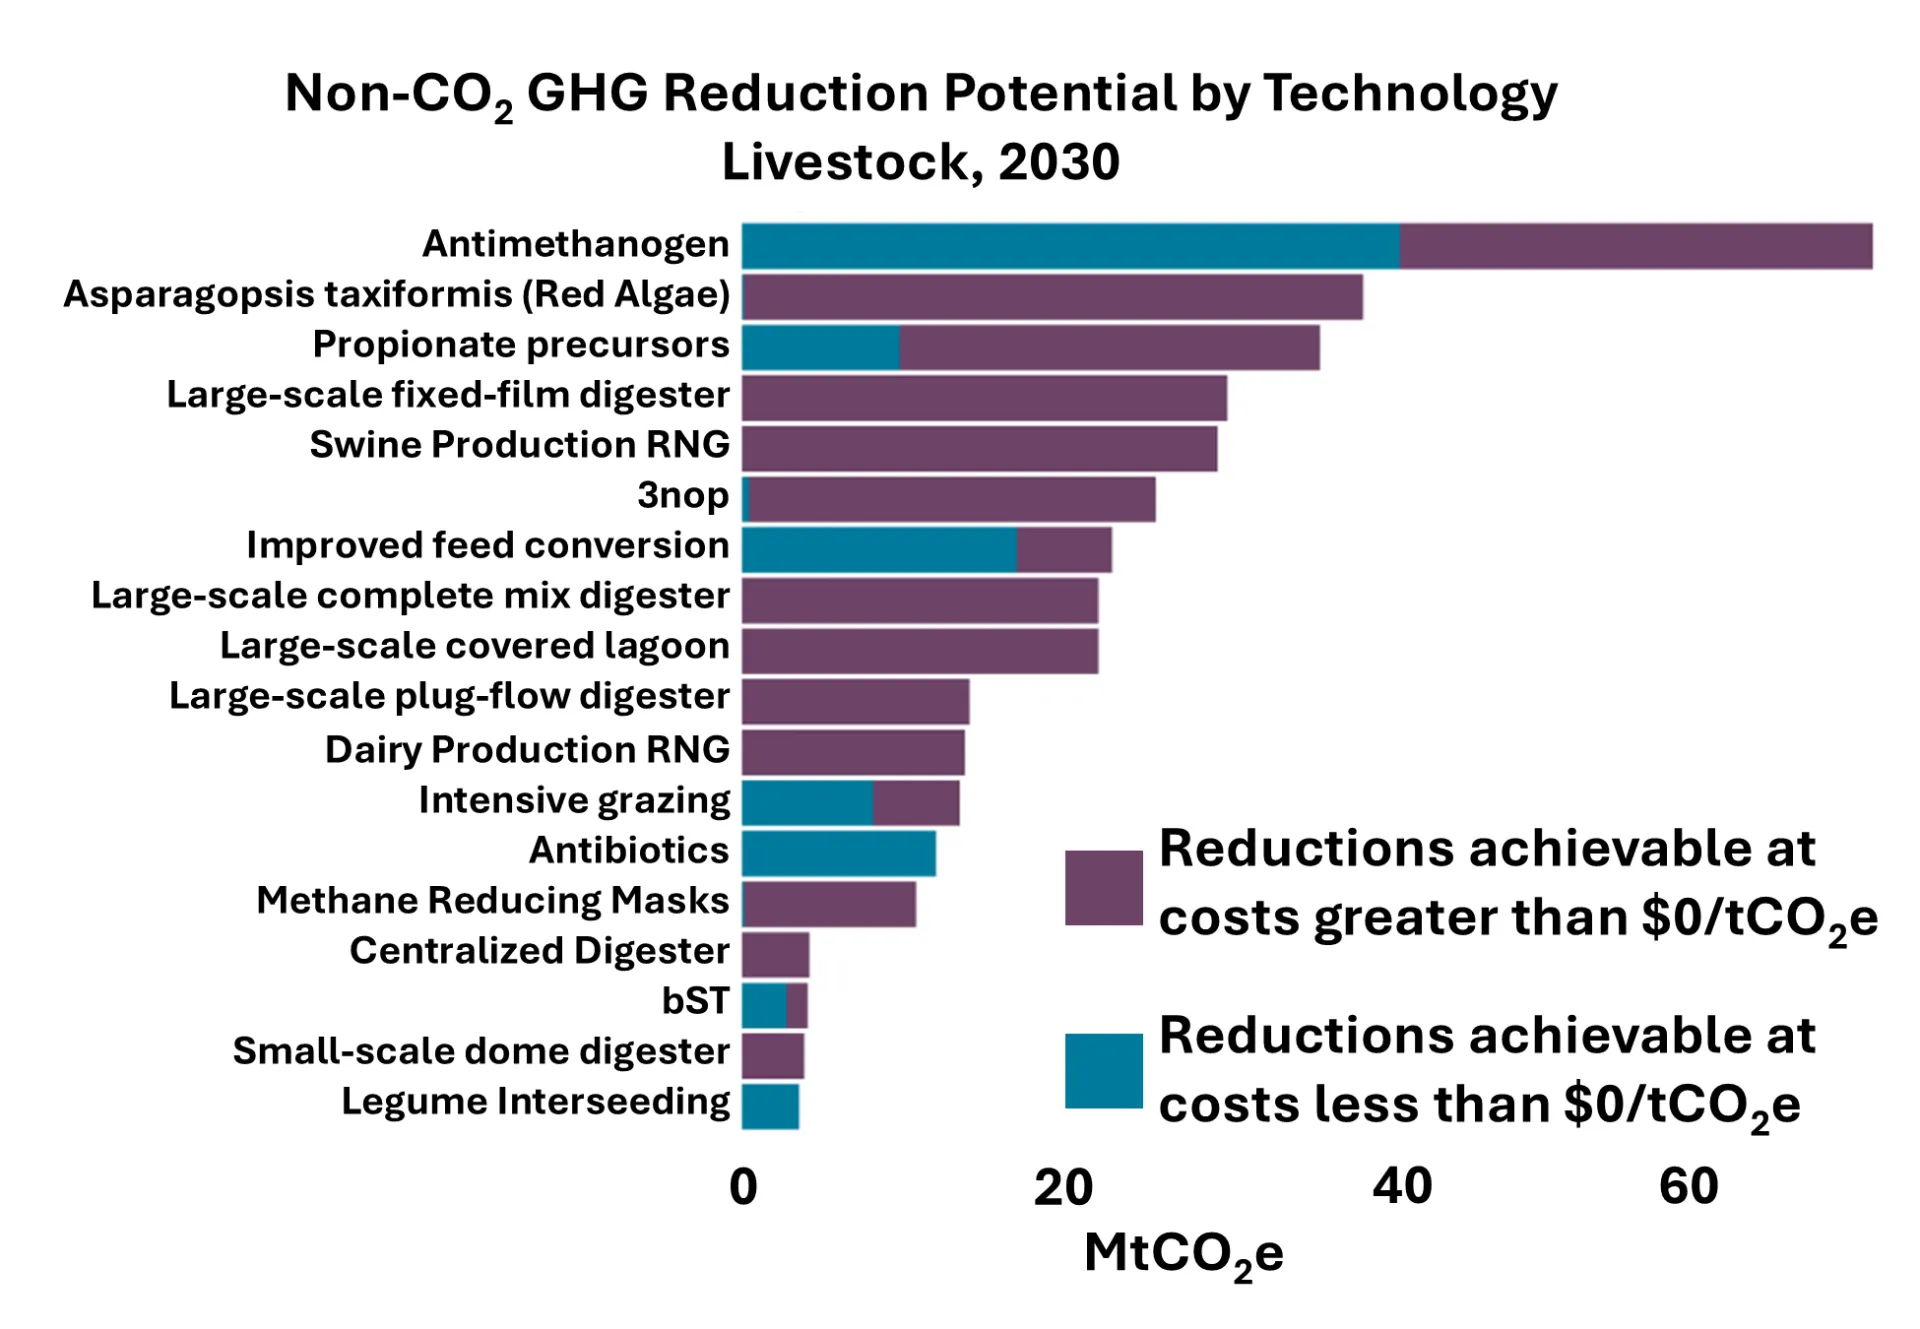
Source: EPA (2025b)
Under anaerobic conditions, methanogenic archaea generate methane (Rizzo et al., 2013), while N2O emissions arise mainly from microbial nitrification, denitrification, and volatilization pathways in soils (Menegat et al., 2022; Willett et al., 2019). Management practices that modify soil microclimate, oxygen availability, or the quantity and quality of substrates available to microbes and plant roots can influence GHG emissions (Adair et al., 2019). For soil and cropland related emission mitigation strategies, the EPA again estimated effectiveness compared to cost (Figure 6‑13), showcasing tradeoffs for strategies like amending soil nutrients (via application of synthetic fertilizers and organic inputs), increasing vegetation cover and biomass, and reducing soil disturbance (Beillouin et al., 2023; Duddigan et al., 2023; Lori et al., 2025; Tamburini et al., 2020).
Manure and fertilizer interact with soil and climate conditions so the method, timing, and rate of manure and fertilizer application strongly influences soil GHG emissions. Liquid manure supplies carbon, moisture, and nitrogen, altering soil microclimate and substrate availability in ways that affect CO₂ and N₂O production. In Vermont, liquid manure is typically applied via broadcasting or injection and sometimes incorporated with a plow (Adair et al., 2019). Surface broadcasting leads to higher ammonia volatilization, while injection and rapid incorporation reduces ammonium losses and associated indirect N₂O emissions (Adair et al., 2019; Sherman et al., 2022). However, injection can increase direct N₂O emissions by creating localized zones of high moisture and nitrogen that favor denitrification (Sherman et al., 2022).
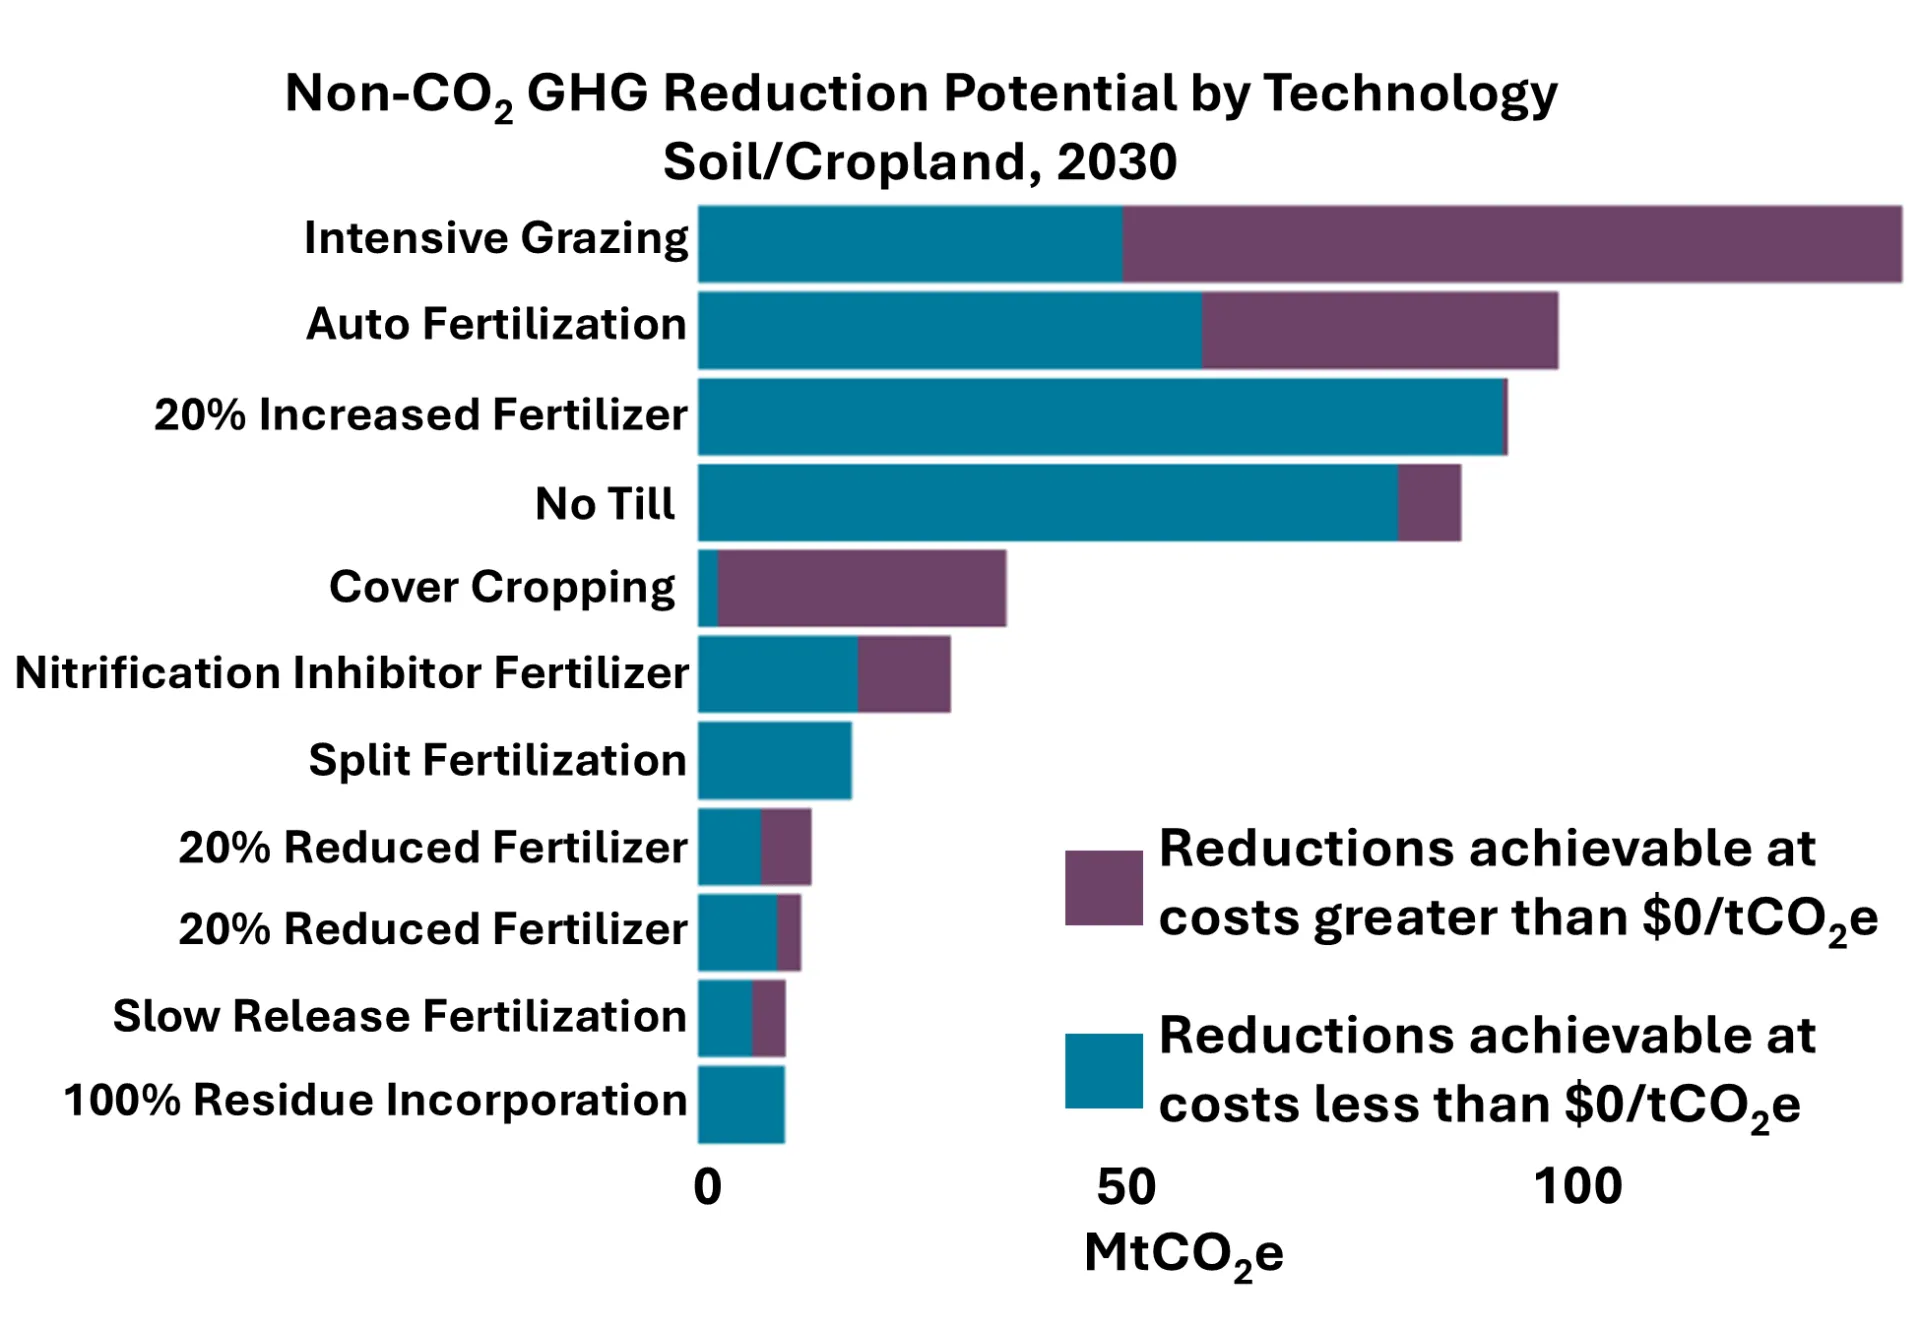
Source: EPA (2025b)
Timing is equally important. Soil moisture and temperature at application and throughout the season often exert a stronger influence on emissions than method alone (Brickman et al., 2024). Applying manure during dry or cool conditions can reduce N₂O fluxes, whereas warm, wet conditions increase fluxes (Brickman et al., 2024). Even topographical differences in a field can show varying emission levels due to moisture content (Ratliff et al., 2026). Manure management decisions can also affect emissions outside the growing season, as freeze–thaw cycles can trigger large GHG pulses depending on in-season nutrient management (Adair et al., 2019). Developing and implementing nutrient management plans that prescribe manure and fertilizer application rates, timing, and methods according to soil tests, crop demand, slope, proximity to waterways, and field hydrology can reduce the risk of nutrient losses to surface and groundwater and limit associated GHG emissions (NRCS, 2021).
Rotational grazing, or management-intensive grazing, is when livestock are moved frequently among smaller paddocks to allow forage recovery and improve pasture function. Contosta et al. (2021) found that management-intensive grazing pastures had up to 11% higher soil carbon concentrations in the top 0–15 cm, but total soil carbon stocks did not differ significantly from hayed fields. Notably, management-intensive grazing was associated with elevated N₂O emissions, which were, on average, 33% higher than in hayed systems in select years, potentially offsetting any climate benefits from soil carbon gains. While potential for changes in soil carbon stock is uncertain, research and on-farm studies in Vermont indicate multiple ecological and production benefits from rotational grazing as compared to continuous grazing. A multi-farm study on dairy pastures found that rotationally grazed systems supported higher soil health outcomes and a greater abundance of beneficial insects (e.g., dung beetles), which contribute to nutrient cycling and soil structure, compared to continuously grazed pastures (UVM CALS, 2024).
On‑farm energy transition opportunities are gaining attention as farmers seek to electrify operations and adopt on‑farm renewable energy systems to reduce GHG emissions and energy costs. In Vermont, programs and incentives have helped farms install solar arrays to offset electrical usage, while solar development continues to expand across the state’s agricultural landscape (DePillis, 2022). Agrivoltaics, or the dual use of land for agriculture and solar renewable energy, are being explored and installed in Vermont, including research on vertical solar arrays that do not compete with crop production (Bruce, 2026). There are some livestock farmers that have built businesses grazing their herds amidst solar arrays to manage plant growth around the arrays, which in turn provide shade for the animals (Burke et al., 2021). Electric farm vehicles and machinery, including smaller electric tractors, are emerging and have the potential to reduce fossil fuel use on farms; high upfront costs and limitations in battery life remain barriers to broader adoption (Matt, 2020). Rural charging access is improving, but infrastructure is limited compared to urban areas. This limitation can slow the uptake of electric equipment in agricultural settings.
To reduce the agricultural sector’s contribution to climate change, there are a variety of opportunities for farmers to mitigate emissions while also potentially improving soil health, increasing yields, reducing input costs, and improving ecosystem health. The right stack of practices is farm-specific and dependent on factors like type of farming system, natural environment, and access to capital. Adaptation opportunities should be explored in co-learning networks and engage farmers as equal partners to make pragmatic shifts that repair the landscape, mitigate climate change impacts, and support farmer well-being.
6.7.3 Food system mitigation options
Beyond the farm, processing, storage, distribution, and retail sectors can reduce energy intensity, transition to low-carbon technologies, and improve system resilience. Upgrading food aggregation and cold storage facilities with heat pumps, thermal storage, and low-global warming potential refrigerants can significantly cut emissions, while improving reliability during periods of extreme heat. Electrifying delivery fleets and improving logistics through shared distribution networks and route consolidation will lower transportation emissions and strengthen continuity of service when weather disrupts movement (see Infrastructure 7.3).
A second major mitigation pathway is reducing food loss and waste. Extreme weather increases the risk of spoilage when storage or transport is disrupted (see 6.5.3). Improved cold-chain management, inventory coordination, and food rescue are all strategies important for both mitigation and adaptation. Composting and anaerobic digestion of food waste reduces CH4 emissions from disposal and keeps nutrients circulating locally. For example, Ben and Jerry’s uses anaerobic digestion for their dairy waste leftover from the pipes in manufacturing and unsellable pints returned to the facility (Kampner, 2025). One study estimates that nationwide implementation of organics recycling could reduce the climate impact of U.S. food waste management by 86–100% (Porterfield & Roy, 2026).
Consumer choices play a critical role in shaping Vermont’s food system and associated GHG emissions. Education and improved access to lower-emission foods can empower consumers to support supply chains that prioritize sustainability. Shifting consumption toward plant-based proteins is particularly impactful, as GHG emissions from animal-based foods are estimated to be roughly twice those of plant-based alternatives (Willett et al., 2019; Xu et al., 2021). However, dietary recommendations should be responsive to local cultures, locally available foods, and specific individual health needs (see Human Health 10.8). By investing in both education of, and access to, lower-emission foods, Vermont can encourage food purchasing decisions that meaningfully reduce emissions and support local producers.
6.8 Food system resilience and transformation
Food systems face many stressors and shocks, from economic crises and pandemics to climate change. Resilience has become a touchstone term among food systems’ scholars and actors; it broadly means the ability of our food system to provide sufficient and appropriate food while responding to and recovering from various disturbances (Serrano-Cortés et al., 2023). In September 2025, the state released the Resilience Implementation Strategy, which identified priority actions and policies to protect communities, help those hit by disasters, and strengthen Vermont’s infrastructure, economy, and natural environment (Wright et al., 2025). Strengthening the resiliency and security of Vermont’s food system includes building and reenforcing support systems for farmers to maintain long-term viability of working lands, establishing long-term funds for regional food system infrastructure, building an emergency response team to coordinate agriculture recovery, and addressing farmworker housing and safety in disaster response protocols (Wright et al., 2025).
Locally led adaptation is a powerful tool to increase community resilience in Vermont, as it shifts power to local stakeholders and thus results in more effective interventions (Harris & Nelson, 2024). Local initiatives supported with public funding have shown significant success in enhancing resilience (D’Amico, 2025). One example, funded through NOFA-Vermont, is the Northeast Kingdom Farmer-to-Farmer Adaption Planning Cohort, which brings farmers together to collaboratively build practical, farm-specific climate adaptation plans and includes $5,000 in funding to jumpstart projects (Haggerty, 2026). Vermont food hubs also play a key role in locally led support for communities in emergent crises, like the COVID-19 pandemic and the 2023 and 2024 floods. The hubs are directly connected with farmers, food businesses, schools, and community members.
Community efforts to learn from disasters and improve response systems are key to resilience. After the 2023 and 2024 floods, community organizers, mutual aid groups, and flood survivors documented which response efforts were most effective in supporting their communities, and they prepared an online toolkit to guide community-led resilience strategies (Hirschfeld, 2025). The toolkit recommends establishing deeper connections with local food producers and distributors and strengthening community food infrastructure (Community Resilience Organizations, 2026). These locally led efforts demonstrate that investing in community knowledge, regional food infrastructure, and farmer-to-farmer networks can strengthen Vermont’s adaptive capacity and ensure that the food system is better prepared for future shocks.
Many existing systems constrain the changes needed for a more resilient food system. Food system transformation recognizes that social, cultural, political, and economic barriers shape people’s ability to make empowered choices and community-minded decisions in the face of climate change. For example, farmers who lack basic support, such as health insurance and childcare, may struggle to invest in climate change adaptation despite rising risks. In Vermont, 27% of farmers rely on individual health insurance, and many farm households carry medical debt or lack confidence in covering major illness (Becot & Inwood, 2022; Cox & Claxton, 2025). Latino and H-2A farmworkers face heightened vulnerability, as most are ineligible for public insurance and encounter significant barriers to affordable coverage (Wills et al., 2022). Increasing access to healthcare and childcare would improve farmer and farmworker well-being and livelihoods, thereby transforming their ability to be resilient to climate changes (Unangst-Rufenacht et al., 2022; Wills et al., 2022). By reducing structural barriers and strengthening essential social support, Vermont can enable farmers and farmworkers to participate more fully in climate adaptation, while also advancing a more equitable and resilient food system.
Frameworks for food system transformation, and agroecology in particular, have gained popularity as a social movement through grassroots organizations applying key principles and via UVM’s Institute for Agroecology (Box 6-9). Agroecology is not only a science, but also a set of practices and a social movement emphasizing the interconnectedness of the environmental, social, and economic sustainability of food systems. Agroecology is commonly defined through a set of key principles: recycling; input reduction; soil health; animal health; biodiversity; synergy; economic diversification; co-creation of knowledge; social values and diets; fairness; connectivity; land and natural resource governance; and participation (Agroecology Europe, 2026; Wezel et al., 2020). These practices and principles are aligned with many climate change adaptation and mitigation strategies, and social movements propose agroecology as the path toward resilience for communities in the face of climate change (Mitchell et al., 2023; Rosset et al., 2019).
Across Vermont, land-use planning is increasingly shaped by the implications of climate change for the future of agriculture and food systems. Increasing extreme weather events, especially flooding, are actively transforming the agricultural landscape, increasing the difficulty of deciding where to conserve, develop, or farm. Vermont’s “30x30” conservation goals under Act 59 seek to conserve ecologically important lands, while explicitly recognizing the role of working farms and forests in sustaining rural economies and food production (Community Resilience and Biodiversity Protection Act, 2023). The New England Feeding New England framework emphasizes protecting agricultural land and strengthening food system infrastructure to support climate-resilient, regional food supply chains (NEFSPP, 2023). At the same time, the Vermont Agency of Commerce and Community Development has established regional housing targets that will shape where and how communities grow, with implications for farmland conversion, labor availability, and rural viability (VAPDA, 2025). These planning efforts also contend with expanding FEMA 100-year flood risk zones, which increasingly affect prime agricultural soils, farm infrastructure, and food system facilities (FEMA, 2024). Together, these intersecting land-use and climate-adaptation priorities present an opportunity for food system transformation through integrated, place-based planning that supports agricultural viability under changing climate conditions.
Food systems transformation efforts have the potential to cause harm if not implemented in a fair and inclusive way. Local and global initiatives have explored the Just Transitions framework (Kojo-Agyemang Bonsu et al., 2025) to ensure decarbonization and climate change resilient efforts are equitable and just. The term “just transition” was popularized in the 1970s by U.S. trade unions whose livelihoods were affected by new water and air pollution regulations (Atteridge & Strambo, 2020). A collaboration between the Center of Agricultural Economy, Northeast Kingdom Organizing, Rural Vermont, and the Institute for Agroecology used the Just Transitions framework to engage community members who may be most affected by a new local food hub and to inform decision-making around the hub (UVM IFA, 2025; Box 6-9). The Just Transition framework shifts away from systems based on extractive dynamics and toward regeneration and mutual thriving (UVM IFA, 2025).
Vermonters are engaged in implementing climate change adaptation, mitigation, and resilience strategies within the broader food system. Agriculture is omnipresent in Vermont’s culture and landscape, driving an immense amount of research, collaboration, and organizing from neighborhoods to state-wide initiatives to ensure Vermonters will be food secure and farms remain viable in future climate change.
Box 6-9 Agroecology in action in Vermont
Written by: Mollie Willis, Rural Vermont
The People’s Agroecology School of Vermont, hosted by Rural Vermont, applies work brigades as a tool to meet local farming community needs, strengthen mutual aid networks, and foster learning between farmers and community members. Work brigades show that cooperative effort lies at the heart of agroecological transition, using shared labor to bridge divides and strengthen trust. The brigade model draws on the experiences and generosity of Organizacion Boricua (Puerto Rico) and the Southeastern African American Farmers Organic Network, organizations that have long used brigade methodology for community resistance, mutual aid, and disaster relief.
Work brigades center labor as a crucial element of land stewardship and, through shared work, open opportunity for dialogue, political education, and camaraderie. Farmers identify projects in advance, and Rural Vermont organizers provide tools and recruit volunteer labor to complete resilience-focused tasks such as planting riparian buffers, repairing hoophouses, restoring sugar shacks, or managing silvopasture. After the work, participants share a meal and discuss topics drawn from the host farm’s experiences (e.g., land access, climate change, pollinator health) and relate to greater political themes (e.g., systemic racism in the food system, globalization, neoliberalism, industrial food systems). Political education is an integral part of the brigades and helps to further break down differences between participants and highlight the root causes of issues that divide us.
By mobilizing people outside of capital frameworks, work brigades emphasize direct, local knowledge and community action. Work brigades unite neighbors, friends, family, comrades, and allies by combining hands-on action with social connection and cultural exchange. At the same time, brigades represent sophisticated pedagogical expressions of movement-building, as people learn to work with one another, build relationships, and strengthen understanding while advancing food sovereignty.
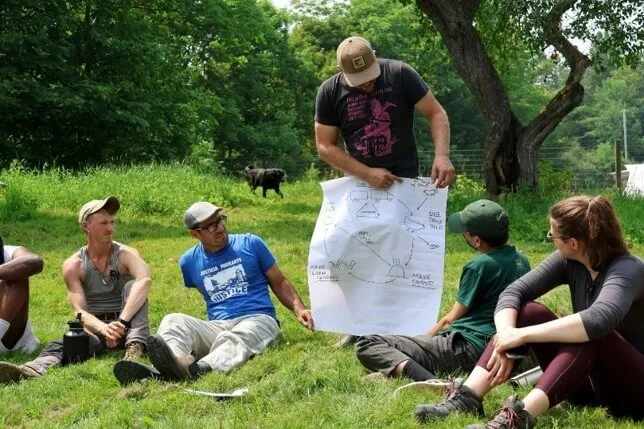
6.10 References
Adair, E. C., Barbieri, L., Schiavone, K., & Darby, H. M. (2019). Manure Application Decisions Impact Nitrous Oxide and Carbon Dioxide Emissions during Non‐Growing Season Thaws. Soil Science Society of America Journal, 83(1), 163–172. https://doi.org/10.2136/sssaj2018.07.0248
Adger, W. N., Brown, K., Nelson, D. R., Berkes, F., Eakin, H., Folke, C., Galvin, K., Gunderson, L., Goulden, M., O’Brien, K., Ruitenbeek, J., & Tompkins, E. L. (2011). Resilience implications of policy responses to climate change. WIREs Climate Change, 2(5), 757–766. https://doi.org/10.1002/wcc.133
Agroecology Europe. (2026). The 13 principles of Agroecology. Agroecology Europe. https://www.agroecology-europe.org/the-13-principles-of-agroecology/
Ahmed, S., Lutz, D., Rapp, J., Huish, R., Dufour, B., Brunelle, A., Morelli, T. L., Stinson, K., & Warne, T. (2023). Climate change and maple syrup: Producer observations, perceptions, knowledge, and adaptation strategies. Frontiers in Forests and Global Change, 6. https://doi.org/10.3389/ffgc.2023.1092218
Alaba, O. A., Bechami, S., Chen, Y.-Y., Gara, T. W., Perkins, B., & Zhang, Y.-J. (2024). Will global warming reduce the nutritional quality of wild blueberries? Climate Change Ecology, 8, 100088. https://doi.org/10.1016/j.ecochg.2024.100088
Albacete, S., Sancho, G., Azpiazu, C., Rodrigo, A., Molowny‐Horas, R., Sgolastra, F., & Bosch, J. (2023). Bees exposed to climate change are more sensitive to pesticides. Global Change Biology, 29(22), 6248–6260. https://doi.org/10.1111/gcb.16928
Aleem, S., Sharif, I., Amin, E., Tahir, M., Parveen, N., Aslam, R., Najeebullah, M., & Shahid, M. T. H. (2020). Heat tolerance in vegetables in the current genomic era: An overview. Plant Growth Regulation, 92(3), 497–516. https://doi.org/10.1007/s10725-020-00658-5
Alger, S. A., Miller, M. S., Burnham, P. A., & Munkres, A. (2026). Vermont 2024-2025 Colony Loss Report. Vermont Bee Lab. https://s3.amazonaws.com/ClubExpressClubFiles/703671/documents/VT_2024-25_colony_loss_report_1858514701.pdf?AWSAccessKeyId=AKIA…
Alves, J., Machado, M. R., & Friedrich, E. (2024). Vermont Ripsower Survey. UVM Extension. https://www.uvm.edu/d10-files/documents/2024-10/ripsower-survey-03a.pdf
Alvez, J., Giroux, M., DePillis, A., Unangst-Rufenacht, G., & Herrick, C. (2022). Vermont Food System Plan Issue Brief: Agroforestry. https://www.vtfarmtoplate.com/sites/default/files/2022-03/vermont_food_system_plan_product_brief_agroforestry.pdf
Amelung, W., Bossio, D., De Vries, W., Kögel-Knabner, I., Lehmann, J., Amundson, R., Bol, R., Collins, C., Lal, R., Leifeld, J., Minasny, B., Pan, G., Paustian, K., Rumpel, C., Sanderman, J., Van Groenigen, J. W., Mooney, S., Van Wesemael, B., Wander, M., & Chabbi, A. (2020). Towards a global-scale soil climate mitigation strategy. Nature Communications, 11(1). https://doi.org/10.1038/s41467-020-18887-7
American Farmland Trust. (2025). Climate Adaptation Resources for Farmers for Agriculture in the Northeast. Climate Adaptation Resources for Farmers. https://www.uvm.edu/climatefarming/
Andrews, T., Jeffrey, C. E., Gilker, R. E., Neher, D. A., & Barlow, J. W. (2021). Design and implementation of a survey quantifying winter housing and bedding types used on Vermont organic dairy farms. Journal of Dairy Science, 104(7), 8326–8337. https://doi.org/10.3168/jds.2020-19832
Arndt, C., Hristov, A. N., Price, W. J., McClelland, S. C., Pelaez, A. M., Cueva, S. F., Oh, J., Dijkstra, J., Bannink, A., Bayat, A. R., Crompton, L. A., Eugène, M. A., Enahoro, D., Kebreab, E., Kreuzer, M., McGee, M., Martin, C., Newbold, C. J., Reynolds, C. K., … Yu, Z. (2022). Full adoption of the most effective strategies to mitigate methane emissions by ruminants can help meet the 1.5 °C target by 2030 but not 2050. Proceedings of the National Academy of Sciences, 119(20), e2111294119. https://doi.org/10.1073/pnas.2111294119
Atteridge, A., & Strambo, C. (2020). Seven principles to realize a just transition to a low-carbon economy. Stockholm Environment Institute. https://www.sei.org/wp-content/uploads/2020/06/seven-principles-for-a-just-transition.pdf
Batjes, N. H. (2014). Total carbon and nitrogen in the soils of the world. European Journal of Soil Science, 65(1), 10–21. https://doi.org/10.1111/ejss.12114_2
Becot, F. A., & Inwood, S. M. (2022). Medical economic vulnerability: A next step in expanding the farm resilience scholarship. Agriculture and Human Values, 39(3), 1097–1116. https://doi.org/10.1007/s10460-022-10307-4
Beillouin, D., Corbeels, M., Demenois, J., Berre, D., Boyer, A., Fallot, A., Feder, F., & Cardinael, R. (2023). A global meta-analysis of soil organic carbon in the Anthropocene. Nature Communications, 14(1). https://doi.org/10.1038/s41467-023-39338-z
Bendorf, J., Atucha, A., Guedot, C., Holland, L., Parker, S., Nowatzke, L., & Todey, D. (2025). Climate Change Impacts on Tree Fruits and Viticulture in the Midwestern Region. United States Department of Agriculture Climate Hubs and the University of WisconsinMadison Division of Extension. https://www.climatehubs.usda.gov/sites/default/files/Climate%20Change%20Impacts%20on%20Tree%20Fruits%20%26%20Viticulture%20in%2…
Bishop, D. A., Beier, C. M., Pederson, N., Lawrence, G. B., Stella, J. C., & Sullivan, T. J. (2015). Regional growth decline of sugar maple (Acer saccharum) and its potential causes. Ecosphere, 6(10), art179. https://doi.org/10.1890/ES15-00260.1
Boakye, E. A., Bergeron, Y., Drobyshev, I., Beekharry, A., Voyer, D., Achim, A., Huang, J.-G., Grondin, P., Bédard, S., Havreljuk, F., Gennaretti, F., & Girardin, M. P. (2023). Recent decline in sugar maple (Acer saccharum Marsh.) growth extends to the northern parts of its distribution range in eastern Canada. Forest Ecology and Management, 545, 121304. https://doi.org/10.1016/j.foreco.2023.121304
Bosworth, S., Carter, J., Darby, H., & Hudson, D. (2023). Managing Flood Damaged Crops and Forage. UVM Extension. https://www.uvm.edu/d10-files/documents/2024-08/Managing_Flood_Damaged_Crops_and_Forage_Updated_July_2023.pdf
Bradshaw, T. (2024). Groundcover Management in Vermont Apple Orchards. UVM Extension. https://www.uvm.edu/d10-files/documents/2024-06/Groundcover-Management.pdf
Brandle, J., & Schoeneberger, M. (2014). Working trees: Supporting agriculture and healthy landscapes. Journal of Tropical Forest Science, 26(3), 305–308.
Brantly, S. (2013). Mitigating Heat Stress in Cattle (Working Trees Info). USDA National Agroforestry Center. https://www.fs.usda.gov/nac/assets/documents/workingtrees/infosheets/HeatStressCattleInfoSheetMay2013.pdf
Brickman, S., Darby, H., Ruhl, L., & Adair, E. C. (2024). Nitrous oxide emissions are driven by environmental conditions rather than nitrogen application methods in a perennial hayfield. Journal of Environmental Quality, 53(2), 133–146. https://doi.org/10.1002/jeq2.20536
Brown, M. E., Antle, J. M., Backlund, P., Carr, E. R., Easterling, W. E., Walsh, M. K., Ammann, C., Attavanich, W., Barrett, C. B., Bellemare, M. F., Dancheck, V., Funk, C., Grace, K., Ingram, J. S. I., Jiang, H., Maletta, H., Mata, T., Murray, A., Ngugi, M., … Tebaldi, C. (2015). Climate Change, Global Food Security, and the U.S. Food System (p. 146). U.S. Global Change Research Program. https://doi.org/10.7930/J0862DC7
Bruce, A., Neidecker, E., Zheng, L., Leslie, I. S., & Wilhelm, A. (2025). “A farm is viable if it can keep its head above water”: Defining and measuring farm viability for small and mid-sized farms. Agriculture and Human Values, 42(2), 625–641. https://doi.org/10.1007/s10460-024-10687-9
Bruce, P. (2026). Agrivoltaics at the University of Vermont. https://site.uvm.edu/agrivoltaics/
Burke, M., DePillis, A., Hagen, K., Hurley, S., & Mazurowski, J. (2021). A Guide to Solar Energy in Vermont’s Working Landscape 7. UVM Gund Institute for Environment. https://farmandenergyinitiative.org/wp-content/uploads/2021/05/solar_energy_vt_working_landscape.pdf
Butterbach-Bahl, K., Baggs, E. M., Dannenmann, M., Kiese, R., & Zechmeister-Boltenstern, S. (2013). Nitrous oxide emissions from soils: How well do we understand the processes and their controls? Philosophical Transactions of the Royal Society B: Biological Sciences, 368(1621), 20130122. https://doi.org/10.1098/rstb.2013.0122
Button, L., & Elle, E. (2014). Wild bumble bees reduce pollination deficits in a crop mostly visited by managed honey bees. Agriculture, Ecosystems & Environment, 197, 255–263. https://doi.org/10.1016/j.agee.2014.08.004
CAE. (2026). Vermont Farm Fund: Emergency Loan. The Center for an Agricultural Economy. https://www.vtfarmfund.org/emergency-loan
Cain, J. (2023, August 7). How Vermont Restaurants Are Rebuilding After July Floods | Eater. Eater. https://www.eater.com/23822763/vermont-restaurant-flooding-recovery-climate-change
Cannella, M. (2013). Risk Management Strategies in Use on Vermont Farms (No. FBBR004). University of Vermont Extension. https://www.uvm.edu/d10-files/documents/2024-10/FBRR-004-Risk-Strategies.pdf
Carrico, J. (2024). Heat Wave Changes Cattle Water Needs. Progressive Farmer. https://www.dtnpf.com/agriculture/web/ag/livestock/article/2024/07/30/low-water-intake-can-cause-health
Cavanaugh, B., Kempner, M., & Luce, Z. (2024, July). Reflecting on Two Years of Historic Flooding. NOFA-VT. https://www.nofavt.org/about/blog/reflecting-two-years-historic-flooding
Cevallos-Cevallos, J. M., Gu, G., Danyluk, M. D., Dufault, N. S., & van Bruggen, A. H. C. (2012). Salmonella can reach tomato fruits on plants exposed to aerosols formed by rain. International Journal of Food Microbiology, 158(2), 140–146. https://doi.org/10.1016/j.ijfoodmicro.2012.07.009
Charbonneau, J. (2025). Honey Bees Learn to Fight Deadly Varroa Mites. Civil Eats. https://civileats.com/2025/06/11/honey-bees-learn-to-fight-deadly-varroa-mites/
Chase, L., Ballard, K., Kennett, B., Matthews, A., Pelham, H., DeFilippi, S., Pereira, T., & Simon-Nobes, V. (2022). Vermont Food System Issue Brief: Agritourism.
Chen, L., Thorup, V. M., Kudahl, A. B., & Østergaard, S. (2024). Effects of heat stress on feed intake, milk yield, milk composition, and feed efficiency in dairy cows: A meta-analysis. Journal of Dairy Science, 107(5), 3207–3218. https://doi.org/10.3168/jds.2023-24059
Cirillo, J. (2023, January 24). Supporting Climate & Food Justice. Vermont FEED. https://vtfeed.org/news/supporting-climate-food-justice
Collier, R. J., Hall, L. W., Rungruang, S., & Zimbelman, R. B. (2012). Quantifying Heat Stress and Its Impact on Metabolism and Performance. University of Arizona. https://fever.geisslercorp.com/wp-content/uploads/2022/02/Quantifying_Heat_Stress_and_Its_Impact_on_Metaboli-2.pdf
Community Resilience and Biodiversity Protection Act, Act 59 (2023). https://legislature.vermont.gov/Documents/2024/Docs/ACTS/ACT059/ACT059%20As%20Enacted.pdf
Community Resilience Organizations. (2026). Resilience Hub Toolkit. https://www.resiliencetoolkit.org/
Contosta, A. R., Arndt, K. A., Campbell, E. E., Stuart Grandy, A., Perry, A., & Varner, R. K. (2021). Management intensive grazing on New England dairy farms enhances soil nitrogen stocks and elevates soil nitrous oxide emissions without increasing soil carbon. Agriculture, Ecosystems & Environment, 317, 107471. https://doi.org/10.1016/j.agee.2021.107471
Cornell. (2025). 2025: Rapid Screening of Manure Storage Additives to Reduce Emissions and Enhance Fertilizer Benefits (Multi-NGO). Cornell Atkinson Center for Sustainability. Innovation for Impact Fund. https://www.atkinson.cornell.edu/award/rapid-screening-of-manure-storage-additives-to-reduce-emissions-and-enhance-fertilizer-b…
Cornell CALS. (2026). Enteric Methane Mitigation. Cornell College of Agriculture and Life Sciences. https://cals.cornell.edu/about/our-values-impact/roadmap-2050/transdisciplinary-moonshots/livestock-innovations-for-sustainabil…
Cox, C., & Claxton, G. (2025, September 25). Occupations with Large Shares of Workers Who Rely on Individual Market Coverage. KFF. https://www.kff.org/affordable-care-act/occupations-with-large-shares-of-workers-who-rely-on-individual-market-coverage/
Cox-Foster, D., & DeGrandi-Hoffman, G. (2020). Bolstering Bees in a Changing Climate. USDA Agriculture Research Service. https://scientificdiscoveries.ars.usda.gov/tellus/stories/articles/bolstering-bees-changing-climate
Cyr, A. (2026, April 30). Seasonal shift adds whiff that signals start of spring. The Charlotte News. https://www.charlottenewsvt.org/2026/04/30/seasonal-shift-adds-whiff-that-signals-start-of-spring/
Daly, C., & Rounsaville, T. (2025). Changes in the 2023 U.S. Department of Agriculture Plant Hardiness Map (Oregon Climate Assessment, pp. 21–27). Oregon Climate Change Research Institute. https://prism.oregonstate.edu/pubs/link/2025_daly-rounsaville_occri-osu-pub.pdf
Daly, C., Widrlechner, M. P., Halbleib, M. D., Smith, J. I., & Gibson, W. P. (2012). Development of a New USDA Plant Hardiness Zone Map for the United States. Journal of Applied Meteorology and Climatology, 51(2), 242–264. https://doi.org/10.1175/2010JAMC2536.1
D’Amico, E. (2025). Resilient by design: Isolating impactful climate adaptation measures in New England. Npj Climate Action, 4(1), 80. https://doi.org/10.1038/s44168-025-00275-w
Dang, H. L., Li, E., Nuberg, I., & Bruwer, J. (2019). Factors influencing the adaptation of farmers in response to climate change: A review. Climate and Development, 11(9), 765–774. https://doi.org/10.1080/17565529.2018.1562866
Darby, H. (2023, September). Managing Flooded Corn Silage at Harvest. University of Vermont Extension. https://www.uvm.edu/extension/news/managing-flooded-corn-silage-harvest
Darby, H., & Bosworth, S. (2024). Managing Immature and Frosted Corn Silage. University of Vermont Extension. https://www.uvm.edu/d10-files/documents/2024-06/managing-immature-corn-silage.pdf
Darby, H., Cummings, E., Krezinski, I., & Loria, K. (2024). Northeast Dry Bean Production Guide. UVM Extension. https://www.uvm.edu/d10-files/documents/2025-04/Northeast-Dry-Bean-Production-Guide-Final-Dec2024.pdf
DEC. (2026). 2025 Vermont Clean Water Initiative Performance Report. Vermont Agency of Natural Resources Department of Environmental Conservation. https://dec.vermont.gov/water-investment/clean-water-initiative/reports
DeJong-Hughes, J., & Daigh, A. (2022). Upper Midwest Soil Compaction Guide. University of Minnesota Extension. https://hdl.handle.net/11299/263301
DePillis, A. (2022). Solar Energy on a Dairy Farm. Vermont Farm to Plate. https://www.vtfarmtoplate.com/stories/solar-energy-dairy-farm
Duchenne-Moutien, R. A., & Neetoo, H. (2021). Climate Change and Emerging Food Safety Issues: A Review. Journal of Food Protection, 84(11), 1884–1897. https://doi.org/10.4315/JFP-21-141
Duchesne, L., & Houle, D. (2014). Interannual and spatial variability of maple syrup yield as related to climatic factors. PeerJ, 2, e428. https://doi.org/10.7717/peerj.428
Duddigan, S., Shaw, L. J., Sizmur, T., Gogu, D., Hussain, Z., Jirra, K., Kaliki, H., Sanka, R., Sohail, M., Soma, R., Thallam, V., Vattikuti, H., & Collins, C. D. (2023). Natural farming improves crop yield in SE India when compared to conventional or organic systems by enhancing soil quality. Agronomy for Sustainable Development, 43(2), 31. https://doi.org/10.1007/s13593-023-00884-x
Dupigny-Giroux, L.-A., Mecray, E., Lemcke-Stampone, M., Hodgkins, G. A., Lentz, E. E., Mills, K. E., Lane, E. D., Miller, R., Hollinger, D., Solecki, W. D., Wellenius, G. A., Sheffield, P. E., MacDonald, A. B., & Caldwell, C. (2018). Chapter 18: Northeast. Impacts, Risks, and Adaptation in the United States: The Fourth National Climate Assessment, Volume II. U.S. Global Change Research Program. https://doi.org/10.7930/NCA4.2018.CH18
EPA. (2018). Market Opportunities for Biogas Recovery Systems at U.S. Livestock Facilities (EPA-430-R-18-006). U.S. Environmental Protection Agency, EPA. https://www.epa.gov/sites/default/files/2018-06/documents/epa430r18006agstarmarketreport2018.pdf
EPA. (2024). Inventory of U.S. Greenhouse Gas Emissions and SInks: 1990 -2022 (Nos. 430-R-24–004). U.S. Environmental Protection Agency, EPA. https://www.epa.gov/ghgemissions/inventory-us-greenhouse-gas-emissions-andsinks-1990-2022
EPA. (2025a, April 22). Climate Change and the Health of Workers. U.S. Environmental Protection Agency. https://web.archive.org/web/20250422165841/https://www.epa.gov/climateimpacts/climate-change-and-health-workers
EPA. (2026). Ground-level Ozone Basics. US Environmental Protection Agency. https://www.epa.gov/ground-level-ozone-pollution/ground-level-ozone-basics#effects
EPA, O. (2025b, January 16). Global Non-CO2 Greenhouse Gas Emission Projections & Mitigation Potential: 2020-2080[Reports and Assessments]. U.S. Environmental Protection Agency. https://www.epa.gov/global-mitigation-non-co2-greenhouse-gases/global-non-co2-greenhouse-gas-emission-projections-0
Fairfax, M. (2025, June 29). The surprising shifts climate change is bringing to Vermont farms: Rice paddies, peaches and saffron. VTDigger. https://vtdigger.org/2025/06/29/the-surprising-shifts-climate-change-is-bringing-to-vermont-farms-rice-paddies-peaches-and-saff…
Farm Connex. (2025, November). Farm Connex Stops. https://hardwickagriculture.org/sites/default/files/documents/FarmConnexSTOPS_WEB.pdf
Farm Security Special Fund, S.60, Vermont General Assembly (2026). https://legislature.vermont.gov/bill/status/2026/S.60
Faulkner, J., White, A., & DePillis, A. (2022). Vermont Food System Plan Issue Brief: Climate Change. https://www.vtfarmtoplate.com/sites/default/files/2022-03/vermont_food_system_plan_issue_brief_climate_change.pdf
FCIC. (2024). MICRO FARM PILOT PROVISIONS (Nos. 25-MF-WFRP). USDA Federal Crop Insurance Corporation. https://www.rma.usda.gov/policy-procedure/general-policies/micro-farm-pilot-provisions-25-mf-wfrp
FCIC. (2025). Whole-Farm Revenue Protection Policy (Nos. 26-0076 WFRP – Pilot). USDA Federal Crop Insurance Corporation. https://www.rma.usda.gov/sites/default/files/2025-08/whole-farm-revenue-protection-pilot-policy-26-0076.pdf
FDA. (2011). Guidance for Industry: Evaluating the Safety of Flood-affected Food Crops for Human Consumption [Guidance Document]. U.S. Food and Drug Administration. https://www.fda.gov/regulatory-information/search-fda-guidance-documents/guidance-industry-evaluating-safety-flood-affected-foo…
FDA. (2024). Crops Harvested from Flooded Fields Intended for Animal Food: Questions and Answers. FDA Center for Veterinary Medicine. https://www.fda.gov/animal-veterinary/resources-you/crops-harvested-flooded-fields-intended-animal-food-questions-and-answers
FEMA. (2024, January 22). Flood Maps. U.S. Department of Homeland Security FEMA. https://www.fema.gov/flood-maps
Filteau, M. (2025). Will climate change affect the quality of maple syrup? Heliyon, 11(12), e43489. https://doi.org/10.1016/j.heliyon.2025.e43489
Fleury, A. (2022, July 18). How climate change has impacted blueberry seasons at Willow Farm in Milton nearly three decades after planting the bushes. Milton Independent. https://www.miltonindependent.com/news/how-climate-change-has-impacted-blueberry-seasons-at-willow-farm-in-milton-nearly-three-…
FoodCoDirectory. (2026). List of Wholesale Food Distributors in Vermont. http://www.foodcodirectory.com/2020/09/wholesale-food-distributors-in-vermont.html
Fowler, H., Sigrist, E., Keeney, D., Warner, N., Masseria, L., Harlow, A., & Crosby, K. (2022). Vermont Food System Plan Issue Brief: Specialty Foods. https://www.vtfarmtoplate.com/sites/default/files/2022-03/vermont_food_system_plan_product_brief_specialty_foods.pdf
Freitas, M. S., Misztal, I., Bohmanova, J., & West, J. (2006). Utility of on- and off-farm weather records for studies in genetics of heat tolerance. Livestock Science, 105(1–3), 223–228. https://doi.org/https://doi.org/10.1016/j.livsci.2006.06.011
Gaffney, A. (2025, May). Persistent Drought Strains Livestock Farmers In Vermont. The Associated Press. https://apnews.com/article/general-news-agriculture-droughts-weather-vermont-09348c58b4e6f6fe62eb044804a6aadf
Galford, G., Darby, H., Hall, F., & Kosiba, A. (2021). A Carbon Budget for Vermont: Task 2 in Support of the Development of Vermont’s Climate Action Plan. VT Angency of Natural Resources. https://outside.vermont.gov/agency/anr/climatecouncil/Shared%20Documents/Carbon%20Budget%20for%20Vermont%20Sept%202021.pdf?_gl=…
Galford, G., Faulkner, J., Dupigny-Giroux, L.-A., Posner, S., & Edling, L. (Eds.). (2021). The Vermont Climate Assessment 2020. Gund Institute of Environment. https://site.uvm.edu/vtclimateassessment/files/2022/08/VCA-entire-8-3-22-web.pdf
Ge, C., Lee, C., & Lee, J. (2012). The impact of extreme weather events on Salmonella internalization in lettuce and green onion. Food Research International, 45(2), 1118–1122. https://doi.org/10.1016/j.foodres.2011.06.054
Geijer, T. (2024). Climate change adaptation pressure heats up for food and agriculture companies. ING THINK. https://think.ing.com/articles/climate-change-forces-food-agri-companies-to-adapt/
Ghane, E. (2025). Agricultural Drainage. Michigan State University Extension. https://www.canr.msu.edu/field_crops/uploads/files/E3370%20AgriculturalDrainage_Rev51.pdf
Giacobino, A., Steinhauer, N., Brunner, S., Garcia-Anderson, N., Aurell, D., Bruckner, S., Rogers, S., & Williams, G. (2025). Preliminary Results from the 2024-2025 US Beekeeping Survey: Honey Bee Colony Loss and Management. Apiary Inspectors of America. https://apiaryinspectors.org/US-beekeeping-survey-24-25
Gonzalez-Rivas, P. A., Chauhan, S. S., Ha, M., Fegan, N., Dunshea, F. R., & Warner, R. D. (2020). Effects of heat stress on animal physiology, metabolism, and meat quality: A review. Meat Science, 162, 108025. https://doi.org/10.1016/j.meatsci.2019.108025
Grubinger, V. (2010). SOIL COMPACTION ON VEGETABLE FARMS. UVM Extension. https://www.uvm.edu/vtvegandberry/factsheets/Soil_Compaction_on_Vegetable_Farms.pdf
Grubinger, V. (2011). Climate Change and Vermont Agriculture. UVM Extension. https://www.uvm.edu/vtvegandberry/factsheets/climatechange.html
Grubinger, V. (2014). Growing Berries in Vermont. Small Fruit Master Gardeners. https://www.uvm.edu/vtvegandberry/Pubs/SmallFruitMasterGardeners.pdf
Grubinger, V. (2021). Winter Rye: A Reliable Cover Crop. UVM Extension. https://www.uvm.edu/vtvegandberry/factsheets/winterrye.html
Grubinger, V. (2023). Summary of 2023 VVBGA Grower Survey. Vermont Vegetable and Berry Growers. https://vvbga.org/sites/default/files/inline-files/Summary_2023_VVBGA_Grower_Survey.pdf
Grubinger, V. (2024a). Census of Agriculture Captures Changes in Vermont Agriculture. UVM Extension. https://www.uvm.edu/extension/news/census-agriculture-captures-changes-vermont-agriculture
Grubinger, V. (2024b). Soil Testing on Farms and Gardens after Flooding. UVM Extension. https://www.uvm.edu/d10-files/documents/2024-08/SoilTestingAfterFlooding.pdf
Grubinger, V. (2024c, February 25). Impact of, and Response to, Flooding of Vermont Farms in 2023. The University of Vermont Extension.
Gullino, M. L., Pugliese, M., Gilardi, G., & Garibaldi, A. (2018). Effect of increased CO2 and temperature on plant diseases: A critical appraisal of results obtained in studies carried out under controlled environment facilities. Journal of Plant Pathology, 100(3), 371–389. https://doi.org/10.1007/s42161-018-0125-8
Gunn, K. M., Holly, M. A., Veith, T. L., Buda, A. R., Prasad, R., Rotz, C. A., Soder, K. J., & Stoner, A. M. K. (2019). Projected heat stress challenges and abatement opportunities for U.S. milk production. PLOS ONE, 14(3), e0214665. https://doi.org/10.1371/journal.pone.0214665
Haggerty, K. (2026). Facing Climate Change Together in the Northeast Kingdom. Northeast Organic Farming Association of Vermont. https://www.nofavt.org/about/blog/facing-climate-change-together-northeast-kingdom
Hales, L. J., Reed-Jones, M., & Suttles, S. (2026, February 1). Food Security in the U.S. - Definitions of Food Security. USDA Economic Research Service. https://www.ers.usda.gov/topics/food-nutrition-assistance/food-security-in-the-us/definitions-of-food-security
Hamstra, M. (2023, July 13). Flooding Impacts Food Companies in Vermont. Specialty Food News. Specialty Food Association. https://www.specialtyfood.com/news-media/news-features/specialty-food-news/flooding-impacts-food-companies-in-vermont/
Hardy, S., Hallworth, M. T., Ferguson, M., Sharp, N., Loomis, J., Anderson, E., & McFarland, K. (2022). The State of Vermont’s Wild Bees 2022. Vermont Center for Ecostudies-Vermont Atlas of Life.https://doi.org/https://doi.org/10.5281/zenodo.7261315
Hardy, S., Veit, M., Milam, J., Ascher, J. S., Sharp, N., Hallworth, M. T., Ferguson, M., Richardson, L., Nicholson, C., Ricketts, T. H., Gibbs, J., & McFarland, K. P. (2025). An Annotated Checklist of the Bees (Hymenoptera: Apoidea) of Vermont with Conservation Status and Natural History Notes. Northeastern Naturalist, 32(m27), 1–73. (189426007). https://doi.org/10.1656/045.032.m2701
Harlow, A., Wilson, R., Hamilton, J., Melvin, D., Greenan, P., Rozyne, M., & Gordon, J. (2022). Vermont Food System Plan Issue Brief: Grocers. https://www.vtfarmtoplate.com/sites/default/files/2022-03/vermont_food_system_plan_market_brief_grocers.pdf
Harris, J., & Nelson, L. (2024). Food Systems Resilience Planning and the Climate Crisis: Defining Concepts and Terminology. Vermont Law and Graduate School Center for Agriculture & Food Systems. https://www.vermontlaw.edu/wp-content/uploads/2024/07/food-systems-resilience-planning-and-the-climate-crisis.pdf
Harris, K., Campbell, E., Kempner, M., Folsom, J., & Gordon, C. (2021). Vermont Food System Plan Issue Brief: Agriculture and Food Policy. Vermont Farm to Plate. https://www.vtfarmtoplate.com/sites/default/files/2022-03/vermont_food_system_plan_issue_brief_agriculture_and_food_policy.pdf
Hayhoe, K., Wuebbles, D. J., Easterling, D. R., Fahey, D. W., Doherty, S., Kossin, J. P., Sweet, W. V., Vose, R. S., & Whner, M. F. (2018). Chapter 2: Our Changing Climate. Impacts, Risks, and Adaptation in the United States: The Fourth National Climate Assessment, Volume II. (U.S. Global Change Research Program). https://repository.library.noaa.gov/view/noaa/19487
Hazard, R. (2022, June 2). Colorado Potato Beetle: Vegetable : Center for Agriculture, Food, and the Environment (CAFE) at UMass Amherst. https://www.umass.edu/agriculture-food-environment/vegetable/fact-sheets/colorado-potato-beetle
Hazelrigg, A. (2023, August). Tomato Troubles. University of Vermont Extension. https://www.uvm.edu/extension/news/tomato-troubles
Hazelrigg, A., & Maia, G. (2024). Brassica diseases (Fact Sheets). UVM Plant Diagnostic Clinic. https://www.uvm.edu/extension/plant-diagnostic-clinic
Head, H. (2025, April 17). Shelburne Farms hopes ‘biochar’ eases methane emissions. The Charlotte News. https://www.charlottenewsvt.org/2025/04/17/shelburne-farms-hopes-biochar-eases-methane-emissions/
Heeb, L., Jenner, E., & Cock, M. J. W. (2019). Climate-smart pest management: Building resilience of farms and landscapes to changing pest threats. Journal of Pest Science, 92(3), 951–969. https://doi.org/10.1007/s10340-019-01083-y
Hinrichs, C. (1998). Sideline and Lifeline: The Cultural Economy of Maple Syrup Production. Rural Sociology, 63(4), 507–532.
Hirschfeld, P. (2025, December 26). New online “toolkit” offers Vermonters a how-to for disaster recovery [Broadcast]. In Vermont Public. https://www.vermontpublic.org/local-news/2025-12-26/online-disaster-recovery-toolkit
Houle, D., & Duchesne, L. (2020). The “sweet spot” for maple syrup production proposed by Rapp et al. (2019) is not that sweet. Forest Ecology and Management, 458, 117662. https://doi.org/10.1016/j.foreco.2019.117662
Houle, D., Paquette, A., Côté, B., Logan, T., Power, H., Charron, I., & Duchesne, L. (2015). Impacts of Climate Change on the Timing of the Production Season of Maple Syrup in Eastern Canada. PLOS ONE, 10(12), e0144844. https://doi.org/10.1371/journal.pone.0144844
Hristov, A. N., Degaetano, A. T., Rotz, C. A., Hoberg, E., Skinner, R. H., Felix, T., Li, H., Patterson, P. H., Roth, G., Hall, M., Ott, T. L., Baumgard, L. H., Staniar, W., Hulet, R. M., Dell, C. J., Brito, A. F., & Hollinger, D. Y. (2018). Climate change effects on livestock in the Northeast US and strategies for adaptation. Climatic Change, 146(1–2), 33–45. https://doi.org/10.1007/s10584-017-2023-z
Jabro, J. D., Allen, B. L., Rand, T., Dangi, S. R., & Campbell, J. W. (2021). Effect of Previous Crop Roots on Soil Compaction in 2 Yr Rotations under a No-Tillage System. Land, 10(2), 202. https://doi.org/10.3390/land10020202
Jad, C. (2024, July 18). Vermont organizations take on post-flood fundraising, again. VTDigger. https://vtdigger.org/2024/07/18/vermont-organizations-take-on-post-flood-fundraising-again/
Jordan, E. R. (2003). Effects of Heat Stress on Reproduction. Journal of Dairy Science, 86, E104–E114. https://doi.org/10.3168/jds.S0022-0302(03)74043-0
Joy, A., Dunshea, F. R., Leury, B. J., Clarke, I. J., DiGiacomo, K., & Chauhan, S. S. (2020). Resilience of Small Ruminants to Climate Change and Increased Environmental Temperature: A Review. Animals : An Open Access Journal from MDPI, 10(5), 867. https://doi.org/10.3390/ani10050867
Kabeshita, L., Sloat, L. L., Fischer, E. V., Kampf, S., Magzamen, S., Schultz, C., Wilkins, M. J., Kinnebrew, E., & Mueller, N. D. (2023). Pathways framework identifies wildfire impacts on agriculture. Nature Food, 4(8), 664–672. https://doi.org/10.1038/s43016-023-00803-z
Kammerer, M., Goslee, S. C., Douglas, M. R., Tooker, J. F., & Grozinger, C. M. (2021). Wild bees as winners and losers: Relative impacts of landscape composition, quality, and climate. Global Change Biology, 27(6), 1250–1265. https://doi.org/10.1111/gcb.15485
Kampner, K. (2025, August 13). How ice cream could sweeten sustainability in Vermont energy, farms and water. UVM Community News Service. https://vtcommunitynews.org/2025/08/13/how-ice-cream-could-sweeten-sustainability-in-vermont-energy-farms-and-water/
Kebreab, E., Bannink, A., Pressman, E. M., Walker, N., Karagiannis, A., Van Gastelen, S., & Dijkstra, J. (2023). A meta-analysis of effects of 3-nitrooxypropanol on methane production, yield, and intensity in dairy cattle. Journal of Dairy Science, 106(2), 927–936. https://doi.org/10.3168/jds.2022-22211
Kelley, S. (2023). Rice can help NYS farms profit from climate-change flooding. Cornell Chronicle. https://news.cornell.edu/stories/2023/12/rice-can-help-nys-farms-profit-climate-change-flooding
Kim, H., Lee, H. G., Baek, Y.-C., Lee, S., & Seo, J. (2020). The effects of dietary supplementation with 3-nitrooxypropanol on enteric methane emissions, rumen fermentation, and production performance in ruminants: A meta-analysis. Journal of Animal Science and Technology, 62(1), 31–42. https://doi.org/10.5187/jast.2020.62.1.31
Klaiber, L. B., Kramer, S. R., & Young, E. O. (2020). Impacts of Tile Drainage on Phosphorus Losses from Edge-of-Field Plots in the Lake Champlain Basin of New York. Water, 12(2), 328. https://doi.org/10.3390/w12020328
Knight, L. G., & Hodgson, S. (2018, May). Economics of Gully Erosion and Stabilization. UVM Extension and USDA Northeast Climate Hub. https://www.uvm.edu/d10-files/documents/2024-10/fcc_gully_erosion_last_resort_final_web_tagged.pdf
Kojo-Agyemang Bonsu, W., Lata, K., & Adhiasto, A. (2025). Guidelines and policy frameworks for just transition of the workforce and the creation of decent work and quality jobs. United Nations Framework Convention on Climate Change, the Kyoto Protocol and the Paris Agreement. https://unfccc.int/sites/default/files/resource/JT%20Compilation%20Guidelines.pdf
Kral-O’Brien, K. C., O’Brien, P. L., & Harmon, J. P. (2019). Need for False Spring Research in the Northern Great Plains, USA. Agricultural & Environmental Letters. https://acsess.onlinelibrary.wiley.com/doi/10.2134/ael2019.07.0025
Krupp, L. (2023, September 7). Vermont apple growers facing crop loss from freeze still want visitors this fall. Vermont Public. https://www.vermontpublic.org/local-news/2023-09-07/vermont-apple-growers-facing-crop-loss-from-freeze-still-want-visitors-this…
Lamas, Z. S., Rinkevich, F., Garavito, A., Shaulis, A., Boncristiani, D., Hill, E., Chen, Y. P., & Evans, J. D. (2025). Viruses and vectors tied to honey bee colony losses (p. 2025.05.28.656706). bioRxiv. https://doi.org/10.1101/2025.05.28.656706
Lawley, Y. (2016). Planting Radishes to Alleviate Soil Compaction [Video]. Canola School. https://www.youtube.com/watch?v=q-4xLrk_UC4&t=2s
Lawson, D. A., & Rands, S. A. (2019). The effects of rainfall on plant–pollinator interactions. Arthropod-Plant Interactions, 13(4), 561–569. https://doi.org/10.1007/s11829-019-09686-z
Leon, B., & Nevins, M. (2018). Monitoring ozone pollution levels and foliar injury in Northern and Southern Vermont. The Forest Ecosystem Monitoring Cooperative (FEMC) Long-Term Monitoring Update. https://www.uvm.edu/femc/products/long_term_update/2018/vermont/ozone
Liczner, A. R., Schuster, R., Richardson, L. L., & Colla, S. R. (2023). Identifying conservation priority areas for North Americanbumble bee species in Canada under current and future climate scenarios. Conservation Science and Practice, 5(8), e12994. https://doi.org/10.1111/csp2.12994
Lindsey, A. J., Ortez, O. A., Thomison, P. R., Carter, P. R., Coulter, J. A., Roth, G. W., Carrijo, D. R., Quinn, D. J., & Licht, M. A. (2024). Severe storm damage and short‐term weather stresses on corn: A review. Crop Science, 64(3), 1129–1166. https://doi.org/10.1002/csc2.21212
Liu, C., Hofstra, N., & Franz, E. (2013). Impacts of climate change on the microbial safety of pre-harvest leafy green vegetables as indicated by Escherichia coli O157 and Salmonella spp. International Journal of Food Microbiology, 163(2), 119–128. https://doi.org/10.1016/j.ijfoodmicro.2013.02.026
Longstroth, M. (2015, April 21). What is the difference between a frost and a freeze? MSU Extension. https://www.canr.msu.edu/news/what_is_the_difference_between_a_frost_and_a_freeze
Lori, M., Leitao, R., David, F., Imbert, C., Corti, A., Cunha, L., Symanczik, S., Bünemann, E. K., Creamer, R., & Vazquez, C. (2025). Response of soil biota to agricultural management practices: A systematic quantitative meta-data-analysis and method selection framework. Soil Biology and Biochemistry, 207, 109815. https://doi.org/10.1016/j.soilbio.2025.109815
Łysiak, G. P., & Szot, I. (2023). The Use of Temperature Based Indices for Estimation of Fruit Production Conditions and Risks in Temperate Climates. Agriculture, 13(5), 960. https://doi.org/10.3390/agriculture13050960
Ma, C.-S., Zhang, W., Peng, Y., Zhao, F., Chang, X.-Q., Xing, K., Zhu, L., Ma, G., Yang, H.-P., & Rudolf, V. H. W. (2021). Climate warming promotes pesticide resistance through expanding overwintering range of a global pest. Nature Communications, 12(1), 5351. https://doi.org/10.1038/s41467-021-25505-7
Maden, B., Callahan, C., Grubinger, V., & Chamberlin, A. (2024). A Guide to Preparing High Tunnels for Extreme Weather (p. 8). University of Vermont Extension. https://blog.uvm.edu/cwcallah/files/2024/08/High-Tunnels-Extreme-Weather-2024-08-13.pdf
Magdoff, F., & Van Es, H. (1993). Building Soils for Better Crops: Ecological Management for Healthy Soils (4th ed.). Sustainable Agriculture and Research Education. https://doi.org/10.1097/00010694-199311000-00014
Mao, C., Wang, Y., Ran, J., Wang, C., Yang, Z., & Yang, Y. (2025). Effects of warming and precipitation change on soil nitrogen cycles: A meta-analysis. Journal of Plant Ecology, 18(3), rtaf051. https://doi.org/10.1093/jpe/rtaf051
Matt, M. (2020). Rural Farm Electrification. Vermont Journal of Environmental Law. https://vjel.vermontlaw.edu/ecoperspectives-blog/2020/06/rural-farm-electrification-2/
McCarthy, A. (2023). Large Grocery Stores 2 [Dataset]. Vermont Center for Geographical Information. https://www.arcgis.com/home/item.html?id=27bf3aca3d8c4323ac6688198985b6a2
McCarthy, A. C., Bertmann, F., Belarmino, E., Bliss, S., Laurent, J., Malacarne, J., Merrill, S., Schattman, R. E., Yerxa, K., & Niles, M. T. (2022). A 2022 Assessment of Food Security and Health Outcomes during the COVID-19 Pandemic. National Food Access and COVID Research Team. https://scholarworks.uvm.edu/server/api/core/bitstreams/5ec731ab-07eb-450b-a090-27608edc6c5e/content
McGuirk, M., Shuford, S., Peterson, T. C., & Pisano, P. (2009). Weather and Climate Change Implications for Surface Transportation in the USA. World Meteorological Organization, 59(2). https://wmo.int/media/magazine-article/weather-and-climate-change-implications-surface-transportation-usa
Menegat, S., Ledo, A., & Tirado, R. (2022). Greenhouse gas emissions from global production and use of nitrogen synthetic fertilisers in agriculture. Scientific Reports, 12(1), 14490. https://doi.org/10.1038/s41598-022-18773-w
Milideo, L. (2025). Research for Vermont: Multitasking Agriculture Research Benefits Nature, Vermonters. University of Vermont Gund Institute for Environment. https://www.uvm.edu/gund/news/research-vermont-multitasking-agriculture-research-benefits-nature-vermonters
Mitchell, R., Bolster, C. H., Kitts, A., Campbell, A., Cosh, M., Farrigan, T., Franzluebbers, A. J., Hoover, D. L., Jin, V. L., Peck, D. E., Schmer, M. R., & Smith, M. D. (2023). Ch. 11. Agriculture, food systems, and rural communities. In Fifth National Climate Assessment. U.S. Global Change Research Program. https://doi.org/https://toolkit.climate.gov/sites/default/files/2025-07/NCA5_Ch11_Agriculture.pdf
Morelli, T. L., & Stinson, K. (2018). Climate Effects on the Culture and Ecology of Sugar Maple. https://www.sciencebase.gov/catalog/item/5bb25f79e4b08583a5d5999d
Munson, K. (2024, July). One Year After the Flood: Building Resilience in Agriculture. UVM News. https://www.uvm.edu/uvmnews/news/one-year-after-flood-building-resilience-agriculture
NEFSPP. (2022). Local Food Count. New England Feeding New England. https://nefoodsystemplanners.org/dashboard_posts/local-food-count/
NEFSPP. (2023). New England Feeding New England: Vermont State Brief. New England Food System Planners Partnership. https://nefoodsystemplanners.org/wp-content/uploads/NEFNE-VERMONT-State-Brief.pdf
Newton, K., & Ehnstrom. (2025, June 1). Sweet survival: Vermont businesses navigate climate cocoa crisis. VTDigger. https://vtdigger.org/2025/06/01/sweet-survival-vermont-businesses-navigate-climate-cocoa-crisis/
Ng, M., & Ghimire, S. (2023). Climate Adaptation Tactics in Vegetable Production. https://doi.org/https://doi.org/10.61899/ucext.v1.024.2024
Nicholson, C. C., Knapp, J., Kiljanek, T., Albrecht, M., Chauzat, M.-P., Costa, C., De La Rúa, P., Klein, A.-M., Mänd, M., Potts, S. G., Schweiger, O., Bottero, I., Cini, E., De Miranda, J. R., Di Prisco, G., Dominik, C., Hodge, S., Kaunath, V., Knauer, A., … Rundlöf, M. (2024). Pesticide use negatively affects bumble bees across European landscapes. Nature, 628(8007), 355–358. https://doi.org/10.1038/s41586-023-06773-3
Nishiuchi, S., Yamauchi, T., Takahashi, H., Kotula, L., & Nakazono, M. (2012). Mechanisms for coping with submergence and waterlogging in rice. Rice, 5(1), 2. https://doi.org/10.1186/1939-8433-5-2
NOAA NCEI. (2025). U.S. Billion-Dollar Weather and Climate Disasters (2025) [Dataset]. NOAA National Centers for Environmental Information. https://doi.org/10.25921/STKW-7W73
NOAA NECI. (2026). Climate at a Glance: National Time Series. NOAA National Centers for Environmental Information. https://www.ncei.noaa.gov/access/monitoring/climate-at-a-glance/national/time-series/110/tavg/60/0/1900-2024?base_prd=true&begb…
NOFA-VT. (2026). Farmer Emergency Fund. https://www.nofavt.org/farmer-emergency-fund
Nottermann, K. (2015, January 26). What is the food system and why does it matter? | Vermont Sustainable Jobs Fund. https://www.vsjf.org/2015/01/26/what-is-the-food-system/
Nowroz, F., Hasanuzzaman, M., Siddika, A., Parvin, K., Caparros, P. G., Nahar, K., & Prasad, P. V. V. (2024). Elevated tropospheric ozone and crop production: Potential negative effects and plant defense mechanisms. Frontiers in Plant Science, 14, 1244515. https://doi.org/10.3389/fpls.2023.1244515
NRCS. (2009). Controlling Soil Erosion. USDA Nationl Resources Conservation Services. https://www.nrcs.usda.gov/sites/default/files/2023-01/Controlling%20Soil%20Erosion-%20Small%20Scale%20Solutions%20for%20%20your…
NRCS. (2017). Pollinator Habitat (Vermont - Biology Technical Note 4). USDA Natural Resources Conservation Service. https://www.uvm.edu/d10-files/documents/2024-08/VT_NRCS_Biology_TechNote_4.pdf
NRCS. (2021). Conservation Practice Standard Nutrient Management (Code 590) (590-CPS-1). https://www.nrcs.usda.gov/resources/guides-and-instructions/nutrient-management-ac-590-conservation-practice-standard
NRCS. (2025, December 9). High Tunnel Initiative | Natural Resources Conservation Service. https://www.nrcs.usda.gov/programs-initiatives/eqip-high-tunnel-initiative
NRCS. (2026). Soil Health. USDA National Resources Conservation Service. https://www.nrcs.usda.gov/conservation-basics/natural-resource-concerns/soil/soil-health
Ortez, O. A., Lindsey, A. J., Thomison, P. R., Coulter, J. A., Singh, M. P., Carrijo, D. R., Quinn, D. J., Licht, M. A., & Bastos, L. (2023). Corn response to long-term seasonal weather stressors: A review. Crop Science, 63(6), 3210–3235. https://doi.org/10.1002/csc2.21101
Oswald, E. M., Pontius, J., Rayback, S. A., Schaberg, P. G., Wilmot, S. H., & Dupigny-Giroux, L.-A. (2018). The complex relationship between climate and sugar maple health: Climate change implications in Vermont for a key northern hardwood species. Forest Ecology and Management, 422, 303–312. https://doi.org/10.1016/j.foreco.2018.04.014
Pardo, G., & Prado, A. del. (2020). Guidelines for small ruminant production systems under climate emergency in Europe. Small Ruminant Research, 193. https://doi.org/https://doi.org/10.1016/j.smallrumres.2020.106261
Peña, O., Hafner, J. A. H., & Schimoler, L. E. (2022). Racial Equity in the Vermont Food System (Vermont Food System Issue Brief). Vermont Sustainable Jobs Fund. https://doi.org/https://doi.org/10.7930/NCA5.2023.CH21
Perkins, T. (2018, April 11). Climate Change and Maple Syrup Production. Vermont Maple Conferences 2018. https://mapleresearch.org/pub/climatechangevideo2018/
Peters, M. P., Iverson, L. R., Prasad, A. M., & Matthews, S. N. (2020). Climate change tree atlas, Version 4. U.S. Forest Service, Northern Research Station and Northern Institute of Applied Climate Science. https://doi.org/10.2737/RDS-2019-0029
Phillips, M., Johnson, L., & Schultz, J. (2022). Creating Pollinator Habitat Can Help Northeast Farmers. USDA Northeast Climate Hub. https://www.climatehubs.usda.gov/hubs/northwest/topic/northwest-pollinators-and-climate-change
Porterfield, K. K., Schambura, M. N., & Roy, E. D. (2026). Food waste recycling in the USA can reduce climate and nutrient pollution impacts yet risks plastic accumulation in soils. Nature Food, 7(8), 763–772. https://doi.org/10.1038/s43016-026-01396-z
Potts, S. G., Biesmeijer, J. C., Kremen, C., Neumann, P., Schweiger, O., & Kunin, W. E. (2010). Global pollinator declines: Trends, impacts and drivers. Trends in Ecology & Evolution, 25(6), 345–353. https://doi.org/10.1016/j.tree.2010.01.007
Practical Farmers of Iowa (Director). (2021, February). High Tunnel Storm Protection and Routine Maintenance [Video recording]. https://www.youtube.com/watch?v=OEmIrxnwo4A
Pupo, M. R., Ferraretto, L. F., & Nicholson, C. F. (2025). Effects of feeding 3-nitrooxypropanol for methane emissions reduction on income over feed costs in the United States. Journal of Dairy Science, 108(5), 5061–5075. https://doi.org/10.3168/jds.2024-25502
Qian, B., Jing, Q., Jégo, G., Bélanger, G., Smith, W., VanderZaag, A., Shang, J., Liu, J., Grant, B., & Crépeau, M. (2024). Warmer future climate in Canada—Implications for winter survival of perennial forage crops. Canadian Journal of Plant Science, 104(4), 320–335. https://doi.org/10.1139/cjps-2023-0192
Rabot, E., Wiesmeier, M., Schlüter, S., & Vogel, H.-J. (2018). Soil structure as an indicator of soil functions: A review. Geoderma, 314, 122–137. https://doi.org/10.1016/j.geoderma.2017.11.009
Rademacher, T., Cliche, M., Bouchard, É., Kurokawa, S. Y. S., Rapp, J., Deslauriers, A., Messier, C., Rossi, S., Dupras, J., Filotas, É., & Delagrange, S. (2023). TAMM review: On the importance of tap and tree characteristics in maple sugaring. Forest Ecology and Management, 535, 120896. https://doi.org/10.1016/j.foreco.2023.120896
Rahimi, E., & Jung, C. (2024). Global Trends in Climate Suitability of Bees: Ups and Downs in a Warming World. Insects, 15(2), 127. https://doi.org/10.3390/insects15020127
Rapp, J. M., Lutz, D. A., Huish, R. D., Dufour, B., Ahmed, S., Morelli, T. L., & Stinson, K. A. (2019). Finding the sweet spot: Shifting optimal climate for maple syrup production in North America. Forest Ecology and Management, 448, 187–197. https://doi.org/10.1016/j.foreco.2019.05.045
Ratliff, M., Faulkner, J., Roy, E. D., English, M., Liptzin, D., Afshar, R. K. ., & Adair, C. E. (2026). Topography, management, and extreme precipitation influence greenhouse gas emissions in a cool, humid corn silage system. [Manuscript under Review].
Ravagnolo, O., & Misztal, I. (2000). Genetic Component of Heat Stress in Dairy Cattle, Parameter Estimation. Journal of Dairy Science, 83(9), 2126–2130. https://doi.org/10.3168/jds.S0022-0302(00)75095-8
Reuscher, K. J., Cook, N. B., da Silva, T. E., Mondaca, M. R., Lutcherhand, K. M., & Van Os, J. M. C. (2023). Effect of different air speeds at cow resting height in freestalls on heat stress responses and resting behavior in lactating cows in Wisconsin. Journal of Dairy Science, 106(12), 9552–9567. https://doi.org/10.3168/jds.2023-23364
Rhoads, M. L., Rhoads, R. P., VanBaale, M. J., Collier, R. J., Sanders, S. R., Weber, W. J., Crooker, B. A., & Baumgard, L. H. (2009). Effects of heat stress and plane of nutrition on lactating Holstein cows: I. Production, metabolism, and aspects of circulating somatotropin. Journal of Dairy Science, 92(5), 1986–1997. https://doi.org/10.3168/jds.2008-1641
Rich, J. (2025, January). VVBGA 2024 Annual Report—Letter from President [Letter]. https://vvbga.org/sites/default/files/inline-files/2024%20Final%20Report%201.14.25_1.pdf
Richardson, L., McFarland, K., Zahendra, S., & Hardy, S. (2019). Bumble bee (Bombus) distribution and diversity in Vermont, USA: A century of change. Journal of Insect Conservation, 23. https://doi.org/10.1007/s10841-018-0113-5
Rizzo, A., Boano, F., Revelli, R., & Ridolfi, L. (2013). Role of water flow in modeling methane emissions from flooded paddy soils. Advances in Water Resources, 52, 261–274. https://doi.org/10.1016/j.advwatres.2012.11.016
Rockler, N. (2023). Economic Impact of New England’s Food System. New England Feeding New England. https://nefoodsystemplanners.org/wp-content/uploads/NEFNE_Volume-3_Economic-Impact-of-Regional-and-State-Production.pdf
Ross, D. S., Wemple, B. C., Willson, L. J., Balling, C. M., Underwood, K. L., & Hamshaw, S. D. (2019). Impact of an Extreme Storm Event on River Corridor Bank Erosion and Phosphorus Mobilization in a Mountainous Watershed in the Northeastern United States. Journal of Geophysical Research: Biogeosciences, 124(1), 18–32. https://doi.org/10.1029/2018JG004497
Rosset, P., Val, V., Barbosa, L. P., & McCune, N. (2019). Agroecology and La Via Campesina II. Peasant agroecology schools and the formation of a sociohistorical and political subject. Agroecology and Sustainable Food Systems, 43(7–8), 895–914. https://doi.org/10.1080/21683565.2019.1617222
Ruggiero, R., Ross, D., & Faulkner, J. W. (2022). Tile Drainage Flow Partitioning and Phosphorus Export in Vermont USA. Agriculture, 12(2), 167. https://doi.org/10.3390/agriculture12020167
Rui, Y., Goller, B., & Kladivko, E. J. (2024). Long-term crop yield benefits of subsurface drainage on poorly drained soils. Agronomy Journal, 116(5), 2151–2162. https://doi.org/10.1002/agj2.21621
Russell, J. (2024, July). How the Shock of Catastrophic Floods Is Changing Farming in Vermont. New York Times. https://www.nytimes.com/2024/07/28/us/flooding-farming-vermont.html
Sadoff, K., & Barton, A. (2018, July). Flooded fields leave Vermont farmers with. Burlington Free Press.
Sassi, G., & Hazelrigg, A. (2025). Growers Guide to Seedborne Diseases of Dry Bean (Phaseolus Vulgaris). UVM Extension. https://uvm.edu/d10-files/documents/2025-10/Growers-Guide-to-Seedborne-Diseases-of-Dry-Bean-Phaseolus-Vulgaris-1.pdf
Schattman, R., Faulkner, J., & Bradshaw, T. (2020). Proceedings from the 2019 Northeast Specialty Crop Water Symposium. 21742909 Bytes. https://doi.org/10.6084/M9.FIGSHARE.12383003
Schlesinger, W. H., & Andrews, J. A. (2000). Soil respiration and the global carbon cycle. Biogeochemistry, 48(1), 7–20. https://doi.org/10.1023/A:1006247623877
Schoeneberger, M. M., Bentrup, G., & Patel-Weynard, T. (Eds.). (2017). Agroforestry: Enhancing Resiliency in U.S. Agricultural Landscapes Under Changing Conditions (General Technical Report WO-96; p. 228). USDA Forest Service. https://doi.org/https://doi.org/10.2737/WO-GTR-96.
Schuster, E., & Klieger, M. (2023). An Economic Analysis of Impact and Lessons Learned. Vermont Emergency Eats. https://sustainableeconomies.com/wp-content/uploads/2024/01/2023-Vermont-Emergency-Eats-Economic-Report_digital.pdf
Schweiger, O., Biesmeijer, J. C., Bommarco, R., Hickler, T., Hulme, P. E., Klotz, S., Kühn, I., Moora, M., Nielsen, A., Ohlemüller, R., Petanidou, T., Potts, S. G., Pyšek, P., Stout, J. C., Sykes, M. T., Tscheulin, T., Vilà, M., Walther, G.-R., Westphal, C., … Settele, J. (2010). Multiple stressors on biotic interactions: How climate change and alien species interact to affect pollination. Biological Reviews, 85(4), 777–795. https://doi.org/10.1111/j.1469-185X.2010.00125.x
Scott, P. B., Roberts, J. D. E., & Tebbetts, A. B. (2023). Frost declaration from Governor of Vermont to USDA Secretary Thomas J. Vilsack [Letter]. https://governor.vermont.gov/sites/scott/files/documents/Frost%20Declaration%20USDA%206.19.23.pdf
Serrano-Cortés, N., Whitehouse, C., Conner, D., Rodríguez-Pérez, R., Cunningham, N. M., Reynolds, T., & Daigle. (2023). Food Resilience Toolkit (p. 199). College of Agriculture and Life Sciences Faculty Publications. https://www.uvm.edu/d10-files/documents/2025-09/2023-Food-Resilience-Toolkit.pdf
Seyler, E. (2026). Can Tile Drainage and Best Management Practices Improve Water Quality and Crop Yields in the Lake Champlain Basin? UVM Extension. https://www.uvm.edu/extension/nwcrops/news/can-tile-drainage-and-best-management-practices-improve-water-quality-and
Sherman, J., Young, E., Jokela, W., & Kieke, B. (2022). Manure Application Timing and Incorporation Effects on Ammonia and Greenhouse Gas Emissions in Corn. Agriculture, 12(11), 1952. https://doi.org/10.3390/agriculture12111952
Shirzaei, M., Khoshmanesh, M., Ojha, C., Werth, S., Kerner, H., Carlson, G., Sherpa, S. F., Zhai, G., & Lee, J.-C. (2021). Persistent impact of spring floods on crop loss in U.S. Midwest. Weather and Climate Extremes, 34, 100392. https://doi.org/10.1016/j.wace.2021.100392
Silvestro, R., Rossi, S., Berthiaume, R., Bauce, É., Rademacher, T., & Deslauriers, A. (2025). Tamm review: The impact of forest tent caterpillar defoliation on maple fitness and syrup production. Forest Ecology and Management, 595, 123011. https://doi.org/10.1016/j.foreco.2025.123011
Singh, A., Schöb, C., & Iannetta, P. P. M. (2023). Nitrogen fixation by common beans in crop mixtures is influenced by growth rate of associated species. BMC Plant Biology, 23(1), 253. https://doi.org/10.1186/s12870-023-04204-z
Skendžić, S., Zovko, M., Živković, I. P., Lešić, V., & Lemić, D. (2021). The Impact of Climate Change on Agricultural Insect Pests. Insects, 12(5), 440. https://doi.org/10.3390/insects12050440
Skinner, C. B., DeGaetano, A. T., & Chabot, B. F. (2010). Implications of twenty-first century climate change on Northeastern United States maple syrup production: Impacts and adaptations. Climatic Change, 100(3), 685–702. https://doi.org/10.1007/s10584-009-9685-0
Solsaa, G. (2024, September 28). Agritourism in Vt. Feels effects of climate change. Times Argus. https://www.timesargus.com/news/local/agritourism-in-vt-feels-effects-of-climate-change/article_7af195fc-7ccf-11ef-974f-8b0b9a6…
Stern, R. L., Schaberg, P. G., Rayback, S. A., Hansen, C. F., Murakami, P. F., & Hawley, G. J. (2023). Growth trends and environmental drivers of major tree species of the northern hardwood forest of eastern North America. Journal of Forestry Research, 34(1), 37–50. https://doi.org/10.1007/s11676-022-01553-7
Storrow, J. (2025, May 15). Adapting to Flooding and Drought on Hurricane Flats Farm. SARE. https://www.sare.org/news/adapting-to-flooding-and-drought-on-hurricane-flats-farm-in-south-royalton-vermont/
Sujayanand, G. K., & Karuppaiah, V. (2016). Aftermath of climate change on insect migration: A review. Agricultural Reviews, 37(3), 221–227. https://doi.org/10.18805/ag.v37i3.3537
Sutherst, R. W., Constable, F., Finlay, K. J., Harrington, R., Luck, J., & Zalucki, M. P. (2011). Adapting to crop pest and pathogen risks under a changing climate. WIREs Climate Change, 2(2), 220–237. https://doi.org/10.1002/wcc.102
Talluto, L., Boulangeat, I., Vissault, S., Thuiller, W., & Gravel, D. (2017). Extinction debt and colonization credit delay range shifts of eastern North American trees. Nature Ecology & Evolution, 1(7), 0182. https://doi.org/10.1038/s41559-017-0182
Tamburini, G., Bommarco, R., Wanger, T. C., Kremen, C., Van Der Heijden, M. G. A., Liebman, M., & Hallin, S. (2020). Agricultural diversification promotes multiple ecosystem services without compromising yield. Science Advances, 6(45), eaba1715. https://doi.org/10.1126/sciadv.aba1715
Tanier, J. (2023, August 3). How flood damage to Vermont’s farms is changing food assistance programs. Vermont Public. https://www.vermontpublic.org/local-news/2023-08-03/how-flood-damage-to-vermonts-farms-is-changing-food-assistance-programs
Tara, J. (2024, June 7). Farmers in Burlington’s Intervale learn to balance rewards with risk. https://www.wcax.com/2024/06/07/farmers-burlingtons-intervale-learn-balance-rewards-with-risk/
Thivierge, M., Bélanger, G., Jégo, G., Delmotte, S., Rotz, C. A., & Charbonneau, É. (2023). Perennial forages in cold‐humid areas: Adaptation and resilience‐building strategies toward climate change. Agronomy Journal, 115(4), 1519–1542. https://doi.org/10.1002/agj2.21354
Thomas, S. (2025, October 20). UVM researchers developing system to turn cow manure into propane [Video recording]. WCAX. https://www.wcax.com/2025/10/20/uvm-researchers-developing-system-turn-cow-manure-into-propane/
Thomison, P. R., Mullen, R. W., Lipps, P. E., Doerge, T., & Geyer, A. B. (2011). Corn Response to Harvest Date as Affected by Plant Population and Hybrid. Agronomy Journal, 103(6), 1765–1772. https://doi.org/10.2134/agronj2011.0147
Thornton, P., Nelson, G., Mayberry, D., & Herrero, M. (2022). Impacts of heat stress on global cattle production during the 21st century: A modelling study. The Lancet Planetary Health, 6(3), e192–e201. https://doi.org/10.1016/S2542-5196(22)00002-X
Tigchelaar, M., Battisti, D. S., & Spector, J. T. (2020). Work adaptations insufficient to address growing heat risk for U.S. agricultural workers. Environmental Research Letters, 15(9), 094035. https://doi.org/10.1088/1748-9326/ab86f4
Timmerman, A., Jackson-Ziems, T., Elmore, R., Williams, T., & Krienke, B. (2018). Flooding and Ponding in Corn. University of Nebraska- Lincoln Institute of Agriculture and Natural Resources Cropwatch. https://cropwatch.unl.edu/2018/flooding-and-ponding-corn/
Tobin, D., Janowiak, M., Hollinger, D., Skinner, H., Swanston, C., Steele, R., Radhakrishna, R., & Chatrchyan, A. (2015). Northeast and Northern Forests Regional Climate Hub Assessment of Climate Change Vulnerability and Adaptation and Mitigation Strategies. USDA Northeast Climate Hub. https://doi.org/10.32747/2015.6965350.ch
Traynor, M. (2024, July 25). Press Release: Intervale Farmer Recovery Fund. Intervale Center. https://www.intervale.org/blog-source/press-release-intervale-farmer-recovery-fund
U. Vermont Spatial Analysis Lab. (2022). Land Cover Agricultural 2022 polygons (Version 2022) [Vector]. Vermont Center for Geographical Information. https://geodata.vermont.gov/pages/land-cover
UC CCJ. (2026, March 3). What is Climate Justice? University of California Center for Climate Justice. https://centerclimatejustice.universityofcalifornia.edu/what-is-climate-justice/
Unangst-Rufenacht, G., Wills, M., Turner, D., Bloomer, A., Levin, M., Gliserman, C., Inwood, S. M., Rissing, A., & Becot, F. (2022). Child Care (Vermont Food System Issue Brief). Vermont Sustainable Jobs Fund. https://www.vtfarmtoplate.com/sites/default/files/2022-03/vermont_food_system_plan_issue_brief_child_care.pdf
USDA. (2006). Milk Production, Disposition and Income 2005 Summary. USDA National Agricultural Statistics Service. https://www.ams.usda.gov/sites/default/files/media/Milk%20Prod%20Disposition%20and%20Income%202005.pdf
USDA. (2020). Managing Dairy Heat Stress in the Northeast’s Rapidly Changing Climate. USDA Northeast Climate Hub. https://www.climatehubs.usda.gov/sites/default/files/ARS_heatstress_April2020_508tagged.pdf
USDA. (2023). 2023 USDA Plant Hardiness Zone Map. U.S. Department of Agriculture. https://planthardiness.ars.usda.gov/
USDA. (2024). 2022 Census of Agriculture: Vermont (Geographic Area Series 45). United States Department of Agriculture, National Agricultural Statistics Service. https://www.nass.usda.gov/Publications/AgCensus/2022/Full_Report/Volume_1%2C_Chapter_1_State_Level/Vermont/
USDA. (2026a). Local Food Directories [Dataset]. https://www.usdalocalfoodportal.com/fe/fdirectory_foodhub/?directory=foodhub&radius=30&term=&location=Vermont&x=-72.57784149999…
USDA. (2026b, February 26). Definitions: Sustainability and Food Systems. https://www.usda.gov/about-usda/general-information/staff-offices/office-chief-economist/sustainability/definitions-sustainabil…
USGCRP. (2023). Fifth National Climate Assessment (No. 5th). U.S. Global Change Research Program. https://nca5.climate.us/downloads/NCA5_2023_FullReport.pdf
Utemuratov, B., Alvez, J. P., Shrestha, P., & Faulkner, J. W. (2025). Pasture cropping and keyline plow as strategies to mitigate compaction in clay soils in Vermont. Agricultural & Environmental Letters, 10(1), e70023. https://doi.org/10.1002/ael2.70023
UVM CALS. (2024, April 30). What’s Buzzing ArchiveVermont Pasture Research Includes State’s First Dung Beetle Survey. UVM College of Agriculture and Life Sciences What’s Buzzing Archive. https://site.uvm.edu/cals-news/vermont-pasture-research-dung-beetle-survey/
UVM Extension. (2020). Brassica Production Practices and Concerns in Vermont and the Northeast. University of Vermont Extension. https://www.uvm.edu/d10-files/documents/2024-08/Brassica_Survey_Results_Article.pdf
UVM Extension. (2021). Guide to Using Annual Forages in the Northeast. University of Vermont Extension. https://www.uvm.edu/d10-files/documents/2024-06/Annual_Forage_Guide_5.pdf
UVM Extension. (2024). Bedded Pack in Vermont: Five Stories. https://www.uvm.edu/d10-files/documents/2024-10/508_beddedpackwebversionfinal.pdf
UVM IFA. (2025). Seeding Partnerships for Agroecology and Just Transitions in the Northeast Kingdom. UVM Institute for Agroecology. https://www.uvm.edu/d10-files/documents/2025-10/Seeding-Partnerships-NEK-2025.pdf
UVM OVPR. (2026). Food Systems Research Institute: Sustainable Dairy Systems. UVM Office of the Vice President of Research. https://www.uvm.edu/ovpr/food-systems-research/sustainable-dairy-systems
VAAFM. (2023a). Severe Weather and Flooding Loss & Damage Survey Results. Vermont Agency of Agriculture, Food & Markets. https://agriculture.vermont.gov/sites/agriculture/files/documents/Flood%20Survey%20Results%20Report%202023.pdf
VAAFM. (2023b). Vermont Agriculture Recovery Task Force Extreme Weather Impact & Recovery Report. VAAFM. https://agriculture.vermont.gov/sites/agriculture/files/documents/Ag%20Recovery%20Task%20Force%20Report.pdf
VAAFM. (2024a). 2024 Flood Loss Damage Survey. Vermont Agency of Agriculture, Food & Markets. https://app.powerbigov.us/view?r=eyJrIjoiZTg2YzgxMDQtYTkyNC00MTY2LTkzMzctOWEyZmRkOWVmMjNiIiwidCI6IjIwYjQ5MzNiLWJhYWQtNDMzYy05Yz…
VAAFM. (2024b, October). Agriculture Flood Loss and Damage Survey Released—2024. Vermont.Gov. https://agriculture.vermont.gov/humanservices/severe-weather-and-flooding-agricultural-impacts-survey-2024
VAAFM. (2024c, December 18). Flood Recovery for VT Farms. Vermont Agriculture Recovery Task Force. https://agriculture.vermont.gov/sites/agriculture/files/documents/Flood%202024%2012.18.24.pdf
VAAFM. (2025). Vermont Apiary Status Report: 2024. Vermont Agency of Agriculture, Food & Markets. https://legislature.vermont.gov/Documents/2026/Workgroups/Senate%20Agriculture/Bees/W~Brooke%20Decker~Apiary%20Status%20Report%…
VAAFM. (2026a). 2025 Vermont Agriculture Drought Survey Report. Vermont Agency of Agriculture, Food & Markets. https://agriculture.vermont.gov/sites/agriculture/files/documents/Drought%20Impact%20Report_Final%20Draft.pdf
VAAFM. (2026b). Business Planning. Vermont Agency of Agriculture, Farms, and Markets. https://agriculture.vermont.gov/businessdevelopment/business-planning-assistance/business-planning
van Gastelen, S., Burgers, E. E. A., Dijkstra, J., de Mol, R., Muizelaar, W., Walker, N., & Bannink, A. (2024). Long-term effects of 3-nitrooxypropanol on methane emission and milk production characteristics in Holstein-Friesian dairy cows. Journal of Dairy Science, 107(8), 5556–5573. https://doi.org/10.3168/jds.2023-24198
VAPDA. (2025). New Regional Housing Targets and Housing Data Dashboard Help Set Roadmap for Addressing Vermont’s Housing Shortage |. Vermont Agency of Commerce and Community Development. https://accd.vermont.gov/press-releases/new-regional-housing-targets-and-housing-data-dashboard-help-set-roadmap-addressing
VCGI. (2022). VT Data—Downloadable Topographically Defined Floodplains—Lake Champlain Basin (probHAND 2022)[Dataset]. https://geodata.vermont.gov/documents/f5a54fbd76114fbb99cf17a0a018ecf6/explore
Vermont Agency of Transportation. (2021). VT Road Centerline [Dataset]. Vermont Center for Geographical Information. https://geodata.vermont.gov/?_gl=1*102zw6x*_ga*NDU5MTA1NDAwLjE3ODA3MDIzNDU.*_ga_V9WQH77KLW*czE3ODA3MDIzNDUkbzEkZzEkdDE3ODA3MDM5…
Vermont Climate Council. (2021a). Carbon Budget Report Review and Recommendation [Letter]. https://outside.vermont.gov/agency/anr/climatecouncil/Shared%20Documents/Ag-Eco-Finding-Reccomendations-Carbon-Inventory-Report…
Vermont Climate Council. (2021b). Vermont Climate Action Plan 2025: Appendix 14. https://outside.vermont.gov/agency/anr/climatecouncil/Shared%20Documents/(14)%20A%26E%20Matrices.pdf?_gl=1*185sybc*_ga*OTkwODYy…..
Vermont Climate Council. (2025). Vermont Climate Action Plan 2025. https://outside.vermont.gov/agency/anr/climatecouncil/Shared%20Documents/VermontClimateActionPlan2025.pdf?_gl=1*r9dtnm*_ga*MTM4…
VSJF. (2021). Vermont Agriculture & Food System Strategic Plan 2021-2030. Vermont Sustainable Jobs Fund. https://www.vtfarmtoplate.com/plan
VSJF. (2024). Food Security in Vermont: Roadmap to 2035. Vermont Sustainable Jobs Fund. https://www.vtfarmtoplate.com/sites/default/files/2024-01/Food-Security-Roadmap-FINAL-Web-pages.pdf
VT ANR. (2024). Vermont Greenhouse Gas Emissions Inventory and Forecast 1990—2021. Vermont Agency of Natural Resources. https://outside.vermont.gov/agency/anr/climatecouncil/Shared%20Documents/1990-2021_GHG_Inventory_Uploads/_Vermont_Greenhouse_Ga…
VT Farm to Plate. (2026). Food System Map [Dataset]. https://www.vtfarmtoplate.com/food-system-map
VT Global Warming Solutions Act, Pub. L. No. Act 153 (2020). https://outside.vermont.gov/agency/anr/climatecouncil/Shared%20Documents/ACT%20153%20As%20Enacted.pdf?_gl=1*1t57lz8*_ga*MTM4MDA…
VVBGA. (2025). VVBGA Pest and Scouting Report. UVM Blogs. https://blog.uvm.edu/vepart-scouting/2025/07/24/vvbga-pest-and-scouting-report-7-23-25/
Walsh, M., Backlund, P., Buja, L., DeGaetano, A., Melnick, R., Prokopy, L., Takle, E., Todey, D., & Ziska, L. (2020). Climate Indicators for Agriculture. United States. Department of Agriculture. Climate Change Program Office. https://doi.org/10.32747/2020.7201760.ch
Wang, Q., Shore, A., Abah, E. O., & Cannella, M. (2025). Sweet Liquid Gold Facing Climate Change and Sour Market Conditions: A Strengths, Weaknesses, Opportunities, and Threats (SWOT) Analysis of the United States Maple Syrup Sector. Sustainability, 17(9), 4101. https://doi.org/10.3390/su17094101
Wang, Q., Thompson, E., Parsons, R., Rogers, G., & Dunn, D. (2011). Economic feasibility of converting cow manure to electricity: A case study of the CVPS Cow Power program in Vermont. Journal of Dairy Science, 94(10), 4937–4949. https://doi.org/10.3168/jds.2010-4124
Wang, Q., Thompson, E., Tweedy, A., O’Leary, M. L., & Crossman, W. W. (2021). Potentials and obstacles for community anaerobic digesters in the United States: Evidence from a case study in Vermont. Renewable and Sustainable Energy Reviews, 137, 110434. https://doi.org/10.1016/j.rser.2020.110434
WCAX. (2021, October 6). UVM study tests out feeding cows with seaweed [Video recording]. https://www.wcax.com/video/2021/10/06/uvm-study-tests-out-feeding-cows-with-seaweed/
Weigle, T. (2014, March 3). Grapes 101: Managing Black Rot | CALS. Cornell College of Agriculture and Life Sciences. https://cals.cornell.edu/news/2014/03/grapes-101-managing-black-rot
Wells-Spackman, T. (2025, July 13). High risks, low payouts: Vermont farmers say crop insurance falls short. VTDigger. https://vtdigger.org/2025/07/13/high-risks-low-payouts-vermont-farmers-say-crop-insurance-falls-short/
Wertlieb, M., & Smith, M. F. (2019, June). Vermont Farmers Struggle To Make Hay When The Sun Won’t Shine. Vermont Public Radio. https://www.vermontpublic.org/programs/2019-06-13/vermont-farmers-struggle-to-make-hay-when-the-sun-wont-shine
Westskog, H., Solnørdal, M. T., Vindegg, M., Tønnesen, A., Sandnes, T., Grasbekk, B. S., & Christensen, I. (2024). Local food systems and community development: A symbiotic relation? A case study of three rural municipalities in Norway. The International Journal of Sociology of Agriculture and Food, 30(1), 19–42. https://doi.org/10.48416/ijsaf.v30i1.534
Wezel, A., Herren, B. G., Kerr, R. B., Barrios, E., Gonçalves, A. L. R., & Sinclair, F. (2020). Agroecological principles and elements and their implications for transitioning to sustainable food systems. A review. Agronomy for Sustainable Development, 40(6), 40. https://doi.org/10.1007/s13593-020-00646-z
White, A., Faulkner, J., Sims, S., Tucker, P., & Weatherhogg, K. (2018). Report of the 2017-2018 New England Adaptation Survey for Vegetable and Fruit Growers. https://doi.org/10.13140/RG.2.2.14154.21440
White, A., Faulkner, J. W., Conner, D., Barbieri, L., Adair, E. C., Niles, M. T., Mendez, V. E., & Twombly, C. R. (2021a). Measuring the Supply of Ecosystem Services from Alternative Soil and Nutrient Management Practices: A Transdisciplinary, Field-Scale Approach. Sustainability, 13(18), 10303. https://doi.org/10.3390/su131810303
White, A., Faulkner, J. W., Conner, D., Barbieri, L., Adair, E. C., Niles, M. T., Mendez, V. E., & Twombly, C. R. (2021b). Measuring the Supply of Ecosystem Services from Alternative Soil and Nutrient Management Practices: A Transdisciplinary, Field-Scale Approach. Sustainability, 13(18), 10303. https://doi.org/10.3390/su131810303
Whitehead, J. C., Mecray, E. L., Lane, E. D., Kerr, L., Finucane, M. L., Reidmiller, D. R., Bove, M. C., Montalto, F. A., O’Rourke, S., Zarrilli, D. A., Chigbu, P., Thornbrugh, C. C., Curchitser, E. N., Hunter, J. G., & Law, K. (2023). Ch. 21 Northeast. In A. R. Crimmins, C. W. Avery, D. R. Easterling, K. E. Kunkel, B. C. Stewart, & T. K. Maycock (Eds.), Fifth National Climate Assessment. U.S. Global Change Research Program. https://nca5.climate.us/downloads/NCA5_Ch21_Northeast.pdf
Whitney, B., Wilmot, S., & Poirot, R. (2014). Monitoring ozone pollution levels and foliar injury in Northern and Southern Vermont. The Forest Ecosystem Monitoring Cooperative (FEMC) Long-Term Monitoring Update. https://www.uvm.edu/femc/products/long_term_update/2018/vermont/ozone
Willett, W., Rockström, J., Loken, B., Springmann, M., Lang, T., Vermeulen, S., Garnett, T., Tilman, D., DeClerck, F., Wood, A., Jonell, M., Clark, M., Gordon, L. J., Fanzo, J., Hawkes, C., Zurayk, R., Rivera, J. A., De Vries, W., Majele Sibanda, L., … Murray, C. J. L. (2019). Food in the Anthropocene: The EAT–Lancet Commission on healthy diets from sustainable food systems. The Lancet, 393(10170), 447–492. https://doi.org/10.1016/S0140-6736(18)31788-4
Wills, M., Unangst-Rufenacht, G., Wolcott-MacCausland, N., Fisher, M., Schlossberg, A., & Schultheis, E. (2022). Healthcare(Vermont Food System Issue Brief). Vermont Sustainable Jobs Fund. https://www.vtfarmtoplate.com/sites/default/files/2022-03/vermont_food_system_plan_issue_brief_health_care.pdf
Wolfe, D. W., DeGaetano, A. T., Peck, G. M., Carey, M., Ziska, L. H., Lea-Cox, J., Kemanian, A. R., Hoffmann, M. P., & Hollinger, D. Y. (2018). Unique challenges and opportunities for northeastern US crop production in a changing climate. Climatic Change, 146(1–2), 231–245. https://doi.org/10.1007/s10584-017-2109-7
Wolfe, D. W., Ziska, L., Petzoldt, C., Seaman, A., Chase, L., & Hayhoe, K. (2008). Projected change in climate thresholds in the Northeastern U.S.: Implications for crops, pests, livestock, and farmers. Mitigation and Adaptation Strategies for Global Change, 13(5), 555–575. https://doi.org/10.1007/s11027-007-9125-2
Workman, K. (2017, January 1). Gullies—A Significant Source of Soil Loss. UVM Blogs: Champlain Valley Crop, Soil and Pasture Team. https://blog.uvm.edu/cvcrops/gullies-a-significant-source-of-soil-loss/
Wright, A., Margolis, A., Doyon, A., Cooke, B., Fitzko, D., Filkorn, E., Petito, G., Lazorchak, J., Ulmer, J., Dupigny-Giroux, D. L.-A., Kamman, N., Renfrew, D. R., Patch, R., & Smith, S. (2025). Vermont Resilience Implementation Strategy. Vermont Agency of Natural Resources and Vermont State Treasurer’s Office. https://outside.vermont.gov/agency/anr/climatecouncil/Shared%20Documents/VermontResilienceImplementationStrategy.pdf?_gl=1*n67x…
Xerces Society. (2026). Nesting Resources. Pollinator Conservation. https://xerces.org/pollinator-conservation/nesting-resources
Xu, X., Sharma, P., Shu, S., Lin, T.-S., Ciais, P., Tubiello, F. N., Smith, P., Campbell, N., & Jain, A. K. (2021). Global greenhouse gas emissions from animal-based foods are twice those of plant-based foods. Nature Food, 2(9), 724–732. https://doi.org/10.1038/s43016-021-00358-x
Yang, M., Fu, Y., Li, G., Ren, Y., Li, Z., & Ma, G. (2020). Microcharacteristics of soil pores after raindrop action. Soil Science Society of America Journal, 84(5), 1693–1704. https://doi.org/10.1002/saj2.20113
Zhu, C., Wolf, J., Zhang, J., Anderegg, W. R. L., Bunce, J. A., & Ziska, L. H. (2023). Rising temperatures can negate CO2 fertilization effects on global staple crop yields: A meta-regression analysis. Agricultural and Forest Meteorology, 342, 109737. https://doi.org/10.1016/j.agrformet.2023.109737
Zinn, K. E., Tunc-Ozdemir, M., & Harper, J. F. (2010). Temperature stress and plant sexual reproduction: Uncovering the weakest links. Journal of Experimental Botany, 61(7), 1959–1968. https://doi.org/10.1093/jxb/erq053