Authors
Anna Maassel
Anna Hoppe
Keith Robinson
Christine Vatovec
About
Recommended citation for chapter
Maassel, A.K., Hoppe, A.K., Robinson, K.J., Vatovec, C.M., 2026, Chapter 10: Human Health. In Galford, G.L., Balerna, J.A., Turner H.C., Sardonis, A., Peplinski, H. (Eds), The Vermont Climate Assessment 2025. Burlington, Vermont: Climate Measurements Center of Excellence, Gund Institute for Environment at the University of Vermont. DOI: 10.5281/zenodo.20272849. Accessed online at https://vtclimate.org.
Author Contributor Roles Taxonomy (CRediT) statement
Anna Maassel: conceptualization, methodology, formal analysis, data curation, writing - original draft, writing - review & editing, visualization, and supervision; Anna Hoppe: conceptualization, methodology, formal analysis, data curation, writing - original draft, writing - review & editing, and visualization; Keith Robinson: writing - original draft; Christine Vatovec: conceptualization, writing - original draft, writing - review & editing.
Acknowledgements
The authors thank Jared Ulmer of the Vermont Department of Health (VDH) for his insight, guidance, review, and input to strengthen this chapter. Thanks to other team members at VDH—David Grass, Lauren Prinzing, and Natalie Kwit—for their review and input. The authors are also grateful to Hannah C. Turner for spatial data visualizations.
Downloads
Please use the following accessible downloads for your own needs.To find downloads of other chapters in VCA 2025, please go to Downloads.
- Human Health (high resolution PDF)
- Human Health (low resolution PDF)
- Human Health brief (PDF)
- Human Health slidedeck (PPTX)
- alt-text is attached to each figure.
Table of contents
- 10.0 Executive summary
- 10.1 Key messages
- 10.2 Background
- 10.3 Temperature
- 10.4 Extreme weather
- 10.5 Air quality
- 10.6 Tick and mosquito-borne diseases
- 10.7 Water Quality
- 10.8 Food security
- 10.9 Well-being, identity, and livelihoods
- 10.10 Cascading impacts
- 10.11 Climate & health multisolving
- 10.12 Traceable accounts
- 10.13 Resources
- 10.14 References
10.0 Executive summary
Global concern for climate change impacts on human health has grown in tandem with the acute experiences of Vermonters. This chapter contextualizes these experiences and synthesizes data to illuminate how impacts are distributed, often unequally, across Vermont. The final sections of this chapter focus on the many opportunities for synergistic solutions that can improve health and mitigate climate change simultaneously in a strategy called multisolving.
This chapter is most relevant for four groups:
- Public health officials, who are deeply familiar with these issues, may find value in a consolidated synthesis to support resource allocation and intervention planning.
- Municipal and regional officials may reference this information when communicating hazards and prioritizing resources.
- Clinicians may use this report to educate patients about climate change and their health and to inform patient care plans.
- Caregivers and families may draw on this chapter to better understand their own vulnerabilities and to support each other as these risks occur.
Climate change in Vermont is impacting human health in direct and indirect ways, many of which are overlapping, compounding, and co-occurring:
- Rising temperatures and more frequent extreme heat days pose a challenge in a state where indoor cooling systems are not prevalent. This warming is linked with increased emergency department visits, highlighting the need for early summer acclimatization and the importance of checking in on family and neighbors.
- Water quality risks may increase due to increased temperatures that support the growth of cyanobacteria and more precipitation extremes. Flooding also displaces Vermonters and their businesses, disrupts health care access and emergency response, and causes other health risks like mold growth.
- Decreased air quality from wildfire smoke and longer pollen seasons are threatening health in a state where 11% of adults and 7% of children already have asthma.
- Diseases from ticks and mosquitoes are increasing as changing temperatures lengthen their active season. Rates of Lyme disease increased by about four times between 2008–2024, highlighting the serious and growing health risks of these vector-borne diseases.
- Vermonters’ mental health, well-being, and sense of identity have been impacted as they survive disasters, change habits to avoid environmental exposures, and confront changing seasons that endanger their livelihoods and culture.
These impacts are not evenly felt by all Vermonters. Some are more vulnerable due to physiological conditions, while others are “vulnerabilized” by systemic processes outside of their control.
Health resilience is community resilience. Initial health impacts have ripple effects that often are not considered, like the long-term ability to secure stable housing, economic stress and educational deficiencies from lost work and school days, and strain on public resources, including health care. In Vermont, opportunities to combat these ripple effects include investing in climate-resilient housing and schools, expanding health care access, providing support for health care professionals, investing in social support networks, integrating climate justice into all planning, and improving tracking of long-term health data.
Human health is reliant on Vermont’s social connections, built infrastructure and natural ecosystems. Other chapters in the Vermont Climate Assessment highlight these intersections:
- Food security in Vermont is a health risk likely to be exacerbated by climate change, and the Agriculture and Food Systems chapter has more information about the supply chain components of that threat.
- The Community Development chapter provides foundational demographic and developmental data to support identification of vulnerable groups. It discusses emergency management systems and the importance of community cohesion.
- Outdoor activities are a key part of Vermonters’ health and identity but are threatened due to climate change, which is explained in the Outdoor Recreation and Tourism chapter.
- Specific information on the geophysical aspects behind health trends from flooding and water quality can be found in the Water Resources chapter.
- A key piece of climate and health multisolving is strategic investment in infrastructure, discussed in detail in the chapter of the same name.
While Vermonters are already experiencing health impacts caused by climate change, they also have the passion and dedication to confront these threats head-on. Actions need to prioritize those most impacted and simultaneously contribute to both mitigating climate change and supporting healthy Vermonters.
10.1 Key messages
- Actions to mitigate climate change, such as biking to work, weatherizing homes, or supporting the expansion of green spaces, have direct health benefits, from increased cardiovascular and respiratory health to improved mental health.
- Increasing heat waves and limited access to air conditioning are already affecting health and safety, particularly for older adults, outdoor workers, and those in urban areas.
- Vermonters’ physical health, housing status, and livelihoods are at increased risk due to more frequent and more intense flooding.
- In a state with the 5th highest rate of adult asthma in the country, intensifying wildfire smoke, pollen, and mold are exacerbating the existing respiratory disease of many Vermonters while creating new health concerns for others.
- The active seasons for ticks and mosquitoes are lengthening in Vermont, leading to increased diversity and prevalence of vector-borne diseases. Rates of Lyme disease increased by about four times between 2008–2024, highlighting the serious and growing health risks of these vector-borne diseases.
- Threats to water quality are being shaped by climate change, as floods spread contaminants, heat amplifies pathogen and cyanobacteria growth, and drought concentrates pollutants. These hazards are especially notable for the about 39% of Vermonters who are private well-users.
- In addition to affecting Vermonters’ physical health, climate change is eroding mental health, well-being, and the sense of identity and belonging that comes from place, seasons, and shared traditions.
- Climate change is acting as a “threat amplifier,” deepening existing inequities and placing disproportionate health burdens on Vermonters that are already vulnerable. The direct health impacts of climate change create ripple effects that impact children’s education, increase the burden on Vermont’s health care system, and create new threats to Vermont’s economy.
10.2 Background
Vermont has repeatedly confronted environmental risks to public health with proactive and innovative policymaking. In 2015, Vermont passed the Vermont Clean Water Act, which aims to protect drinking water, prevent harmful algal blooms (HABs), and enhance cooperative efforts to reduce nutrient pollution to Lake Champlain (Vermont Clean Water Act, 2015). In 2022, Vermont passed its first Environmental Justice Law, formally acknowledging that environmental burdens are not shared equally and committing the state to reducing disparities in access to clean air, water, housing, and green space (Vermont Environmental Justice Law, 2022). In 2024, Vermont passed both the Climate Superfund Act, which seeks to hold major fossil fuel companies financially responsible for climate-related damages such as infrastructure loss from flooding and the Flood Safety Act, which places flood resilience as a top priority across the state (Climate Superfund Act, 2024; Flood Safety Act, 2024). This legislation reflects a growing recognition that climate change is a public health issue, affecting physical health, mental health, and community well-being.
These examples illustrate a consistent Vermont pattern: when environmental conditions threaten health, Vermonters organize, legislate, and act. Climate change represents the latest, and most complex, chapter in this history. Understanding and quantifying its impacts in Vermont provides the foundation for the next generation of solutions. Just as earlier environmental challenges prompted innovative and health-protective action, today’s climate risks create opportunity for implementing practices that synergistically improve human and environmental well-being. These will be discussed in detail in the final section of this chapter (10.11).
This chapter synthesizes and contextualizes the impacts of climate change on human health in Vermont. Health effects of climate change are well-established globally (Romanello et al., 2025), but understanding how they manifest locally—in Vermont’s towns, workplaces, schools, and health systems—is essential for taking meaningful action at state, municipal, and individual levels.
In this chapter, health concerns are described using the following framework: identifying the hazard, health effects, exposure, and vulnerabilities, whereby hazard is the agent or pathogen that causes disease, exposure is how an individual comes in contact with the hazard, and vulnerabilities include both factors that increase exposure (e.g., occupation) and an individual’s adaptive capacity to respond to the hazard physically or socially (e.g., owning a vehicle). There is a “What you can do” section for each health concern, which identifies individual protective behaviors and broader community-level actions to reduce climate change-related health risks. While this chapter does not include recommendations for health care providers specifically, it is important to note that they play an essential role in treating climate-related health outcomes and counseling patients. In fact, primary care physicians are among the most trusted sources of information about climate change and related health risks (Hill, 2021; Maibach et al., 2015). Given the breadth of topics covered in this chapter, key hazards, vulnerable populations, and actionable steps are summarized for ease of reference (Table 10-1).
| Hazard | Vulnerable populations | What you can do |
|---|---|---|
| Extreme heat | Outdoor workers and recreators, outdoor summer athletes, children, elderly, people without air conditioning or access to cool indoor air, especially unhoused populations | Check on neighbors, especially those with limited mobility. Limit activity to cooler parts of the day. Stay hydrated. |
| Warmer winters | Those exposed to ice either on sidewalks/driveways, especially elderly, or recreational users of frozen ponds and lakes | Shovel walkways and driveways and use salt or sand to melt ice or provide traction. On frozen lakes, test ice before use, and share plans with friends or family. |
| Flooding | People living in flood zones, especially in mobile homes, unhoused populations, those with limited mobility | Create a flood action plan and check-in on neighbors, consult Vermont Department of Health (VDH) guidelines for safely returning to homes after flooding. |
| Wildfire smoke | Outdoor workers and recreators, children, elderly, people with chronic respiratory diseases | Monitor air quality (AirNow.gov is a good source), decrease activity levels, stay inside with windows closed if weather allows, utilize air filters indoors. |
| Pollen | People allergic to pollen, especially those that cannot minimize exposure by staying inside (e.g., outdoor workers, recreators) | Work with medical professionals to proactively create a pollen care plan, minimize exposure by staying indoors, protect airways by wearing a mask when outside. |
| Mold | Flood damaged homes, especially when remediation is complicated by extreme outdoor heat or poor air quality | Prevent mold growth by fixing leaks in homes, improving drainage, and using dehumidifiers. After a flood, clean and dry items and rooms within 48 hours. Consult VDH for more guidelines. |
| Tick-borne diseases | Outdoor workers and recreators, age (various effects by disease), males, location (some counties in Vermont, especially southern Vermont, have higher disease prevalences), people with reduced immune function | Wear long sleeves and pants, use tick repellant, and check for ticks after recreating. |
| Mosquito-borne diseases | Outdoor workers and recreators, people with reduced immune function, males, people with diabetes or hypertension | Wear long sleeves and pants, use insect repellant, and reduce standing water. |
| Nitrates/nitrites | Infants | Test private wells and support farmers in conservation practices that protect water quality. |
Increased mercury bioavailability | Children, pregnant/nursing people | Follow VDH’s safe fish consumption guidelines. |
Cyanobacteria | Children and infants | Check for beach closures before recreating and know how to identify a bloom, participate in cyanobacteria monitoring efforts, and reduce runoff using green stormwater infrastructure. |
Waterborne pathogens | People with reduced immune function | Check for beach closures before recreating, reduce runoff using green stormwater infrastructure, and test private wells. |
Food security | People currently experiencing food insecurity, households with low-income, and people living in rural areas | Advocate for food security screenings by physicians and support food access programming. |
Foodborne pathogens | Pregnant people, people with reduced immune function. Different drivers of foodborne disease affect different demographics | Learn proper food safety practices. |
Source: This chapter
Box 10-1: What does “vulnerable” mean? Using inclusive and actionable language in climate change and public health literature
The term “vulnerable” in public health literature can be misconstrued to assign an inherent and internal status to people who are at higher risk of experiencing negative health effects, rather than focusing on actionable changes required of systemic and societal structures to support equitable health outcomes (Vital Strategies, 2026). The term’s vagueness can also conceal structural aspects of these challenges (Katz et al., 2020).
One proposed alternative is using “vulnerabilized” to signify a status that results from systemic factors beyond the control of the individual/ population (Garrett & Altman, 2024).
Alternatives for “high-risk population” and “vulnerable population” include: “People who are at increased risk for [condition],” and “People who live/work in a setting that puts them at increased/higher risk of becoming exposed to hazards” (U.S. Centers for Disease Control and Prevention, 2024h). This “person-first” language better describes one component of a person’s experience, versus attributing their identity to that experience (National Institutes of Health, 2025).
This chapter uses “vulnerabilities” as a subsection header to give detailed, person-first explanations of the physiological factors and societal factors that contribute to increased risk of impact from climate change–related hazards. In the Vermont Climate Assessment, the Intergovernmental Panel on Climate Change (IPCC), the most recent Lancet report on health and climate change (Romanello et al., 2025), and numerous other contemporary reports, “vulnerable,” is defined as “the propensity or predisposition to be adversely affected. Vulnerability encompasses a variety of concepts and elements including sensitivity or susceptibility to harm and lack of capacity to cope and adapt.”
The authors emphasize that use of the adjective “vulnerable” without a description of the contributing factors to that status can be detrimental to creating equitable health interventions.
10.3 Temperature
What do rising global temperatures mean for daily life at the local and state level? In Vermont, a warming trend is felt in every season. Summers are longer and hotter, while winters are shorter and milder (see Climate Change in Vermont 2.4). These changes have serious consequences for the health and well-being of Vermonters.
10.3.1 Increased summer temperatures
Hazards
The northeastern United States (U.S.) is warming faster than most of the rest of the planet (see Climate Change in Vermont 2.4.1). This warming is felt tangibly in the form of rising daily temperatures, more days with extreme heat, and more hot nights (see Climate Change in Vermont 2.4.4). For example, Burlington, VT experienced as many heat waves (three or more consecutive days above 90°F [32.2°C]) in the past six years as in the previous 18 years, which indicates a tripling of heat waves over the past 24 years (National Weather Service, 2025a). These warming trends compound health hazards for Vermonters.
Health risks of heat in Vermont are affected by more than just temperature. Temperature combines with humidity to create a “heat index,” or perceived temperature (Figure 10‑1). High humidity causes hot temperatures to feel even hotter to humans. For example, when the relative humidity is 60%, a 90°F (32.2°C) day actually feels like 100°F (37.8°C). In Vermont, the maximum humidity in summer months, which typically occurs in the overnight hours, has ranged from 88% to 98% over the past 20 years (see Climate Change in Vermont 2.4.4). Additionally, when factoring air moisture and temperature together, Vermont’s absolute humidity has increased significantly since 1960 by a total of 12%, or 1.1 gm-³ each decade (see Climate Change in Vermont 2.4.4). In high humidity, the air is already saturated with water so sweat is unable to evaporate off skin, reducing the effectiveness of one of the body’s primary cooling mechanisms.
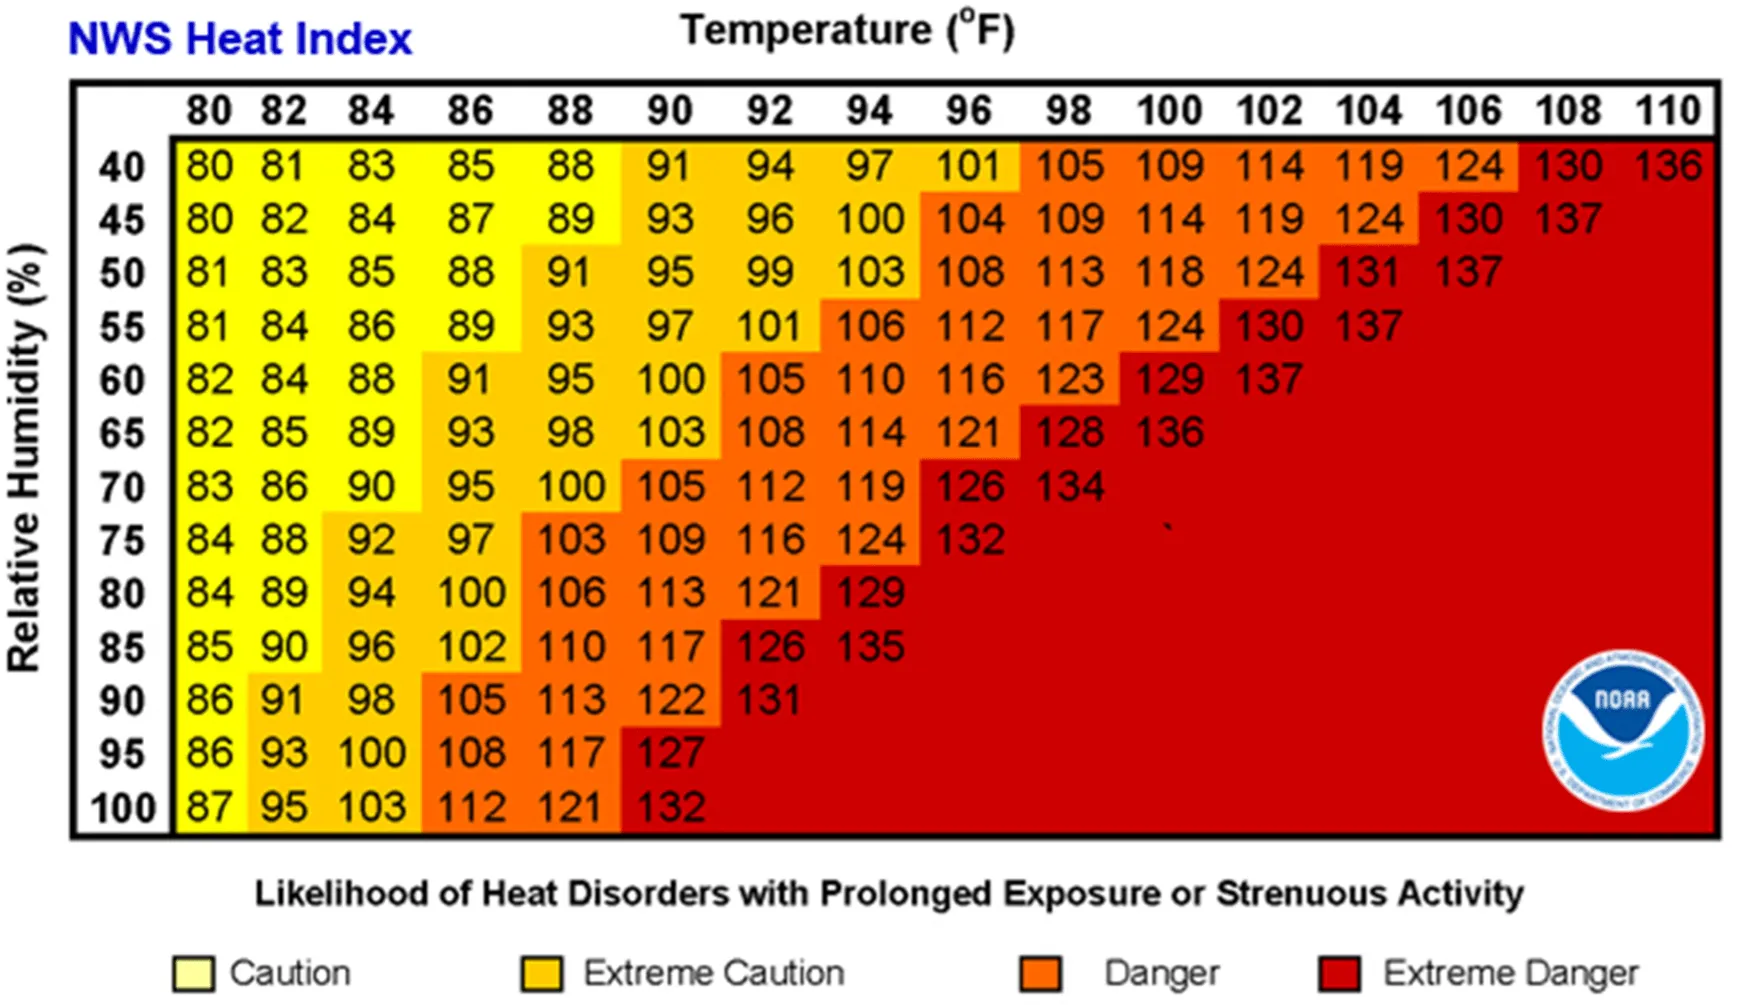
Source: National Weather Service (2025c)
Health effects
Extreme heat is known to negatively impact human health in several ways, including headaches, dehydration, fainting, exacerbation of existing cardiovascular and respiratory conditions, hospitalization, decreased mental health, adverse pregnancy outcomes, heat exhaustion, heat stroke, and death (Ebi et al., 2021). It is associated with increases in emergency department (ED) visits globally (Cheng et al., 2019; Sun et al., 2021). Years with more excessive heat days (days with a maximum heat index above the 95th percentile of summer daily maxima for 1991–2020) send more Vermonters to the ED with heat-related illness. Both excessive heat days and heat-related ED visits have increased steadily from 2003–2022 (Figure 10-2).
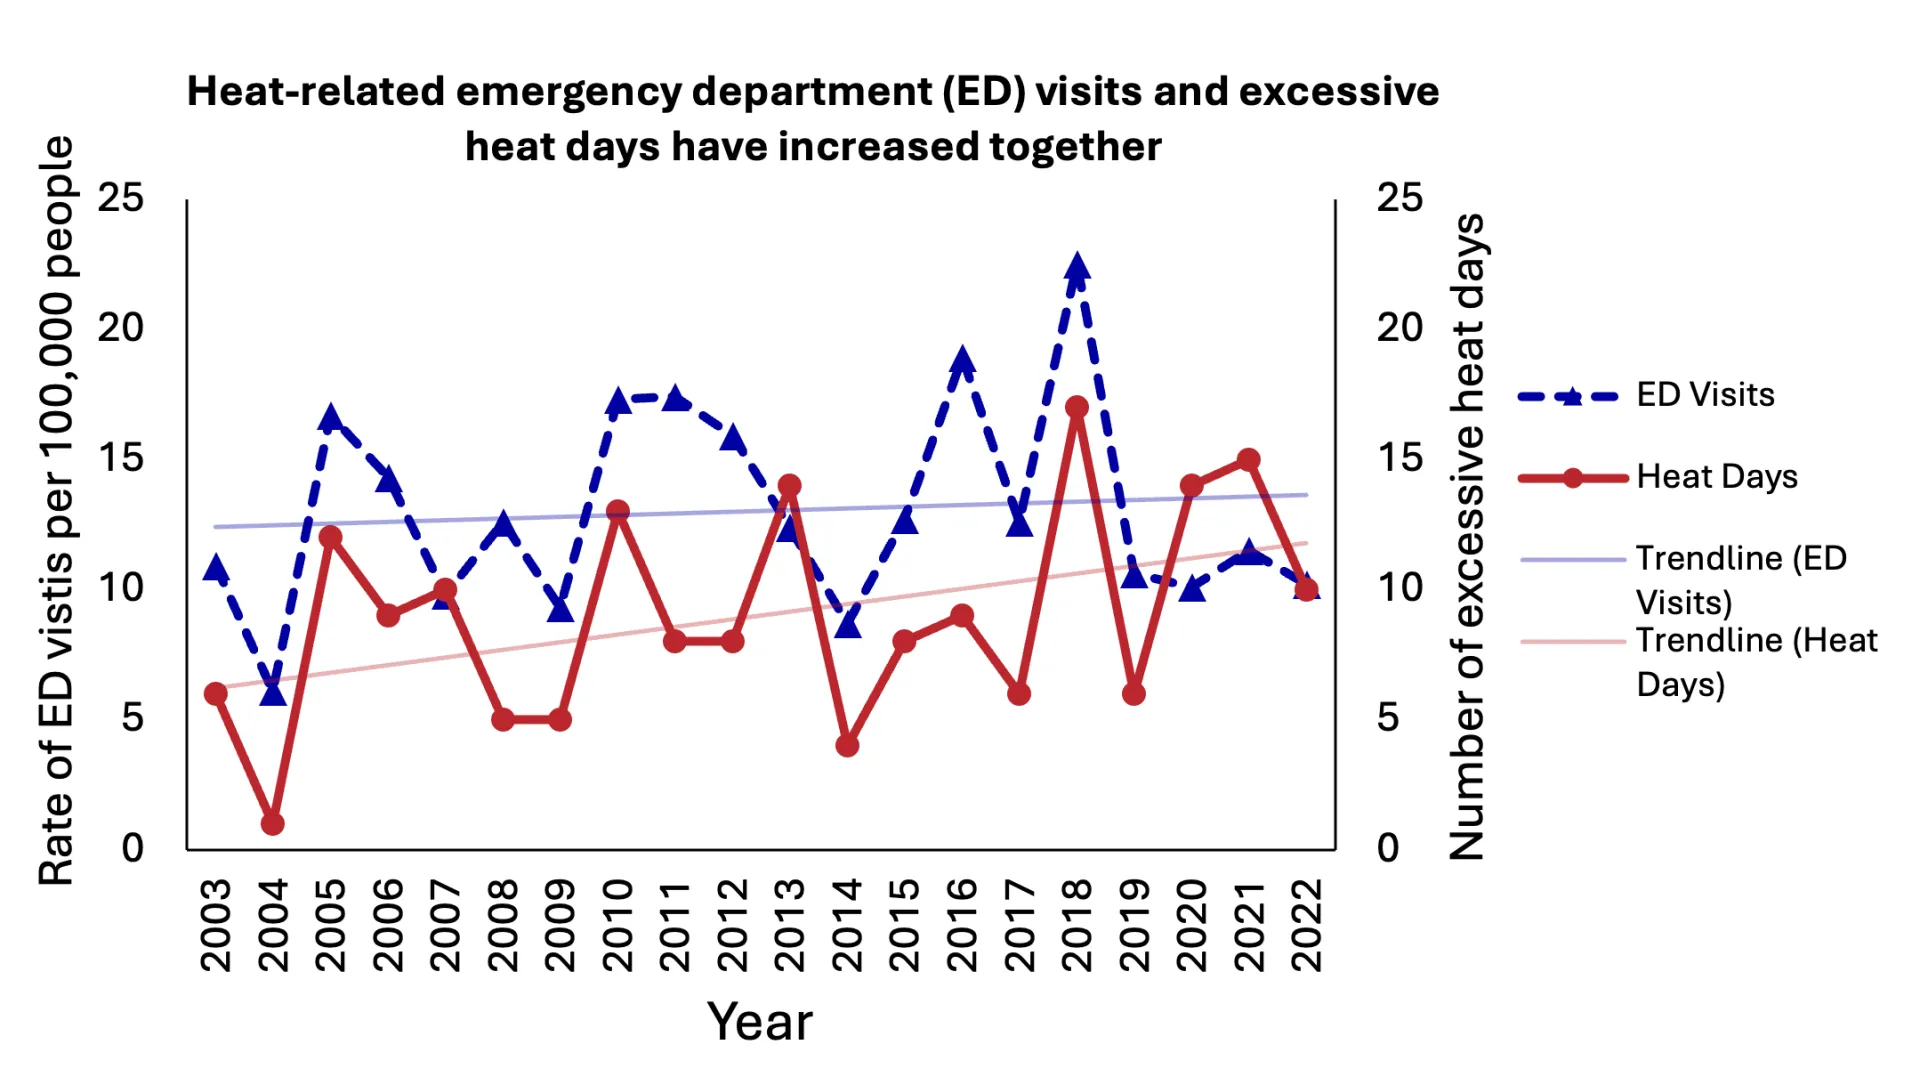
Source: Vermont Department of Health (2026f)
Exposure
Compared to warmer climates in the U.S., Vermonters begin to experience heat impacts at lower temperatures (Kovats & Hajat, 2008). This is partly because their bodies are not as acclimated to hot weather, and partly because they are less familiar with heat mitigating practices and lack heat mitigating infrastructure. The inability to acclimate quickly to warmer temperatures also contributes to higher risk of health impacts. Several factors outside of the day-of temperature have been linked to increased health care utilization in Vermont, such as the time of year that the extreme heat day occurs, and the heat index of the prior day (Figure 10-3).
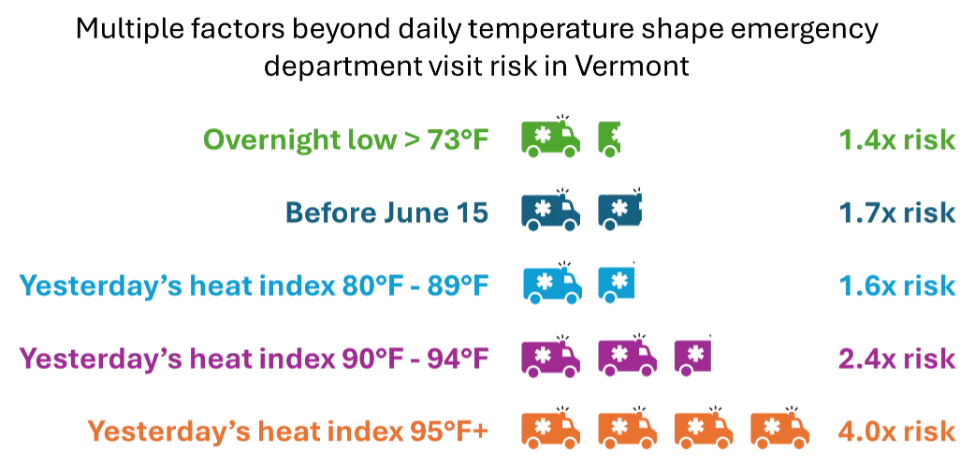
Source: Vermont Department of Health (2023)
Note: Factors such as overnight temperature, time of year, and heat index of the prior day contribute to increased risk of all-cause emergency room visits in Vermont. Comparison groups: overnight low greater than 73°F compared to less than 73°F; before June 15 compared to after June 15; all prior day heat index categories compared to heat index less than 80°F. Data collected 2009-2019.
Housing and urban infrastructure can increase exposure to higher summer temperatures. Urbanized or built-up areas in Vermont have characteristics, like more paved areas and less tree cover, that can cause local temperatures to be higher than surrounding areas. This phenomenon is known as the urban heat island effect. These impacts are not limited to large cities; small towns with similar impermeable infrastructure (e.g., paved surfaces, roofs) also experience this effect (Doran et al., 2023). Vermont housing is not well prepared for warmer temperatures, with only 67% of housing units in Vermont equipped with some type of air conditioning; just 7% have central air conditioning (U.S. Energy Information Administration, 2023).
Vulnerability
Some people are at higher risk of experiencing heat-related health impacts, such as due to their day-to-day environment (e.g., place of work, housing) and their individual characteristics (e.g., age, underlying health). At heightened risk are the elderly, young children, people with cardiopulmonary and other chronic diseases, people with disabilities, outdoor workers, people living in mobile homes, low-income and unhoused populations (Crimmins et al., 2023; Ebi et al., 2021). Individuals younger than 5 years of age and older than 65 years of age are especially at risk during heat events. Older adults have physiological changes that decrease their ability to regulate temperature and dissipate heat, such as decreased heart function and decreased sweat response. Further, elderly populations may rely on medications with side effects that also decrease their body’s ability to dissipate heat. Other conditions, such as mental illness or immobility can make it harder for people to both make decisions and take protective action when faced with heat threats (Worfolk, 2000).
Outdoor workers are at increased risk of heat impacts, including 14,580 people employed in farming, fishing, forestry, construction and extraction occupations in Vermont (U.S. Bureau of Labor Statistics, 2023), plus 8,331 hired agriculture workers on Vermont farms (U.S Department of Agriculture, 2024). These workers rely on supervisors and work policies for heat protection, such as the provision of more frequent breaks, access to shade or cooling facilities, hydration, and options for alternate schedules that avoid working during the hottest hours of the day.
Generally, Vermonters in the northeastern and southwestern corners of the state are most vulnerable to experiencing heat-related health impacts (Figure 10-4) based on VDH analysis of 17 factors related to heat illness vulnerability, including age, socioeconomic characteristics, health conditions, environmental characteristics, climate characteristics, and observed heat illness (Vermont Department of Health, 2016). These locations of concern are highlighted when population-level vulnerabilities are considered. Appropriate heat-mitigating interventions will therefore be different from town to town in Vermont.
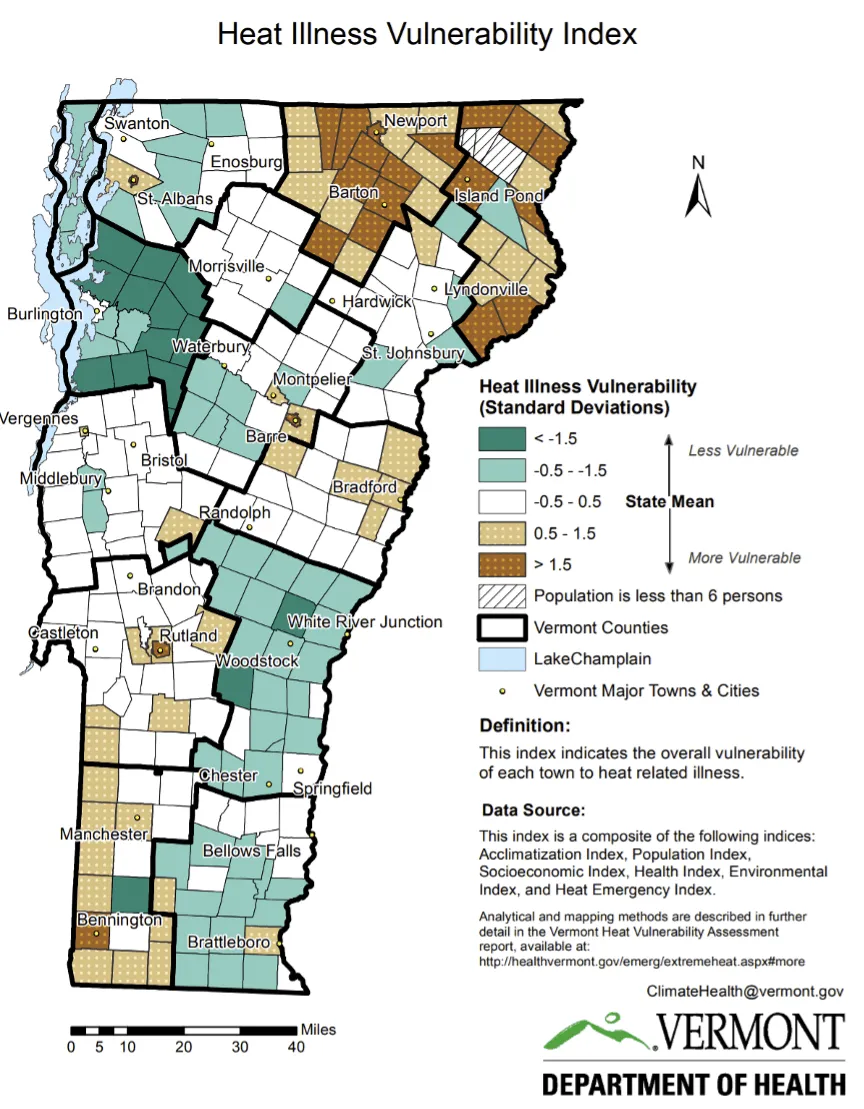
Source: Vermont Department of Health (2016)
Box 10-2: Children and health impacts of climate change
Children are especially vulnerable to health impacts of climate change. Children’s organs and thermoregulatory systems are not fully developed, making it inherently more difficult for their bodies to prevent overheating during hot days (Smith, 2019). They may lack knowledge, capacity, and autonomy in making decisions to put themselves in safer places when it is hot outside (e.g., go indoors, shade). Child deaths from overheating in cars are a tragic and preventable example (Dowd, 2018). Vermont has recorded only one child hot-car fatality since 1990, which occurred in 2024, but continued vigilance is warranted as Vermonters face rising temperatures (Kids and Car Safety, 2024). Children will experience more extreme heat days over their lifetime than previous generations, compounding these effects (Thiery et al., 2021). Vermont schools may enact policies and invest in infrastructure to protect children from the health risks of climate change, and many are already doing so (see What you can do).
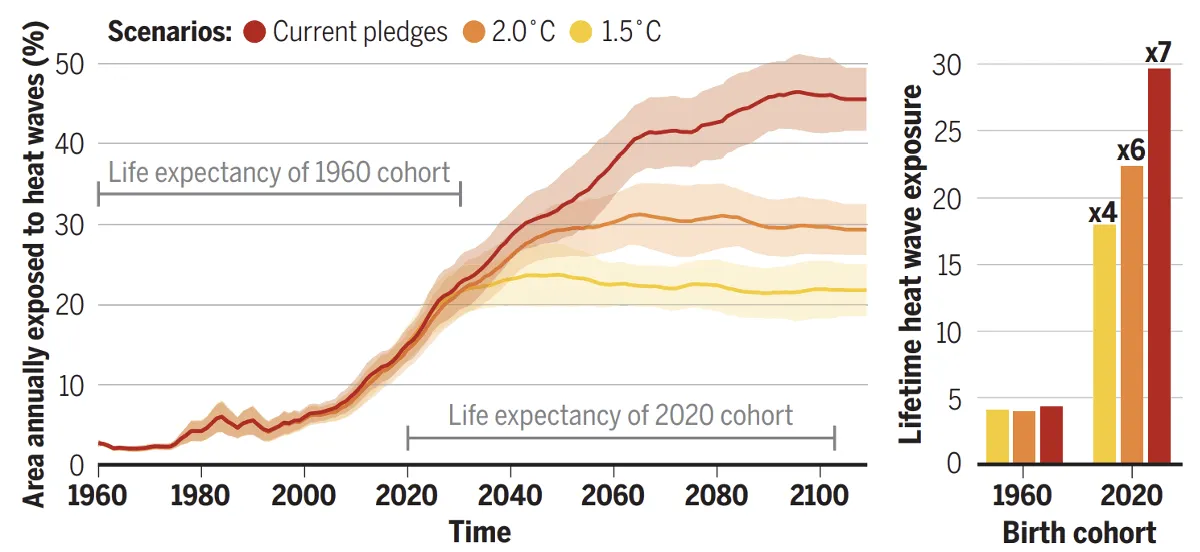
LEFT: Percent of global land area annually exposed to heat waves. Lines are multimodal means of a heat wave index from four global climate models, with uncertainty bands of one standard deviation; RIGHT: Multiplication factors relative to the 1960 birth cohort for lifetime heat wave exposure
Source: Thiery et al. (2021)
10.3.2 Warmer winters
Average winter temperatures are warming (see Climate Change in Vermont 2.4.3), which can have complex impacts on the health of people in Vermont. For the many Vermonters who enjoy winter ice recreation—such as ice hockey, outdoor ice skating, and ice fishing—warmer winters can increase the risk of unsafe ice conditions. Warmer winters may contribute to decreased incidences of some cold weather-related illnesses, such as frostbite and hypothermia if cold weather exposure decreases. Research has shown no clear link between changing winter temperature ranges and lowered winter mortality rates (Kinney et al., 2015), which could be because deaths in the winter are not primarily driven by cold weather.
Hazards
Warmer winters can cause hazardous changes to ice formation. For example, ice over lakes and streams may not freeze as consistently, may not be as thick as previously experienced, and may melt more rapidly. Ice fishing, pond hockey, and Nordic skating are beloved hobbies, sports, and seasonal occupations for many Vermonters (see Outdoor Recreation and Tourism 9.3.1), and changing ice conditions present risks such as weaker ice, limited cover, or less winter activities (e.g., more sedentary activities). Some risks increase, such as the persistence and unpredictability of road and sidewalk ice or ice falling from buildings. Warm winters may result in more freeze-thaw cycles, or “zero-crossing days,” when temperatures fluctuate around freezing (32°F, 0°C). These zero-crossing days melt snow and ice, which create hazards on roads, sidewalks, driveways, and buildings.
Health effects
Rapid loss of body heat can occur if someone falls through ice, compounded by life-threatening bodily responses. For example, involuntary, but natural, reactions to cold water immersion include gasping for air, breathing irregularly, and hyperventilation, all of which can cause water inhalation and increased chance of drowning. Sudden spikes in heart rate and blood pressure as well as cognitive impairment due to panic, fear, or stress can also occur. Extended cold water exposure can continue to deteriorate cognition and make it difficult to take injury preventing or life-saving actions (National Weather Service, 2025b). Cold exposure is associated with hypothermia. Signs of hypothermia include shivering, exhaustion, confusion, memory loss, and drowsiness (U.S. Centers for Disease Control and Prevention, 2024a).
Deaths due to ice breakthroughs in Vermont are infrequent but often occur around weather-related changes in ice conditions. In 2023, a polar vortex occurred, dropping average daily temperatures to below 0°F (-17°C) on February 3-4 in Vermont. Days later, temperatures warmed significantly, hovering just above and below freezing (NOAA National Centers for Environmental Information, 2023; Weather Underground, 2023). On February 9th, a man died after breaking through ice on Lake Champlain while fishing; two days later, two more men died when their vehicle broke through Lake Champlain’s ice (Archie, 2023). In February of 2024, a vehicle carrying a family of four broke through ice on Lake Memphremagog, leaving a 3-year-old in critical condition. Newport Police Chief T. Bingham described the uneven ice conditions:
There’s about 13 inches of ice in spots on the lake. The spot where the side-by-side went through was actually about an inch and a half thick. So, it just kind of shows the various depths on the lake right now with the weather and winter that we have had. The ice conditions are not great.” (Morgan & Goodrich, 2024).
The presence of unpredictable road and sidewalk ice can increase slip-and-fall incidents and car accidents. In Scandinavia, there is a well-studied link between increased number of zero-crossing days and increased numbers of inpatient and outpatient visits due to ice and snow related falls and transport accidents (cars and bikes; Maclachlan et al., 2025).
Health data in Vermont shows the complexity of milder winters and cold-weather illnesses. VDH cautions, “Even during warmer than average winters, people in Vermont are still at risk for cold-related illness” (2024b). The number of cold-weather-related emergency room visits (e.g., hypothermia, frostbite, other cold-exposure symptoms) has increased over the past 20 years (Figure 10-5). For example, the 2023–2024 winter season was warm relative to the prior five year average, but the number of cold-weather related emergency room visits was greater than average (Vermont Department of Health, 2024b). Exposure to cold could be increasing as people venture out on relatively warm days unprepared for winter or for those chronically exposed. The recent and rapid increase in the number of people living without housing in Vermont is conservatively estimated at 3,386 people in 2025—a 200% increase over pre-COVID levels (Housing & Homelessness Alliance of Vermont, 2025).
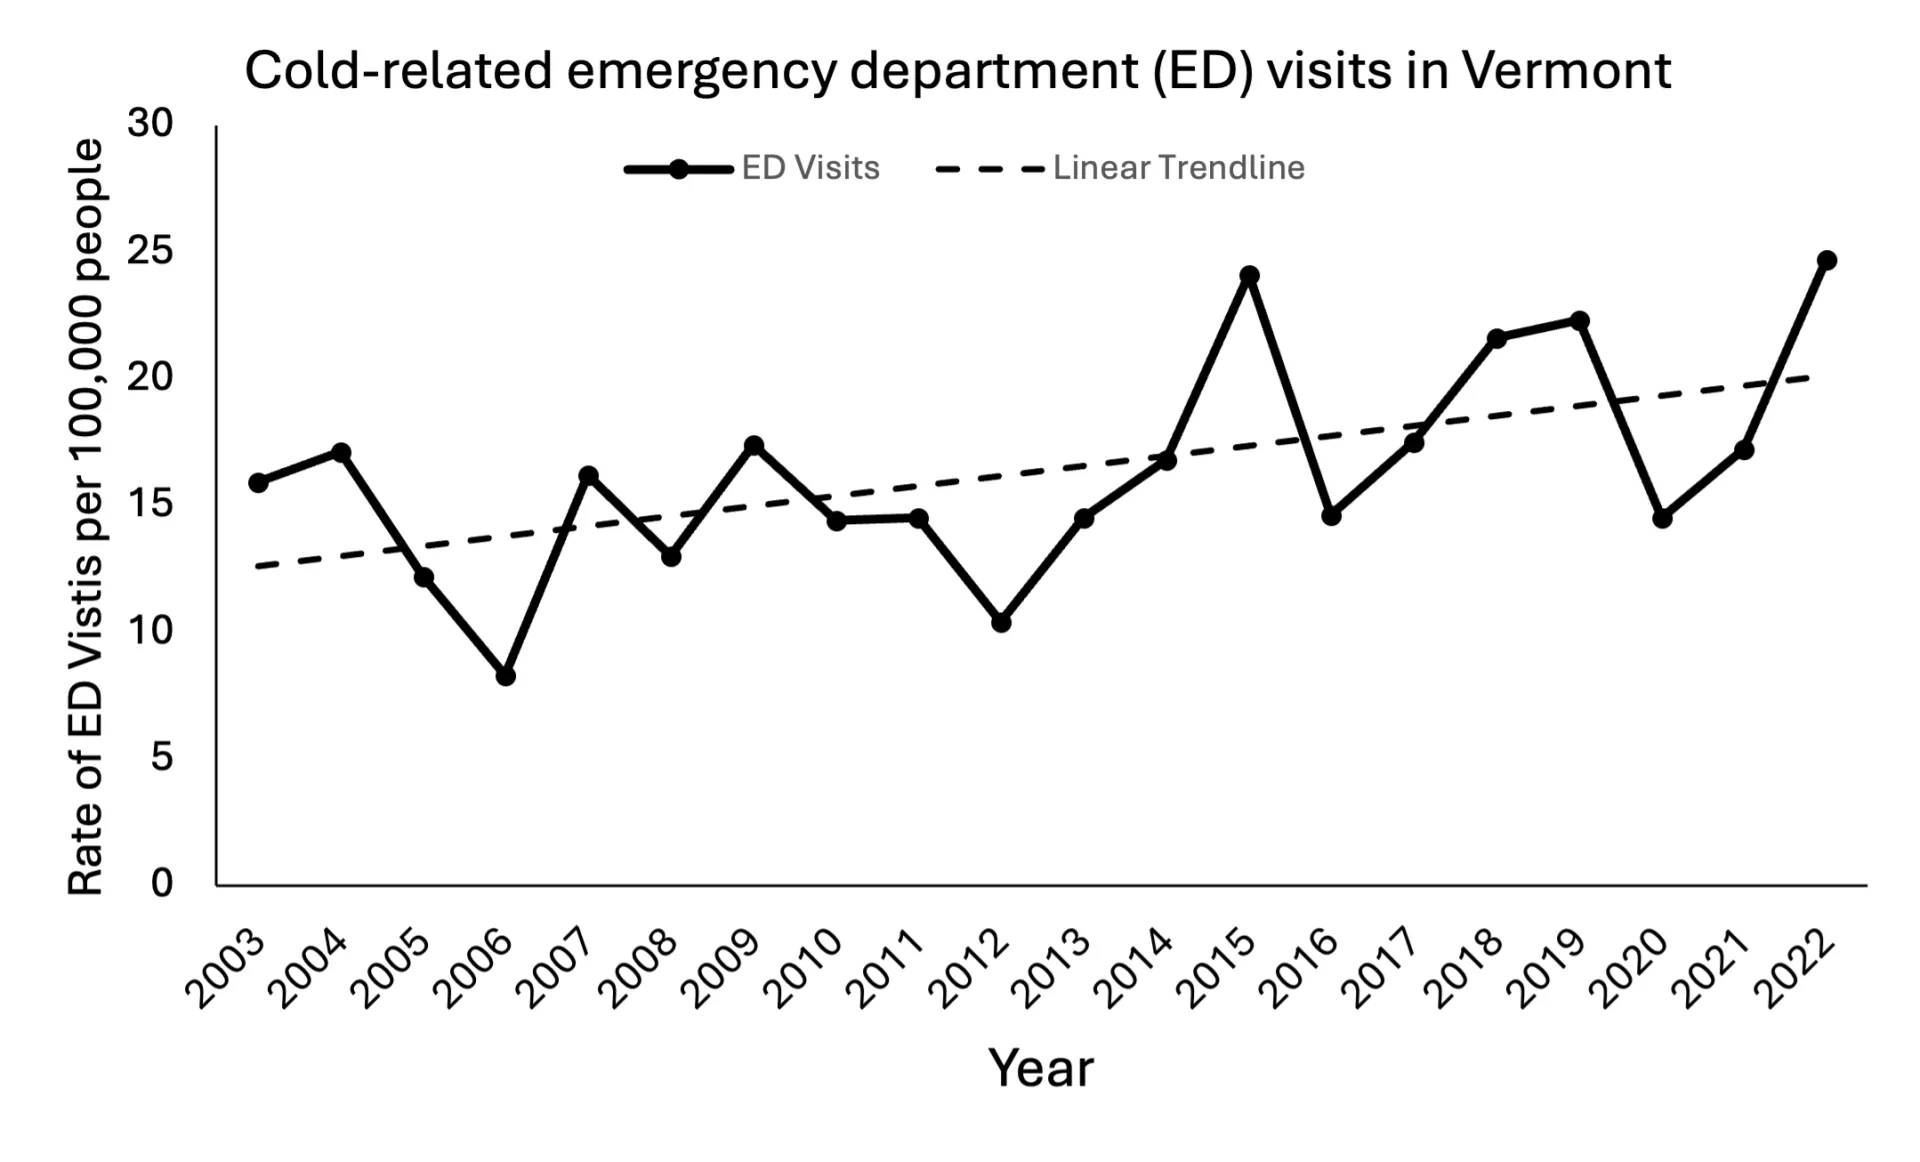
Source: Vermont Department of Health, (2026f)
Exposure
Ice-breakthroughs can occur any time ice is thin. This often occurs early or late in the ice season or when there’s be a rapid thaw. Falls or accidents on ice can occur many places that people would encounter on a day-to-day basis, including personal driveways and walkways, public sidewalks and parking lots, and roadways. The ice may persist for longer periods of time as winter temperatures oscillate.
Vulnerability
Vermonters that rely on visual cues or prior experience in familiar areas for decision-making around ice activities may be more vulnerable to ice breakthroughs from climate change because of increased ice variability and non-uniform freezing and thawing. Visitors to Vermont, who may be unfamiliar with ice safety practices or local conditions, could also be more vulnerable to breakthroughs.
Within those at greater exposure to health risks due to uneven or thin ice (e.g., those who ice fish or ice skate), children, elderly populations, and people with disabilities or mobility limitations are more vulnerable to serious injury or death as a result of an ice breakthrough. These groups may be less able to self-rescue after falling through. Severe outcomes after ice breakthroughs may also be more likely in rural and remote areas, due to the contrast between rapid onset of life-threatening symptoms and longer emergency response times.
Older adults are at elevated risk of winter ice slip-and-fall events (Maclachlan et al., 2025). At higher risk to winter slip-and-fall accidents are also those that rely on walking or public transit, people with mobility limitations, and outdoor workers.
10.3.3 What you can do
Increased summer temperatures
Existing adaptations to extreme heat largely involve creating climate-controlled indoor spaces, which include installing air conditioning in homes and schools (U.S. Environmental Protection Agency, 2016a) and opening public cooling centers on hot days (Hondula et al., 2024). However, these solutions risk creating a positive feedback loop. They contribute to a growing electricity load that could contribute to more greenhouse gas (GHG) emissions and continued climate change (Lundgren-Kownacki et al., 2018), and as air conditioning cools indoors, these systems eject heat to the outside. Fortunately, there are effective and efficient options for climate-controlled indoor spaces. Heat pumps can provide more energy-efficient cooling, and home weatherization can reduce indoor temperatures and air conditioning demand (see 10.11.5).
VDH offers several recommendations for staying cool and safe at an individual level. Taking time to acclimate properly at the beginning of the summer can help. This means gradually (over the course of 1–2 weeks) increasing intense activity in hot weather before engaging in high activity levels on a hot day. People should try to stay cool (e.g., stay in shade or air conditioning, wear lightweight clothing, avoid hot meals and hot drinks), stay hydrated, stay informed about heat by following local weather or signing up for weather alerts, and listen to their body if they feel faint or weak (Vermont Department of Health, 2025v). VDH also maintains a website with a dashboard of cooling locations, including indoor spaces and swimming opportunities (see 10.13.1).
There are options to reduce risks at a community level, such as increased social connection and reduced isolation that are associated with reduced heat-mortality, especially for older populations (Orlando et al., 2021). Interventions to reduce social isolation can significantly limit excess deaths during heat waves (Yardley et al., 2011). These actions can be as simple as checking in on family, friends, and neighbors. VDH offers caregiver-specific guidance for keeping care recipients safe during periods of high heat (Vermont Department of Health, 2025). Risks to communities due to the urban heat island effect can be mitigated by collaboration between citizens, city planners and public works engineers to consider strategic tree plantings, and also the use of advanced novel materials (e.g., permeable concrete, novel aggregates) on roads and sidewalks and green stormwater infrastructure (Doran et al., 2025). Solutions should be tailored to the needs identified in individual Vermont communities.
Warmer winters
To stay safe on winter ice, the Vermont Fish and Wildlife Department recommends testing ice thickness with a spud bar or auger when traveling across ice, and avoiding flowing water, mouths of rivers or streams, and old ice holes or cracks (Vermont Fish & Wildlife Department, 2025). The Vermont Fish and Wildlife Department recommends 3.5-4 inches of clear ice for walking, 8 inches for driving a snowmobile or ATV, and that those thicknesses should be doubled if the ice is white or cloudy (Vermont Fish & Wildlife Department, 2025). Tell someone else about ice plans and anticipated return time before venturing out.
Strategically placed warning signs and hazard communications can increase awareness and encourage safe behaviors, while personal verbal communication is the most effective method for ensuring safe practices (Saunders et al., 2019). In Vermont, many community groups exist, like the Burlington Nordic Skating Club “Sk802 Burlington,” which share up-to-date information about ice conditions (Sk802 Burlington, 2025).
Individuals can mitigate risk from icy surfaces or falling ice, such as cautiously inspecting areas before walking or employing mircospikes on shoes to improve traction in snow and ice. Towns and individuals should use de-icing salt sparingly, as salt run-off is harmful to the health of rivers and lakes. Lake Champlain Sea Grant provides recommendations for decreasing use of de-icing salt, including shoveling first, using the minimal amount required, and sweeping up leftover salt for future use (Lake Champlain Sea Grant, 2025).
10.4 Extreme weather
Historically, Vermont’s extreme weather has been associated with winter snow and ice but, more recently, Vermonters have become increasingly familiar with drought and flooding.
10.4.1 Drought
In summer 2025, Vermont experienced its worst drought in 25 years (see Climate Change in Vermont 2.6.3 and Water Resources 4.3.2). Since that event occurred during the writing of this publication, little data on its health impacts are available. Clear evidence from other parts of the U.S. and globally shows that drought has many impacts on human health. Drought’s impacts on human health have numerous pathways, including decreased water quality (10.7), threats to food security (10.8), induction of stress and decreased mental health (10.9), decreased air quality(10.5), and changes in vector populations that impact disease (10.6; Figure 10-6).
The 2025 drought caused significant water shortages across the state (see Water Resources 4.3.2). Six public drinking water systems reported voluntary water conservation notices between September 18th and October 8th (Vermont Department of Environmental Conservation, 2026d). After August 22nd, well users reported 241 water shortages and 361 water outages.
Vermonters’ personal stories provide insight into drought impacts, like threats to livelihoods (see 10.9.2). Speaking during the drought, one small farm owner remarked,
I’m gonna drill a well… the estimate is $20,000, which was not in my budget, but I’m just so grateful that they can do whatever it is they’re doing to get me water in about a month, because otherwise, if I can't get a well drilled this fall, my options are find a place to board my animals, or I have to sell off the herd (Heilman, 2025).
Fishing guides, like the Fly Rod Shop in Stowe, reported that their business was affected when low water levels forced them to change trip plans (Finno & Oliver, 2025). The drought threatened health care infrastructure; in Berlin, a fire hose was rigged as a make-shift emergency water system when an elder care facility’s well dried up (Finno & Oliver, 2025).
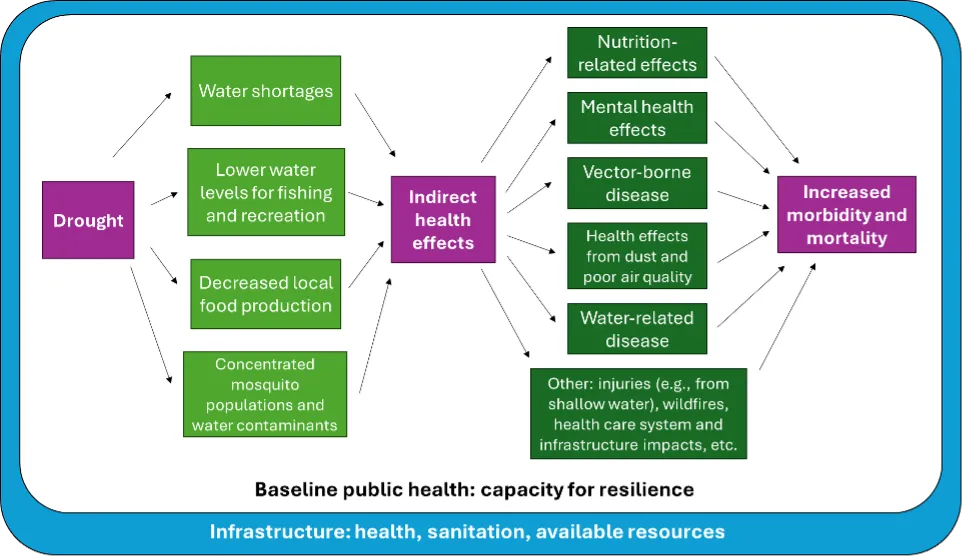
Source: Stanke et al. (2013)
10.4.2 Flooding
Climate change is increasing and intensifying severe weather events, resulting in elevated incidences of catastrophic flooding (see Climate Change in Vermont 2.6.2 and Water Resource 4.5). In 2023, Vermont experienced catastrophic flooding on the scale of what would have previously been a “100-year flood” from heavy rainfall. These floods—so-called because they were anticipated to occur once every 100 years—are now expected to occur much more frequently: every 1–30 years in the southeastern U.S. and Gulf of Mexico regions and annually in New England (Marsooli et al., 2019).
Hazards
Flooding from stormwater creates many hazards; of most immediate and direct concern is flowing water that damages roads and buildings. Flooding in Vermont has caused extensive road closures, including during Tropical Storm Irene (2011) and the summer 2023 floods. Many roads in Vermont remain at high risk of flooding today (see Infrastructure 7.3.1and 7.3.2). Secondarily, extreme storms can force the overflow and release of contaminated wastewater, carrying toxic pathogens into homes and the environment, and causes spillage and runoff of other chemical contaminants like oil, pesticides, and fertilizer (see 10.7). Dangers in the aftermath of a flood include growth of harmful mold, contamination of food crops, contamination of drinking water, and decreased air quality from contaminants disturbed both during the flood itself and during flood recovery. Standing water can create breeding ground for mosquitoes, which present an increasing risk of disease (see 10.6)
Exposures and health effects
Peoples exposure to flowing water during the rain event, during evacuation, and/or during rescue and clean-up efforts presents acute health risks to humans. Water may be flowing even if it does not appear to be from the surface. Three of the most common types of deaths are from drowning or trauma in floodwaters occur in i) vehicles, ii) homes, or iii) directly in water (National Weather Service, 2016). In Vermont, 4–7 people were killed in 2011 flooding (Keck, 2021; National Weather Service, 2016), two were killed in the 2023 summer floods (National Weather Service, 2024), and two were killed in the 2024 summer floods(National Weather Service, 2025d). Non-life-threatening physical harm such as cuts, bruises, and broken bones can be caused by debris in floodwaters and damaged infrastructure (Wu et al., 2024).
Flooding and heavy rains can increase indirect risk and health impacts. These include faster currents, debris, and unpredictable flow patterns to streams and swimming holes where many Vermonters recreate (see Water Resources 4.3.1 and 4.4). Road closures during or after flooding can prevent access to health care, pharmacies, and emergency vehicles. During the 2023 and 2024 summer floods, many Emergency Medical Service (EMS) teams were integral to identifying and reporting debris piles that needed to be removed in order to unblock roadways (Vermont Disaster Recovery, 2025). Health concerns, such as existing chronic diseases which require medication or treatment at a health care facility, may be exacerbated or cause further harm if access to care is blocked. After flooding has subsided, mold can grow in damp areas in less than 48 hours (U.S. Centers for Disease Control and Prevention, 2024d), presenting a major health risk, potentially impacting respiratory, cardiovascular, and neurological health (see 10.5.3)
Many Vermonters have been displaced due to damaged or destroyed homes, businesses and other buildings. Vermont Emergency Management (VEM) used the 211 call line to monitor damages from the July 2023 and 2024 flood events with over 400 residences reporting need for shelter due to those floods (Vermont Emergency Management, 2023). More reported that their home was uninhabitable (Figure 10-7). Many businesses reported being inoperable following the 2023 and 2024 flood events via the 211-call line (Figure 10-8).
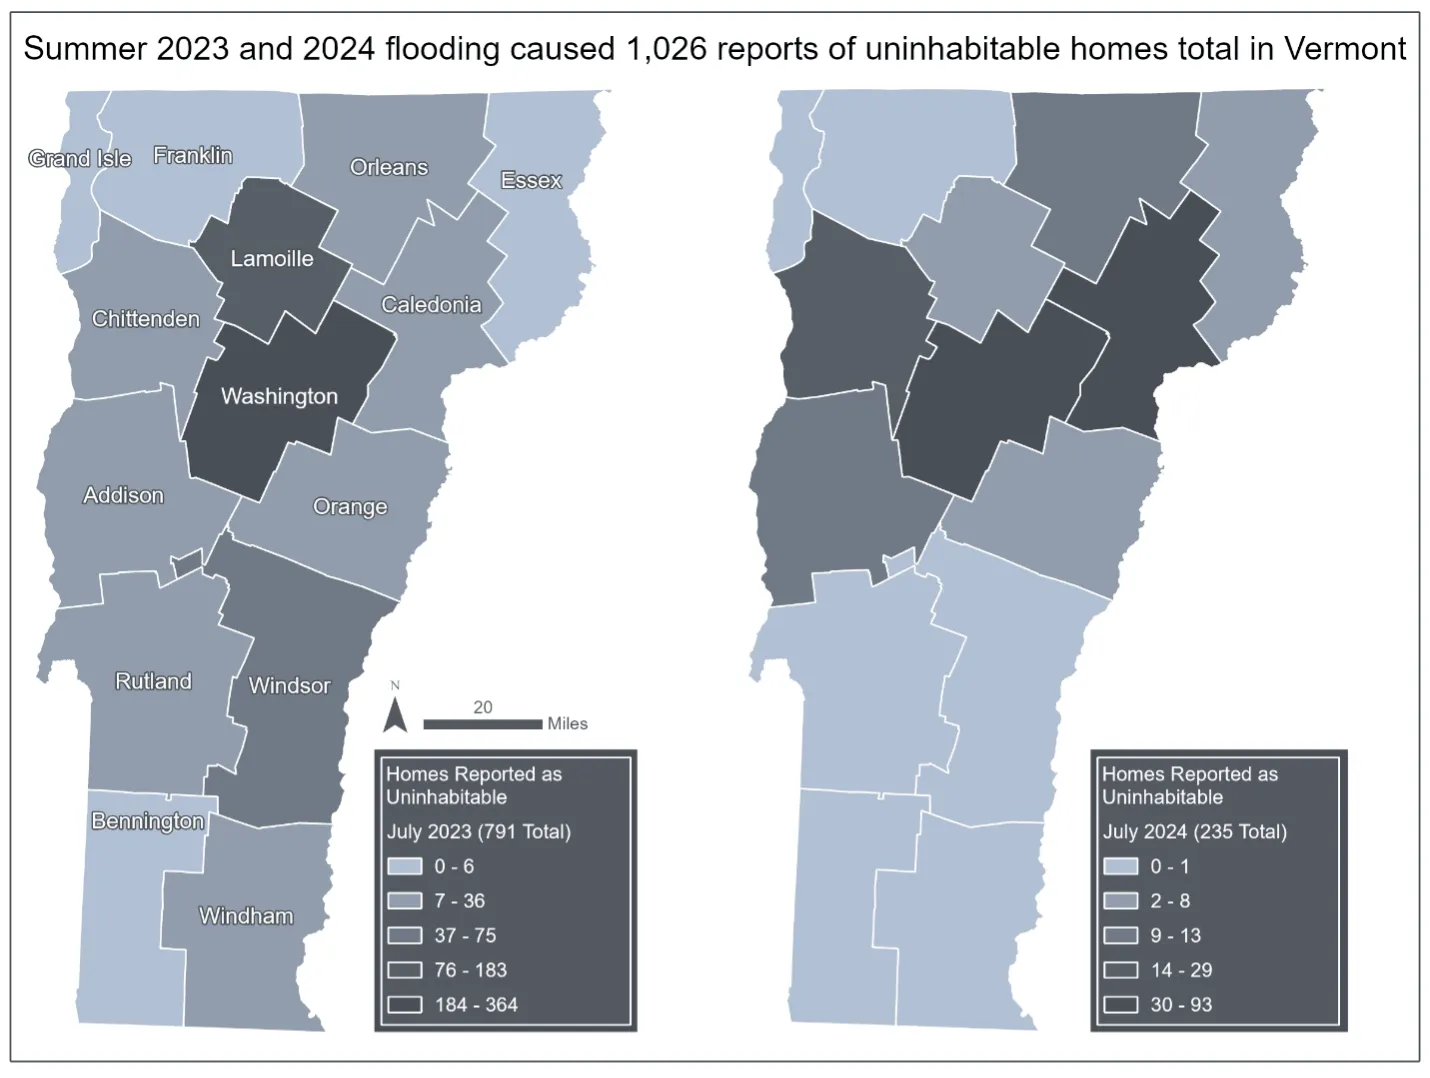
Source: Vermont Emergency Management (2023)
Note: Data compiled by Jessica A. Balerna and visualized by Hannah C. Turner
Mental health significantly decreases for people affected by flooding, including increased levels of depression and anxiety (Fernandez et al., 2015). Incidences of post-traumatic stress disorder (PTSD) and post-traumatic stress symptoms tend to increase in flood-impacted areas from pre-flood levels (North et al., 2004). The hardships associated with enduring a flood event have been linked to increased substance use (Fernandez et al., 2015), especially as a result of flood-related job loss or interruption (Peek-Asa et al., 2012).
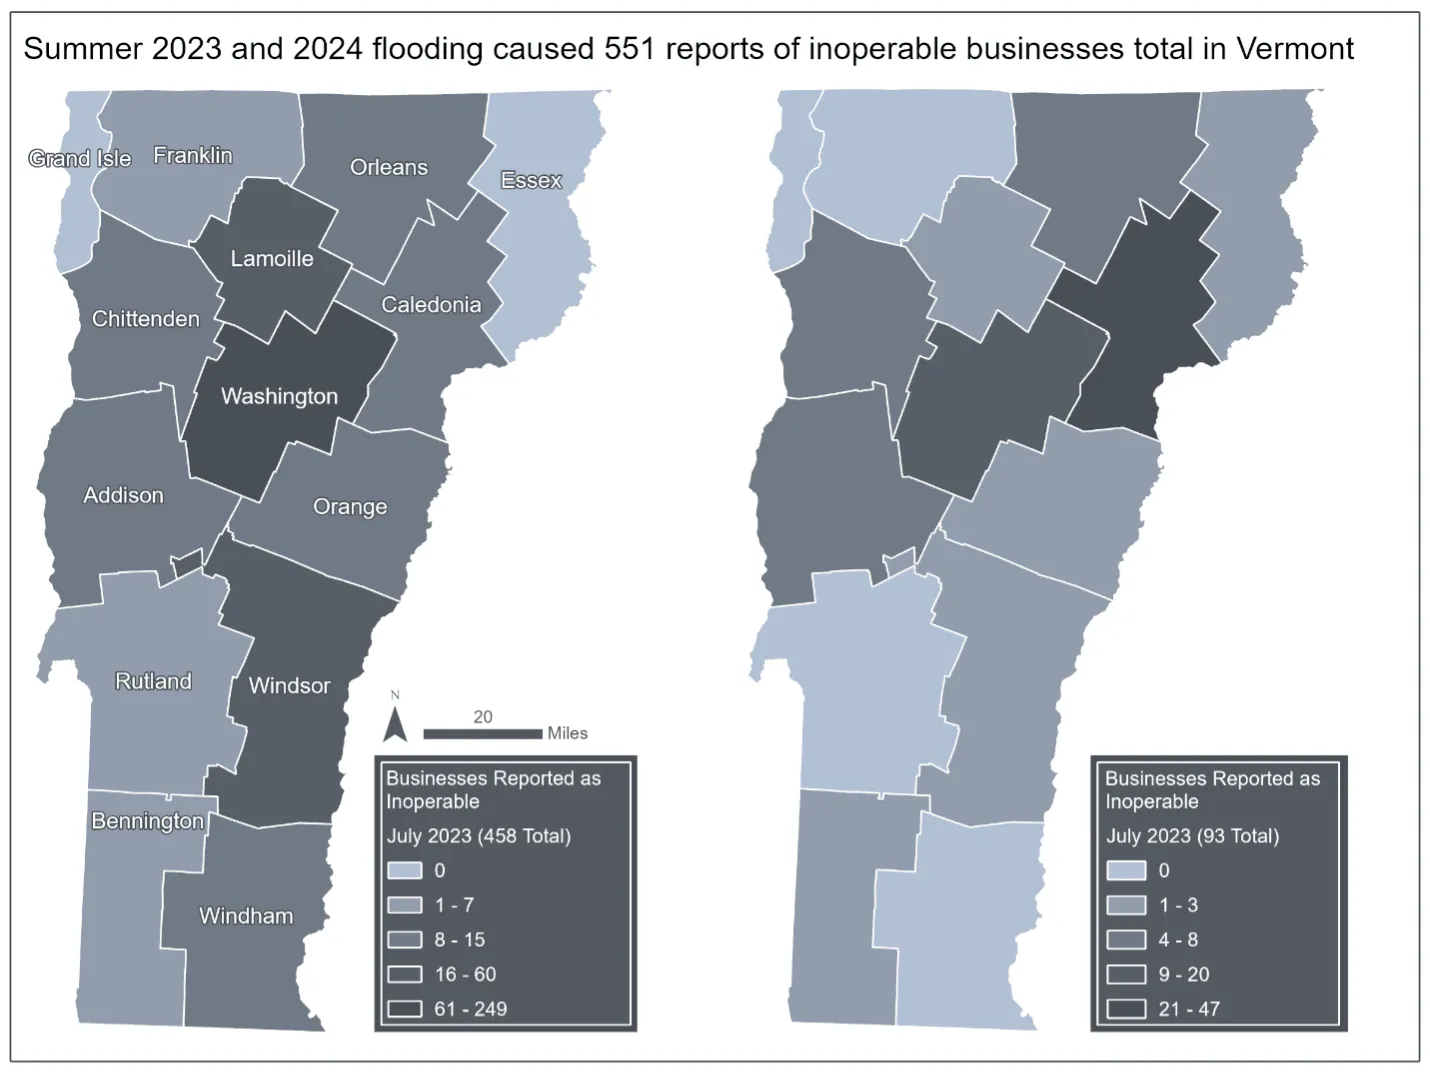
Source: Vermont Emergency Management (2023)
Note: Data compiled by Jessica A. Balerna and visualized by Hannah C. Turner
Vulnerability
People in mobile homes are particularly vulnerable to health impacts from flooding (see Community Development 11.3.1), such as people with existing chronic respiratory disease, (e.g., asthma, Chronic Obstructive Pulmonary Disease [COPD]) who are more vulnerable to impacts of mold. It is particularly concerning that almost half (45%) of the 211 callers that reported mold in the 2023 and 2024 floods also reported having chronic conditions (Vermont Emergency Management, 2023).
10.4.3 What you can do
Making preparations in advance is the most effective way to protect individuals, households, and businesses from the health impacts of flooding. Individuals can create household and business emergency plans. VDH provides a list of “flood-safe” behaviors and tips to help in preparing for floods (Vermont Department of Health, 2025e).
At a community level, planning and strategic investments in infrastructure can provide effective protection. Hazard Mitigation Plans help guide investments and access to the U.S. Federal Emergency Management Agency (FEMA) and state funding. These strategic decisions might include improving storm management infrastructure, such as properly designed culverts to protect roads (see Infrastructure 7.3.1). Green infrastructure (e.g., natural ecosystems) show potential for flood mitigation (Green et al., 2021). For example, the Otter Creek wetlands and floodplain reduced flood-related damages in Middlebury during Tropical Storm Irene by 84–95% (Watson et al., 2016).
Effective disaster communications are critical in protecting communities before, during, and after flood events. An analysis of the disaster communication systems in Vermont during the 2023 flood events made two main recommendations: 1) risk communication messages must be timely, clear, audience-driven, location-based, and accessible to the public, with special attention to the needs of vulnerable communities, and 2) gap analyses should be conducted, considering the communication governance and the roles of the various stakeholders involved in the emergency response and recovery (Soares et al., 2025; see Community Development 11.5).
10.5 Air quality
Climate change brings new threats to clean air that require renewed focus separate from point source pollution addressed since the 1960s. In Vermont, climate-related impacts on air quality have four main causes: wildfire smoke, pollen, mold, and dust/airborne particles. Each risk primarily impacts people’s respiratory systems but can affect eyes, skin, mental health, and other essential body systems.
Vermont has some of the cleanest air in the country (American Lung Association, 2025), yet has the fifth highest asthma rate for adults, underscoring how Vermonters are a vulnerable population for air quality changes.
10.5.1 Wildfire smoke
Hazard
Wildfire seasons in the U.S. have grown longer and more severe in recent decades (Westerling et al., 2006) and are likely to worsen in the future (Liu et al., 2013). In the summers of 2023 and 2025, wildfire smoke from Canadian wildfires darkened skies in Vermont and the northeastern U.S. (Cutler & LaShomb, 2025; Jain et al., 2024; see Forests 3.6.3). Wildfire smoke contains many hazardous components, including nitrogen dioxide, sulfur dioxide, ozone, acrolein, formaldehyde, benzene, toluene, xylene, and fine particles (Adetona et al., 2016). Wildland fires, which include controlled burns, are the largest PM2.5 source in the U.S. (U.S. Environmental Protection Agency, 2023b). PM2.5—an airborne particulate matter of a very small size—is one of the most studied pollutants in wildfire smoke and can penetrate deep into the small airways of the lungs, causing many negative health outcomes.
Health effects
Clear links have been found between wildfire smoke and increased health care utilization (e.g., number of physician visits, emergency room visits, and hospitalizations; Reid et al., 2016), decreased lung function (Orr et al., 2020), increased respiratory infections (Rappold et al., 2011), increased pneumonia and bronchitis (Delfino et al., 2009), increased cardiovascular disease (CVD) (Johnston et al., 2014), adverse birth outcomes (Holstius et al., 2012), and decreased mental health (Eisenman & Galway, 2022).
Wildfire smoke is a relatively new phenomenon in Vermont so few studies exist on the local impacts. Preliminary data from the smoke-filled summer of 2023 showed decreased lung function among individuals with asthma and COPD compared to 2021 and 2022 (Ismail et al., 2025) and decreased asthma control among children with asthma compared to 2022 (Maassel et al., 2025). Anecdotally, pediatric pulmonologists at UVM Health said they received an increase in phone calls from parents concerned about children’s symptoms during 2023 (Patterson, 2025). More research and monitoring is needed in Vermont to fully understand the local health impacts.
Exposure
Outdoor activity increases exposure to wildfire smoke, primarily during the summer when many Vermonters are outdoors, working or recreating. Outdoor workers and people that are experiencing homelessness are more likely to be exposed to wildfire smoke. Those commuting, biking, or bussing to work; children at summer camps, sports practice, and recess; and families hiking and camping are just a few examples of people that could be exposed to wildfire.
Staying indoors does not guarantee protection from wildfire smoke, as indoor air quality is often just outdoor air, especially as many Vermonters do not have air filtration systems and rely on keeping windows open for cooling. As noted above (see 10.3), only 7% of housing units in Vermont have central air conditioning (U.S. Energy Information Administration, 2023). Guidance to stay inside and close windows can be further complicated by other co-occurring risks. For example, wildfire smoke and flooding often both occur during summer months and guidance for remediation of mold following a flood includes opening homes to provide air flow and drying (U.S. Centers for Disease Control and Prevention, 2006).
Vulnerability
These impacts can be greater on children (Henry et al., 2021; Zhang et al., 2024), whose respiratory systems are still developing, and on those with pre-existing cardiovascular and respiratory diseases, such as asthma and COPD (Borchers Arriagada et al., 2019; Reid et al., 2016). Older adults, due to age-related physiological declines and higher prevalence of chronic disease, are also at increased risk of health impacts from wildfire smoke (Vega et al., 2025). Those with greater unavoidable exposure are also more vulnerable, such as people working outdoors or experiencing homelessness.
10.5.2 Pollen
Hazard
One indirect effect of climate change is the increased risk from aeroallergens (Kim et al., 2025) from expanding and intensifying pollen seasons (Anderegg et al., 2021). Different types of pollen dominate the air at different times of the year. In Vermont, tree pollen is more present from spring through early summer (March through June), grass pollen is present most often in early summer (late May through June), and weed pollen is present most often in late summer (August; Vermont Department of Health, 2025f).
The main changes seen in pollen aeroallergens due to climate change are 1) lengthened pollen season due to longer periods of warm weather and longer freeze-free periods (Anderegg et al., 2021; see Climate Change in Vermont 2.4.4 and Agriculture and Food Systems 6.3.1), 2) increasingly severe pollen periods (plants release more pollen with more CO2 in the air; D’Amato & D’Amato, 2023), and 3) change in the composition and allergenicity of pollen (Kurganskiy et al., 2021; Pacheco et al., 2021; Rowney et al., 2021). In Vermont, average daily pollen counts for tree pollen have trended upward since 2009 (Figure 10-9). Further complicated by climate change is the creation of “thunderstorm asthma” (D’Amato & D’Amato, 2023; Price et al., 2021), which occurs when high humidity causes pollen grains to expand and rupture, creating smaller particles that penetrate deeper into the lungs and trigger asthma symptoms.
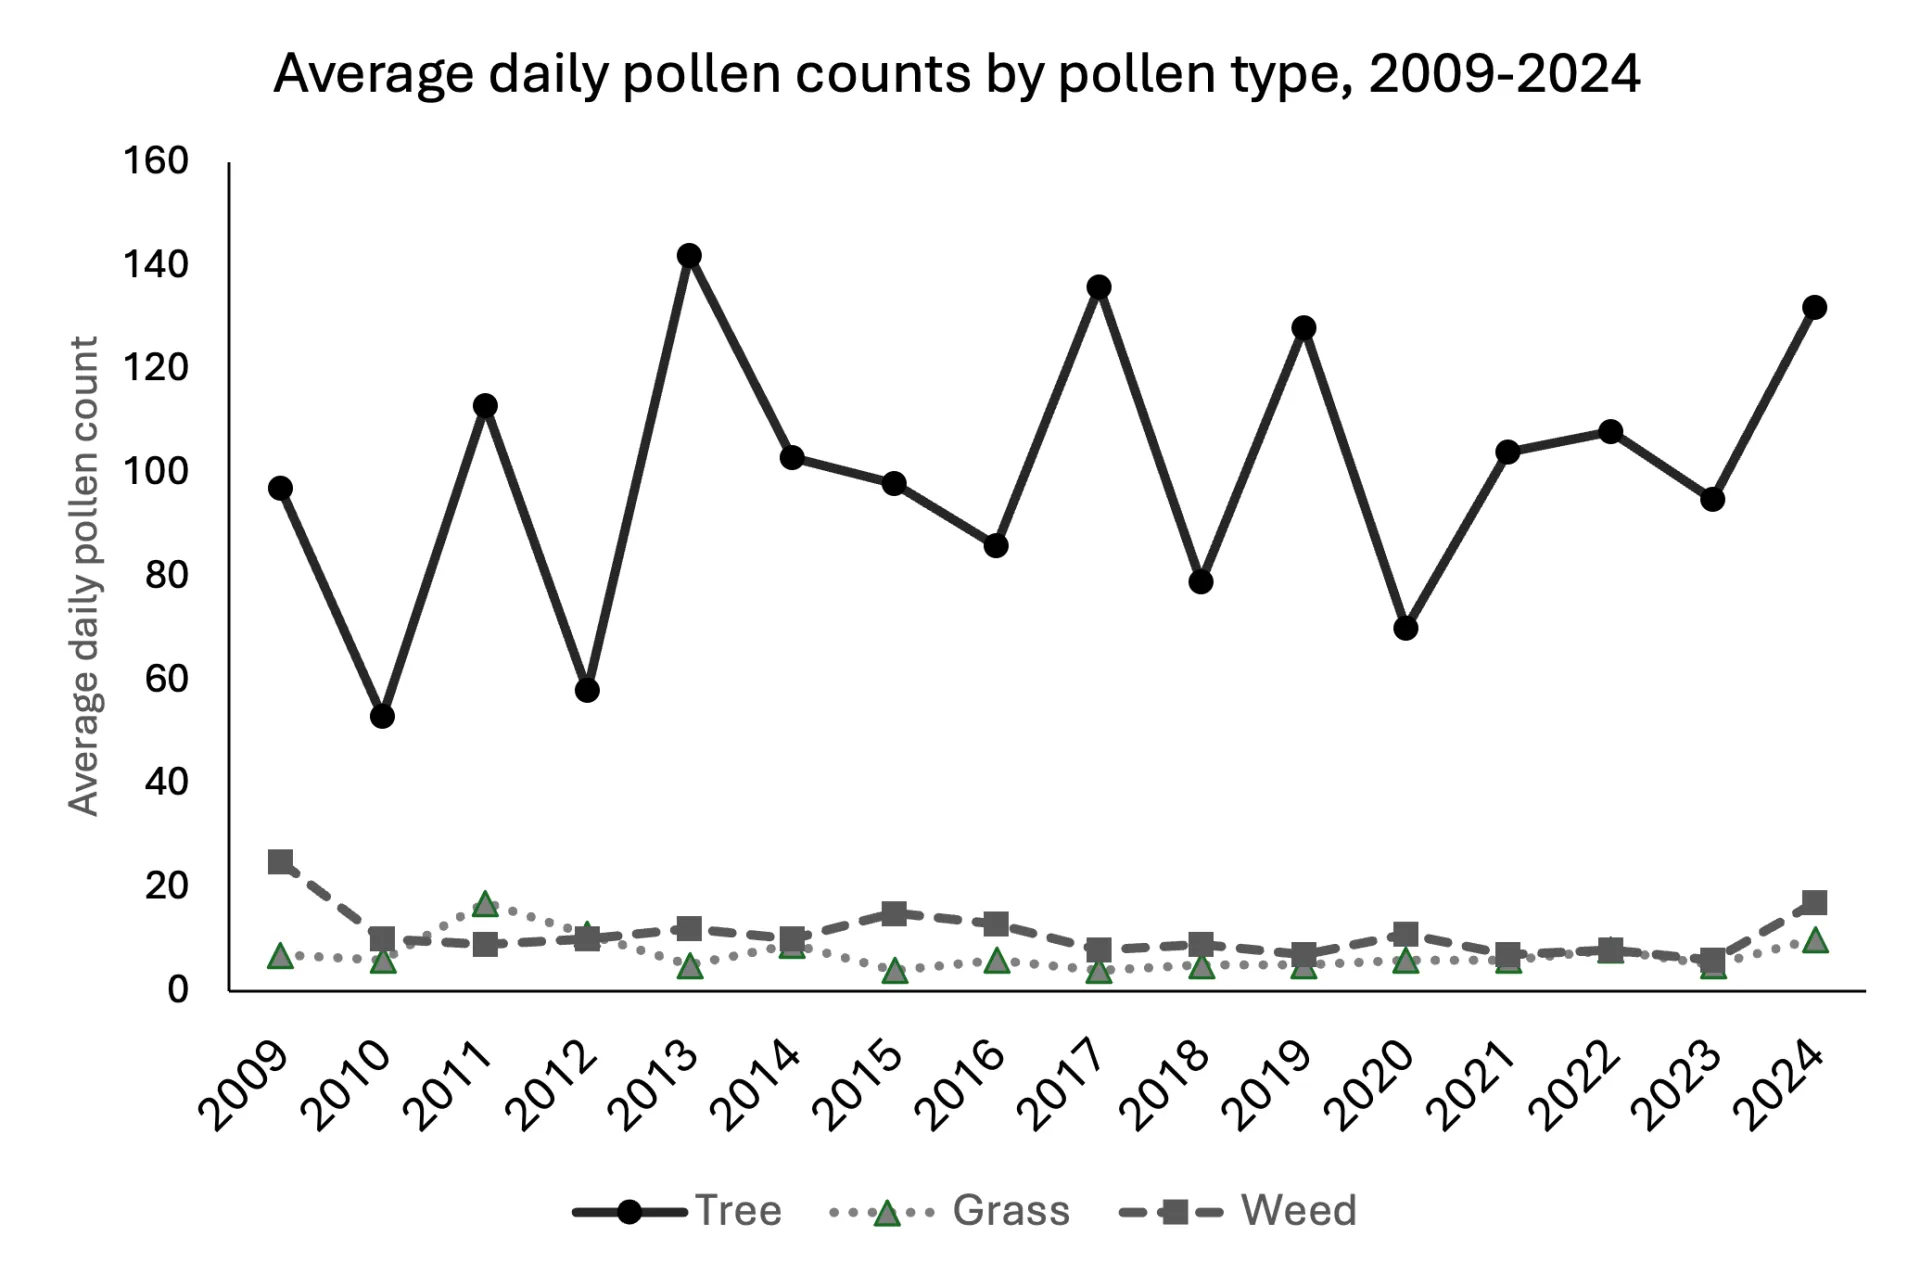
Source: Vermont Department of Health (2025f)
Health effects
The main health impact of pollen is as an airborne allergen, or aeroallergen. Inhaling aeroallergens can trigger the release of histamines, defensive chemicals in the body that cause called allergic rhinitis (hay fever). Hay fever symptoms can interrupt daily life, including sneezing, nasal congestion, sinus pressure, headaches, mucus production, and postnasal drip (U.S. Centers for Disease Control and Prevention, 2025a). Allergic rhinitis can exacerbate existing respiratory and CVDs (e.g., asthma, COPD), causing even more severe symptoms (Thomas, 2006).
Aeroallergen exposure can increase the risk of allergic sensitization, the development of an extreme sensitivity to the allergen. Infants and children living in a climate change-modified pollen season are at a higher risk than their parents or grandparents were of developing pollen allergies (Choi et al., 2021). When modeling the effects of these lengthened pollen seasons at 3.6°F (2°C) and 7.2°F (4°C) of global warming, one report predicted an additional 5,800–10,000 asthma-related ED visits, an additional 41,000–72,000 office visits for allergic rhinitis, and an additional 121,000–211,000 allergy prescriptions filled annually in the U.S. (U.S. Environmental Protection Agency, 2023a). Of note, the report also identified Vermont in the top five worst-affected states.
Exposure
Pollen exposure is a risk to anyone outdoors in an area of pollen-producing vegetation, and pollen is more present in areas densely vegetated with pollen sources (e.g., in forests). People indoors are at risk during pollen season if windows are open; since pollen seasons occur across spring, summer, and fall, the weather that is nicest for window-opening can coincide with periods of high pollen counts (also wildfire smoke, see 10.5.1).
Vulnerability
People with underlying health conditions or whose occupations require them to be outside, especially in farms, forests, and natural areas, are at higher risk for experiencing negative health impacts from pollen. Outdoor recreators may be at an increased risk, especially those in, or nearby, vegetated areas (e.g., bird watchers, hikers, cyclists). Those with asthma, COPD, or other respiratory or CVDs are at particular risk, as an allergic reaction to airborne pollen could trigger or exacerbate existing symptoms, especially in children (Cox-Ganser, 2023).
10.5.3 Mold
Hazard
Health risks from mold increase in warm weather, humidity, and flooding, all of which are occurring in Vermont (see Climate Change in Vermont 2.4.4, 2.6.2). Mold levels are correlated with severity of flooding (Pakdehi et al., 2025; Riggs et al., 2008) and mold can grow in damp spaces in less than 48 hours, while flood recovery can take weeks to years. Recommendations from the Centers for Disease Control and Prevention (CDC) and VDH to prevent mold include opening buildings to outdoor air circulation to dry them, but compounding climate change events such as extreme heat and wildfire smoke sometimes require the opposite protective action. This further increases the risk of mold growth after flooding, as Vermonters are forced to choose between conflicting guidelines for different climate-related health hazards (see 10.10).
Mold is not just a product of flooding; it can form and thrive in any moist environment due to leaks in roofs or pipes or in humid environments (e.g., bathrooms, poorly ventilated washing machines). It thrives on many different surfaces, including (but not limited to) wood, cardboard, drywall, ceiling tiles, fabric and upholstery, insulation, and potted plants. Common types of mold found in the home are Cladosporium, Penicillium, and Aspergillus (U.S. Centers for Disease Control and Prevention, 2024e). "Black mold" and "toxic mold,” although commonly used terms in the media, can be misleading because they do not describe a species or specific type of mold. All types of mold have the potential to cause negative health impacts.
Health effects
Some people are specifically allergic or sensitive to mold, with common reactions including sneezing, nasal stuffiness or runny nose, itchy or watery eyes, and skin rash either immediately upon contact or delayed (U.S. Centers for Disease Control and Prevention, 2025e). Mold can trigger or exacerbate asthma symptoms (e.g., coughing, wheezing, shortness of breath). It is estimated that exposure to mold and moisture in homes increases the risk for many asthma related health outcomes (e.g., development of asthma), by about 30–50% (Fisk et al., 2007). Other health effects linked to mold exposure include respiratory infections, bronchitis, and eczema (Mendell et al., 2011). Mold exposure can cause some fungal infections, especially in people who are immunocompromised, but fungal infections are not limited to transmission through mold exposure (Metts, 2008).
Exposure
Health concerns from mold exposure primarily stem from mold inhalation, as the small particle size (2–10 µm) can penetrate both the large and small airways of the upper and lower respiratory tract (U.S. Centers for Disease Control and Prevention, 2006). Mold particles become airborne through the disturbance of contaminated materials or when mold is present within heating, ventilation, and air-conditioning (HVAC) systems. People can come into contact with mold through ingestion and skin contact (U.S. Centers for Disease Control and Prevention, 2006).
Some insight into mold exposure specifically due to flooding in Vermont can be gained from examining data from 211 calls from businesses and individuals requesting assistance from VEM. Of the residents that reported mold presence in their home following the July 2023 flood (Figure 10-10), 71% reported that they could still live in their home, possibly because the mold was localized to specific areas of their home.
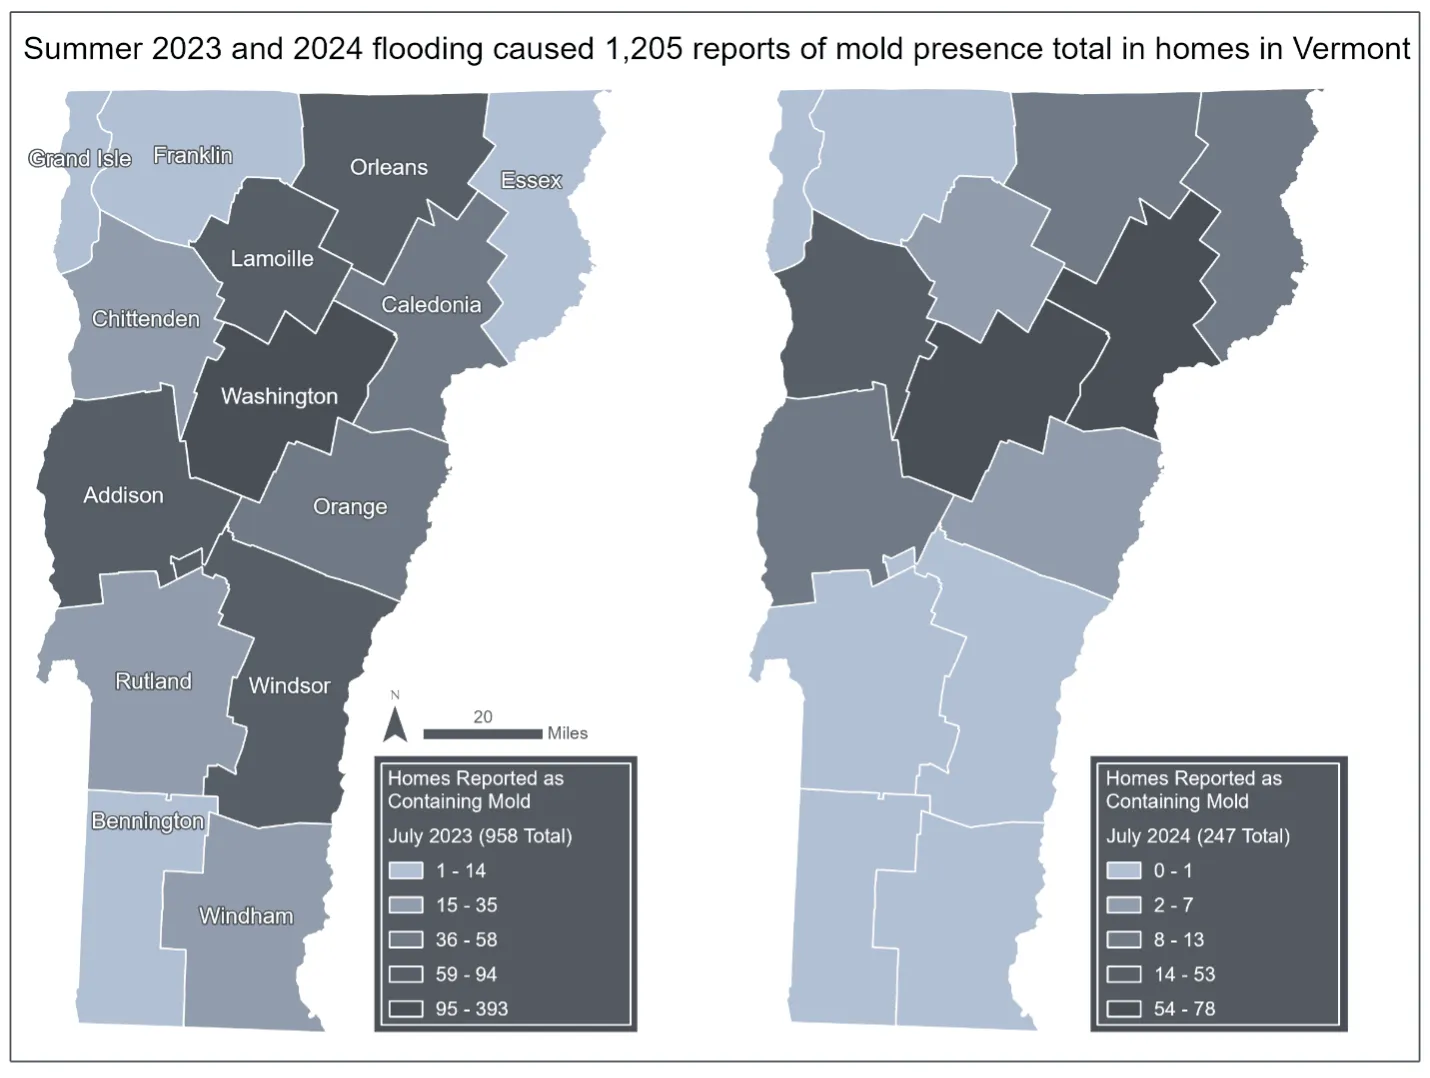
Source: Vermont Emergency Management (2023)
Note: Data compiled by Jessica A. Balerna and visualized by Hannah C. Turner
Vulnerability
The most vulnerable people to severe health impacts from mold include those with compromised immune systems and/or existing respiratory disease (e.g., asthma). Infants, young children, and older adults are more vulnerable due to development or weakened immune systems (U.S. Centers for Disease Control and Prevention, 2024e). Additionally, some people may not have the financial or social resources to move out of a mold-affected home while awaiting remediation or have access to outside assistance.
10.5.4 Dust and airborne particles
Hazard
Drought dries out soil and surfaces, increasing the likelihood of particles becoming airborne from wind and other disturbances. These particles can vary in size but tend to be coarser (0.4–10 μm). Drought can lead to large dust storms, which are unlikely in Vermont due to its geography and vegetation; however, localized, minor dust episodes can occur in areas of exposed soil (e.g., agricultural fields). Fugitive road dust or airborne dust from roads is likely to be more common with drought in Vermont (Chen et al., 2019). In a state with more dirt roads (8,543 miles) than paved roads (7,226 miles), airborne dust from roads can greatly increase during periods of drought (Vermont Agency of Transportation, 2024; see Infrastructure 7.3.3). Dust generated from other activities, like construction, could also be amplified during periods of drought.
Health effects
Links between health and climate-change-induced increases in airborne dust have not been heavily studied in Vermont, but health effects of dust inhalation have been investigated globally—including coughing, wheezing, and exacerbation of existing conditions (e.g., asthma) and causing increases in emergency room visits and hospitalizations (de Longueville et al., 2013; Stanke et al., 2013). The 1930s Dust Bowl in the U.S. caused deaths due to “dust pneumonia," inhaling excessive amounts of dust and dirt (Stanke et al., 2013). In addition to dirt and particulate matter, airborne dust can also carry microorganisms like bacteria and fungi; increased cases of viral and fungal infections have been associated with dust storms in other parts of the world (Schweitzer et al., 2018). Due to Vermont’s heavily forested geography, dust conditions from drought would likely not come close to the concentrations of dust being studied in these other areas, but more local research is needed to fully understand health effects for Vermonters particularly given the pervasiveness of dirt roads in the state.
Exposure
Exposure to environmental dust and airborne particles occurs primarily outdoors near dust sources (e.g., dirt roads, open fields) but particles can enter indoor spaces through open doors and windows. Dust-associated health concerns stem primarily from inhalation, so activities that require higher breathing rates (e.g., outdoor labor, running) place individuals at higher exposure rates including construction workers, road workers, and farmers.
Vulnerability
Young children, elderly adults, and individuals with heart and lung conditions are likely to experience more severe health impacts from dust exposure than others (Schweitzer et al., 2018). Those living and working in rural and semi-rural areas or outdoors are also more vulnerable, due to the increased likelihood of dust generation in these areas.
10.5.5 What you can do
Effective communication of hazards is required for mitigating health impacts of poor air quality from any source, including transmission and reception—individuals need to know how to access and interpret information like the air quality index (AQI, a compilation of air quality components).
Health care providers can create anticipatory health plans with patients for actions for low air quality days (e.g., adjusting medication, changing personal behavior). For many patients, poor air quality induces fear and anxiety over potential health impacts so providers’ education and guidance on protective behaviors are an important way to ease these feelings (Parker et al., 2019).
At an individual level, protective actions include limiting time outside during periods of poor air quality, wearing a respirator, and staying indoors in rooms with air filtration systems (U.S. Centers for Disease Control and Prevention, 2025h). Existing HVAC systems can be improved by installing High-Efficiency Particulate Air (HEPA) filters, and affordable portable air cleaners can be made using a box fan and furnace filter (Figure 10-11; Holder et al., 2022).
Communities can take actions to keep their citizens safe, such as investing in air filtration systems in public buildings (e.g., schools, community centers); creating “clean air” shelters (similar to cooling centers); and creating guidelines for recess and sports practices (e.g., shifting a sports practice to a “skills” day instead of a conditioning day). Airnow.gov is a federal website with an air quality flag program that communities can adopt that uses a participatory approach to provide local air quality information while informing individuals about safe behaviors (U.S. Environmental Protection Agency, 2015a).
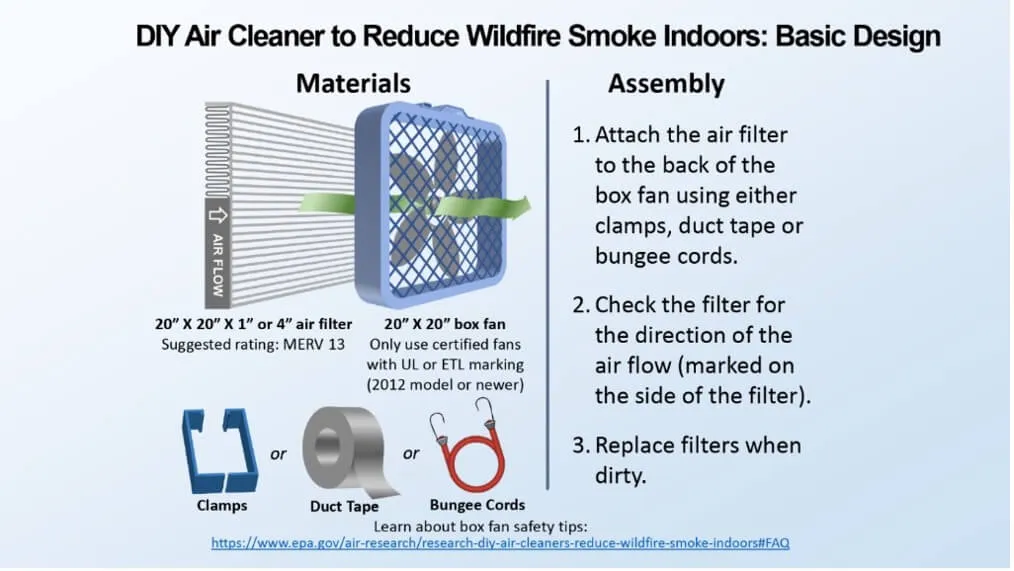
Source: U.S. Environmental Protection Agency (2021)
10.6 Tick and mosquito-borne diseases
Changes to temperatures and precipitation due to climate change will impact the prevalence of vector-borne diseases in Vermont. Temperature can affect the habitat range of vector species (e.g., mosquitoes, ticks), their life cycles and survivability, the population sizes of their hosts (e.g, deer, mice), and their behavior (Eisen et al., 2016; see Fish and Wildlife 5.7.3). Increased precipitation may increase mosquito breeding habitat (standing pools of water). While drought decreases this habitat, it also concentrates mosquitoes and reservoir species at fewer water sources, supporting disease transmission.
10.6.1 Tick-borne diseases
The primary tick disease vector in Vermont is the deer tick, also known as the black-legged tick (Ixodes scapularis). Other species found in Vermont (e.g., American dog tick or wood tick (Dermacentor variabilis), groundhog tick (Ixodes cookii)) can spread diseases (Vermont Department of Health, 2016).
Ticks develop through different life stages (from egg to an adult), and they require blood meals to develop (Ostfeld, 2011). Nymphs, the life stage between larvae and adults, are most likely to transmit diseases to humans due to the temporal overlap of their peak population with human activity at the start of the summer, their smaller size which makes them harder to spot and remove, and their generally higher rates of infection (Ostfeld, 2011).
The following tick-borne diseases have been detected in Vermont: Lyme disease, anaplasmosis, babesiosis, hard tick relapsing fever, and Powassan virus disease. Hard tick relapsing fever and Powassan virus disease have much lower prevalence rates than the other three diseases, and as such, they will not be discussed further in this report.
These diseases have overlaps in their exposure patterns and vulnerabilities. To reduce repetition, patterns found among all the described diseases are listed in the two following sections. Additional information specific to each disease follows.
Exposure (all tick-borne diseases)
Ticks wait on a plant to climb onto hosts, including humans, that brush against the plant. Ticks can be found in forested areas and areas with tall grass throughout Vermont. Forest edge habitat is a particular area of concern as there are increased populations of host species, which may lead to increases in diseases (Diuk-Wasser et al., 2021). As such, it is important to note that while climate change is a key factor driving changes in vector-borne disease rates in Vermont, it is not the sole driver. Changes in land use, such as forest fragmentation that increases border habitat (forest edges), impact the prevalence of these diseases. Yards are an area where people can be exposed, and there is some evidence that yardwork that decreases tick habitat (like clearing brush) may increase exposure (Fischhoff et al., 2019).
Tick exposure is of greatest concern in Vermont between May and June and between October and November, as the ticks are most actively seeking new hosts at these times (Vermont Department of Health, 2026e). As shoulder seasons warm or lengthen (see Climate Change in Vermont 2.4.5), overlapping tick activity and human recreation periods will increase (see Outdoor Recreation and Tourism 9.5.3), leading to higher levels of exposure risk (Bouchard et al., 2019). However, extreme heat waves, which are also increasing in occurrence (see Climate Change in Vermont 2.6), may reduce both tick and human activity temporarily (Bouchard et al., 2019).
Individuals are often unaware of tick exposure that may lead to undercounting of incidence of tick-borne diseases, especially among cases with little to no symptoms. If people are unaware of a tick bite, they may not seek diagnosis or treatment until symptoms increase.
Vulnerability (all tick-borne diseases)
Incidence rates of tick-borne diseases vary by age, sex, occupation, and location. See respective disease sections to learn more. Incidence rates generally increase with age, although children have been identified as a higher-risk group for Lyme disease. This may reflect children’s likelihood of exposure due to playing in tick habitat or age-related susceptibility to infection (Kugeler et al., 2022). Higher rates of tick-borne diseases among older adults may reflect the large aging “baby boom” generation, at least for Lyme disease (Kugeler et al., 2022). Additionally, older adults may have poorer immune function and thus greater susceptibility to disease.
Incidence of both Lyme disease and babesiosis in Vermont is higher among males than females (Vermont Department of Health, 2025i, 2025l). This may be because of differences in symptoms, diagnosis/reporting, or behaviors that affect exposure risk between sexes (Kugeler et al., 2022).
People with outdoor occupations in high risk tick habitat (e.g., foresters, farmers, landscapers, trail maintenance crews), are especially vulnerable due to increased exposure risk (Roome et al., 2026; U.S. Environmental Protection Agency, 2025a). Outdoor recreators, such as hikers and gardeners (Kim et al., 2024), and households with indoor/outdoor pets (Mead et al., 2018) have increased exposure risk.
Lyme disease
Hazard (Lyme disease)
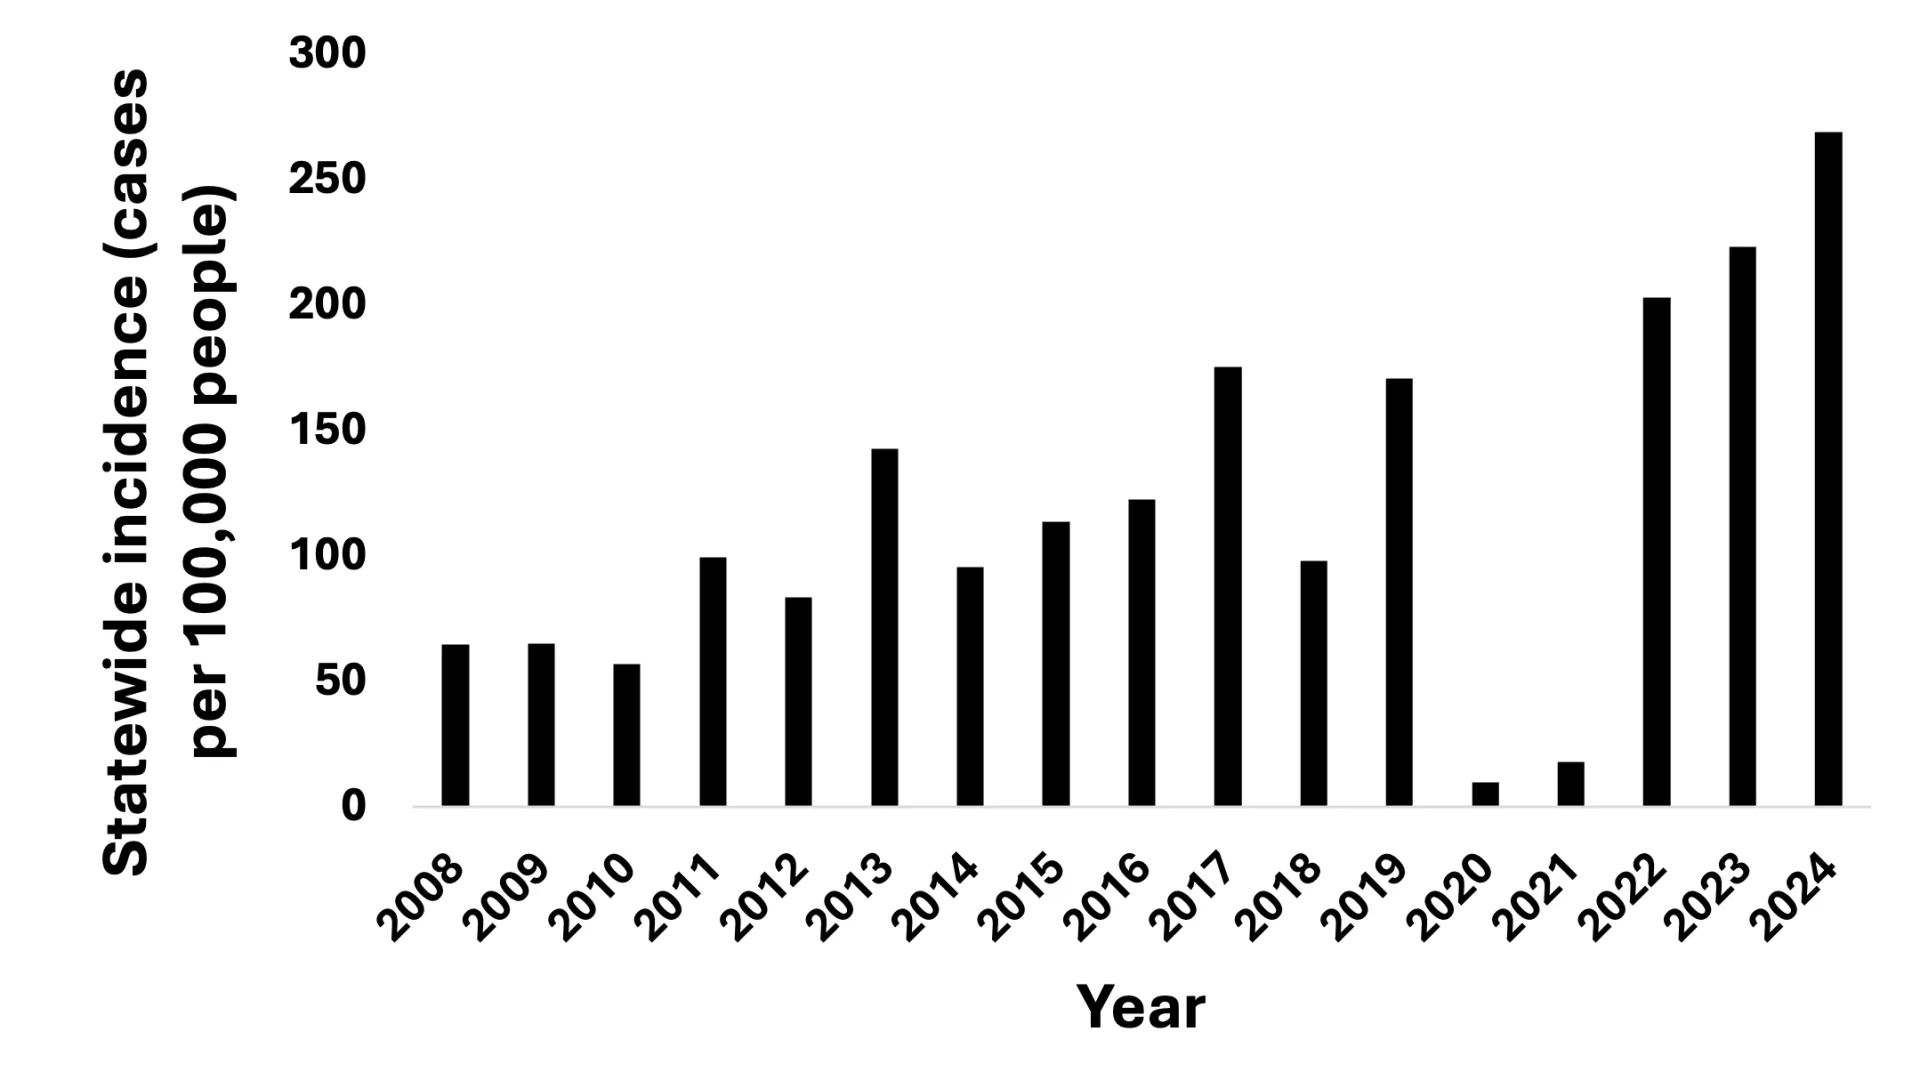
Lyme disease is the most common tick-borne disease in Vermont, and incidence has increased in recent years (Figure 10-12) although the definition of a reportable case has changed. In 2008, there were 64.7 cases per 100,000 people in Vermont, and by 2024, that number had increased to 268.9 cases per 100,000 people (Vermont Department of Health, 2025m). Starting in 2022, the definition of a reportable case changed for states like Vermont with high incidences of Lyme disease (Vermont Department of Health, 2025m) so cases are now based on lab results and do not require a clinical diagnosis. This has contributed to an increase in reported cases since 2020. Before this definition change and the COVID-19 pandemic, 5,736 cases of Lyme disease were reported in Vermont between 2013–2019, with an average of 819 per year.
The bacterial pathogen that causes Lyme disease, Borrelia burgdorferi, is also the most detected pathogen in Vermont ticks. Between 2015 and 2024, Borrelia burgdorferi was detected in 52.1% of the ticks tested (n= 3,435) through a Vermont Agency of Agriculture, Food & Markets (VAAFM) monitoring program (2025).
Source: Vermont Department of Health (2025m)
Health effects (Lyme disease)
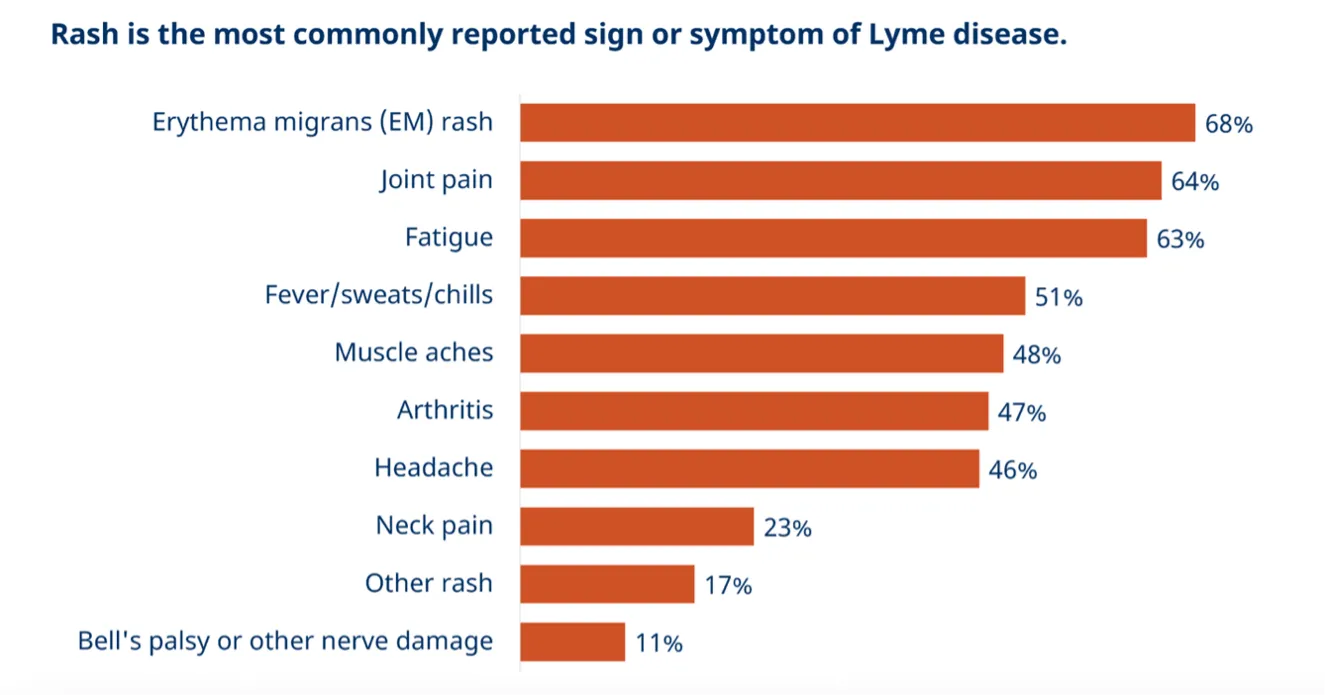
For at least 50% of cases, symptoms of Lyme disease include rash, joint pain, fatigue, fever, sweats, and chills (Figure 10-13; Vermont Department of Health, 2025i). According to VDH, an erythema migrans (bullseye pattern) rash is reported in 68% of cases, but other studies attribute a higher symptom prevalence, at 80% of cases (McCollough, 2018).
Source: Vermont Department of Health (2025i)
Vulnerabilities (Lyme disease)
Those at higher risk include people working outdoors and males, who have higher incidence rates across all age ranges than females (Gould et al., 2025). The incidence gap between sexes is highest among males ages 5–14 and 80 or older (Vermont Department of Health, 2025m). This aligns with trends identified at the national level. In an analysis of national surveillance data from 1992–2006, there was a disproportionate increase in incidence rates among young males compared to young females (Bacon et al., 2008). A separate national analysis of data from 1992–1996 and 2012–2016 found a similar trend, with incidence rate ratios between 39–89% higher among males than females in most age groups (Kugeler et al., 2022). Neither study was able to identity the reason for this difference between sexes, although Kugeler et al. suggested it could be due to demographic trends, behavioral differences, or physiological differences that impact clinical manifestation (2022).
Incidence rates in Vermont peak at younger ages (5–14), dip, and then rise again from ages 20–79, before rates fall again (Vermont Department of Health, 2025m). Based on a national analysis of Lyme disease cases between 1992–2016, the average age of infected adults increased throughout that period and corresponded with the age of the “baby boom” population, indicating that Lyme may be more common among older adults because that population group is larger (Kugeler et al., 2022).
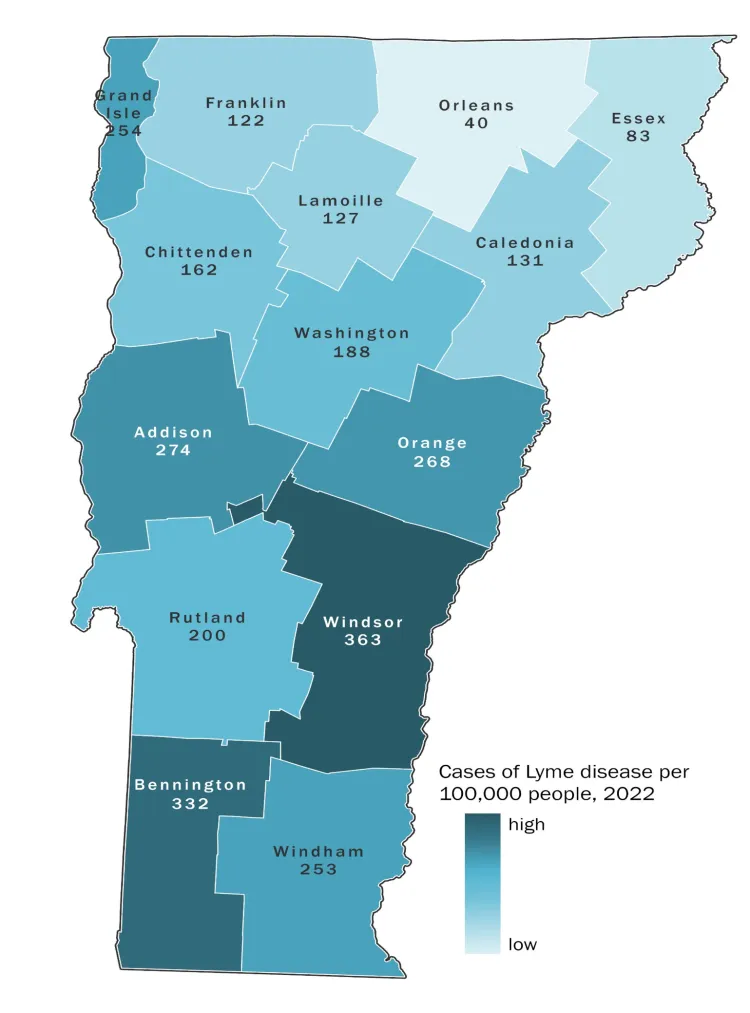
People living in certain counties of Vermont are also at higher risk. From 2018–2022, density of Borrelia burgdorferi-infected ticks was highest in Addison and Rutland counties (12.5 and 12.2 ticks per 1,000 square meters, respectively; Vermont Department of Health, 2024b). Incidence among people is also higher in southern counties (Figure 10-14).
Source: Vermont Department of Health (2025i)
Clinical presentation and access to care can also influence risk. People of lower socioeconomic status may be at higher risk of developing disseminated disease (disease that has spread to multiple areas of the body) due to associated barriers to health care (McCollough, 2018). People who do not present the typical erythema migrans rash first before experiencing other symptoms are also more likely to experience increased time to diagnosis and treatment (Rebman et al., 2023).
Anaplasmosis
Hazard (Anaplasmosis)
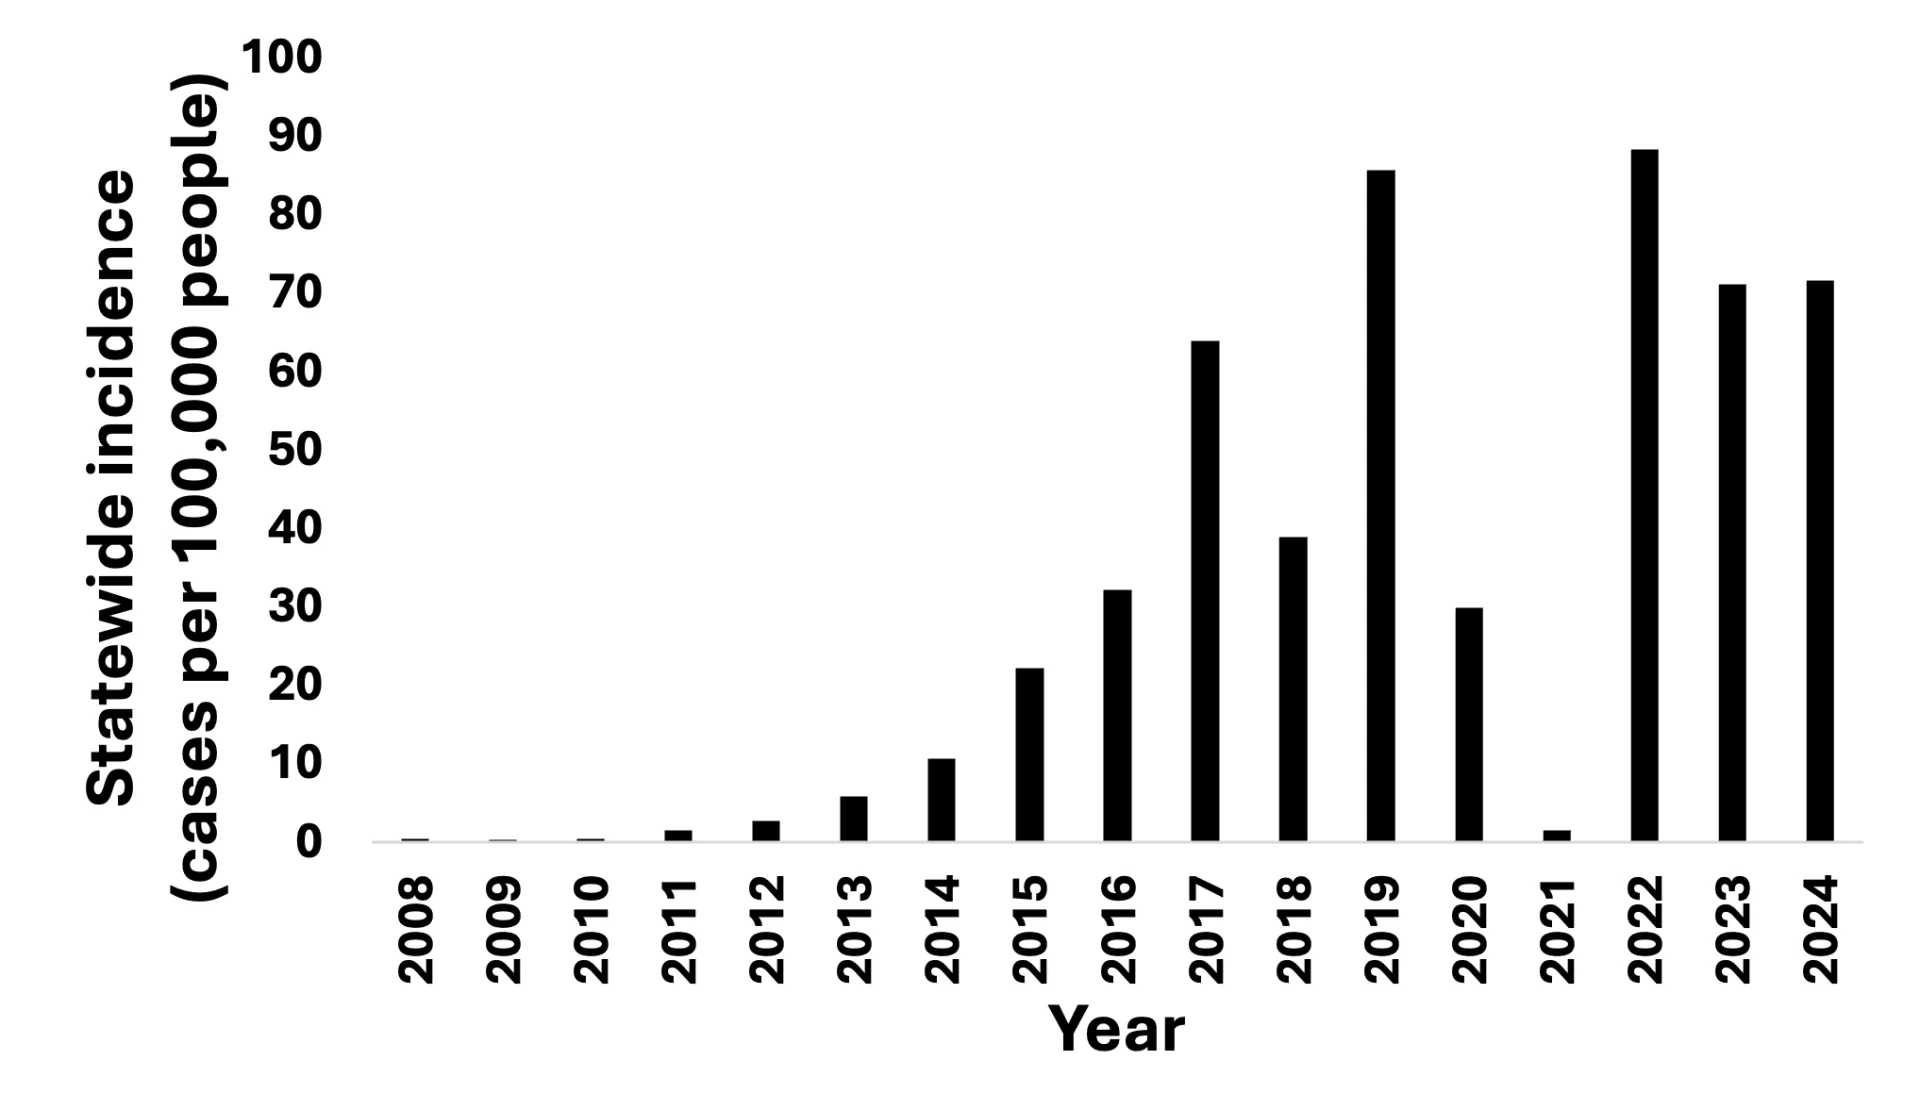
Anaplasmosis is the second-most common tick-borne illness in Vermont and the fastest emerging tickborne disease in Vermont (Vermont Department of Health, 2025k; Figure 10-15).
Source: Vermont Department of Health (2025m)
Anaplasmosis is caused by the bacterium Anaplasma phagocytophilum. In ticks collected by VAAFM’s Environmental Surveillance Program between 2020–2024, Anaplasma phagocytophilum and Borrelia burgdorferi were the two pathogens most likely to co-infect a tick, with an average co-infection rate of 6.14% among ticks tested (Vermont Agency of Agriculture, Food & Markets, 2025). Between 2015–2024, Anaplasma phagocytophilum was detected in 9.92% of the ticks tested through VAAFM’s monitoring programs (Vermont Agency of Agriculture, Food & Markets, 2020, 2025).
Health effects (Anaplasmosis)
Over 70% of Vermonters with anaplasmosis between 2013 and 2022 reported fever, malaise, chills, and muscle pain/aches (Vermont Department of Health, 2025k). Since rashes are a rare symptom of anaplasmosis, an erythema migrans rash may indicate co-infection with Borrelia burgdorferi, the pathogen that causes Lyme disease (New Jersey Department ofHealth, 2025). Approximately 36% of Vermont anaplasmosis patients are hospitalized, and if the disease is not detected and treated promptly, it may be fatal, especially in older adults and people with other health conditions (Vermont Department of Health, 2025k).
Vulnerabilities (Anaplasmosis)
Higher incidence rates are reported among older adults, with incidence rates peaking among Vermont males ages 75–79 and Vermont females ages 80–84 (Vermont Department of Health, 2025m). This may be associated with the higher risk of severe illness among those with impaired immune systems and the fact that advanced age leads to immune system decline (New Jersey Department of Health, 2025). Delayed treatment, similar to Lyme disease, is another risk factor for severe illness (New Jersey Department of Health, 2025).
Males and people living in southern Vermont also experience higher incidence rates (Vermont Department of Health, 2025k; Figure 10-16). From 2018–2022, Rutland County had the highest density of Anaplasma phagocytophilum-infected ticks at 2.6 ticks per 1,000 square meters (Vermont Department of Health, 2024e).
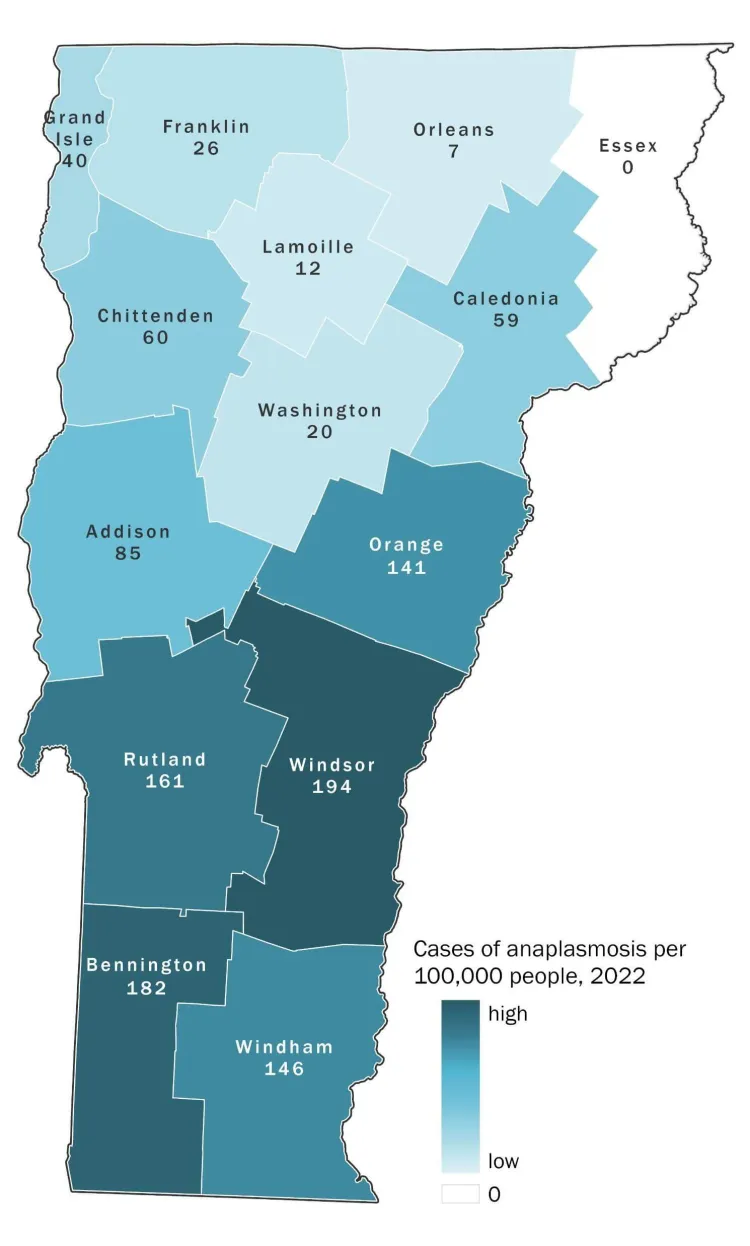
Source: Vermont Department of Health (2025k)
Babesiosis
Hazard (Babesiosis)
Babesiosis, the third-most common tick-borne disease in Vermont, is caused by the blood parasite, Babesia microti. While incidence rates are substantially below that of anaplasmosis, there has been a similar dramatic increase in annual incidence rates since 2013 (Vermont Department of Health, 2025l; Figure 10-17).
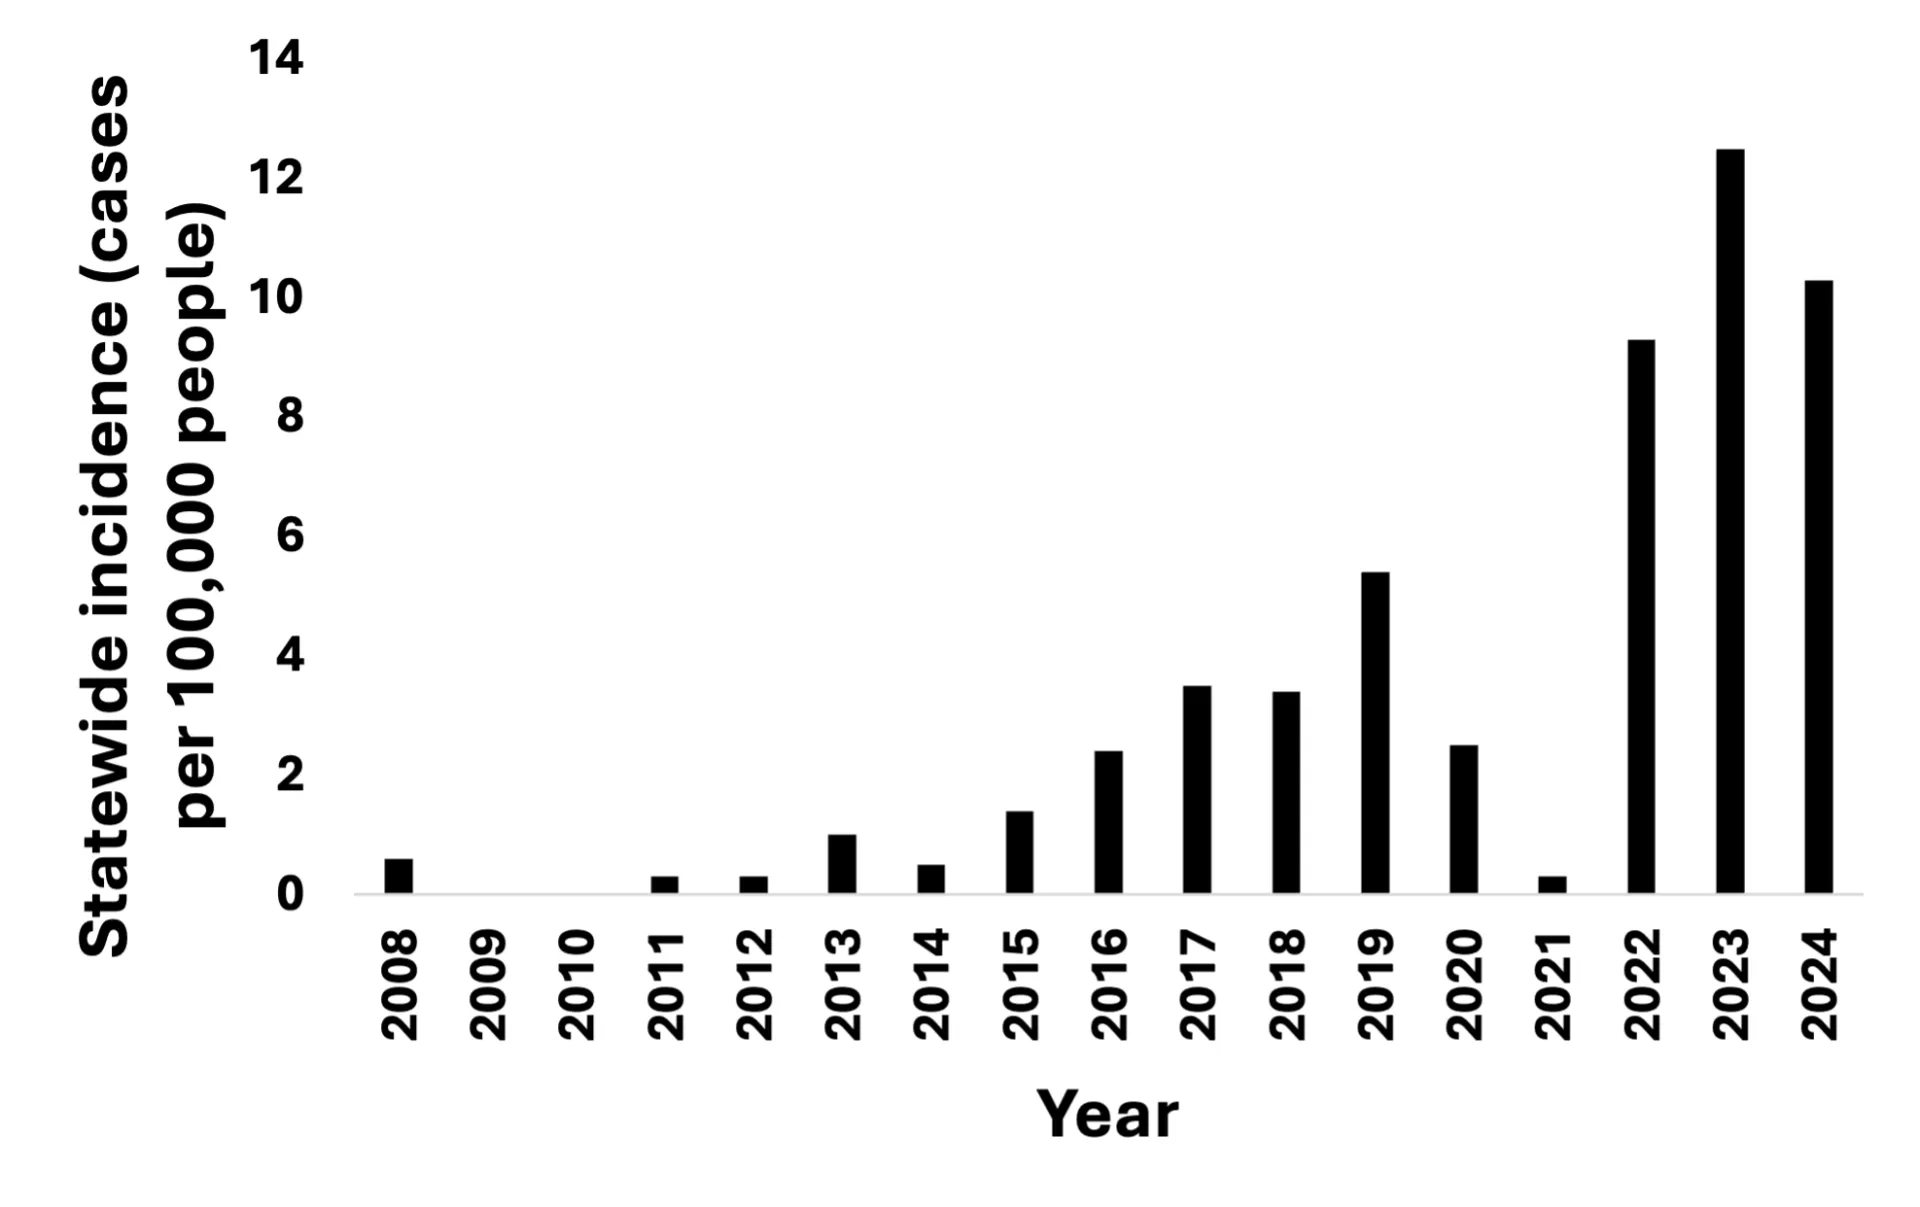
Source: Vermont Department of Health (2025m)
Health effects (Babesiosis)
The three most common symptoms, reported in more than 70% of cases in Vermont, are fatigue, fever, and chills; however, it can also lead to more severe symptoms and death (Vermont Department of Health, 2025l). These more severe symptoms develop because babesiosis affects red blood cells, and, when this happens at a high enough rate, leads to hemolytic anemia, a condition characterized by an overall decrease in red blood cells (U.S. Centers for Disease Control and Prevention, 2024b). Symptoms that may predict hospitalization or severe illness include nausea, vomiting, diarrhea, and hyperbilirubinemia/jaundice (Mareedu et al., 2017).
Exposure (Babesiosis)
Babesiosis has another exposure pathway that makes it unique compared to other tick-borne diseases described here. In addition to exposure through tick bites, people can be exposed through blood transfusions. If a pregnant parent is infected, babies can also be exposed in the womb or during birth (U.S. Centers for Disease Control and Prevention, 2024b).
Vulnerabilities (Babesiosis)
Males and the elderly are more likely to have reported babesiosis cases. In an analysis of national surveillance data from 2011–2015, among patients with available data, 65.9% were male, and the median age was 63 years (Gray & Herwaldt, 2019). The reason for higher rates among males is unknown but could be due to behavioral or physiological differences. A study of hospitalized babesiosis patients in New York between 1982–1993 found that male sex was associated with severe health outcomes but could not determine any potential explanatory mechanisms (White et al., 1998). Additionally, those with compromised immune systems, alkaline phosphatase values over 125 units/liter (U/L)—due to liver disease or bone diseases like osteoporosis—leukocytosis (high white blood cell counts), a removed spleen, or kidney disease are all at higher risk of severe disease (Cleveland Clinic, 2021, 2022; Vermont Department of Health, 2025l; White et al., 1998).
Similar to other diseases, location within Vermont also affects risk, with southern counties having higher incidence rates (Vermont Department of Health, 2025l; Figure 10-18). Rutland County had the highest infected tick density from 2018–2022, with 2.8 infected ticks per 1,000 square meters (Vermont Department of Health, 2024e).
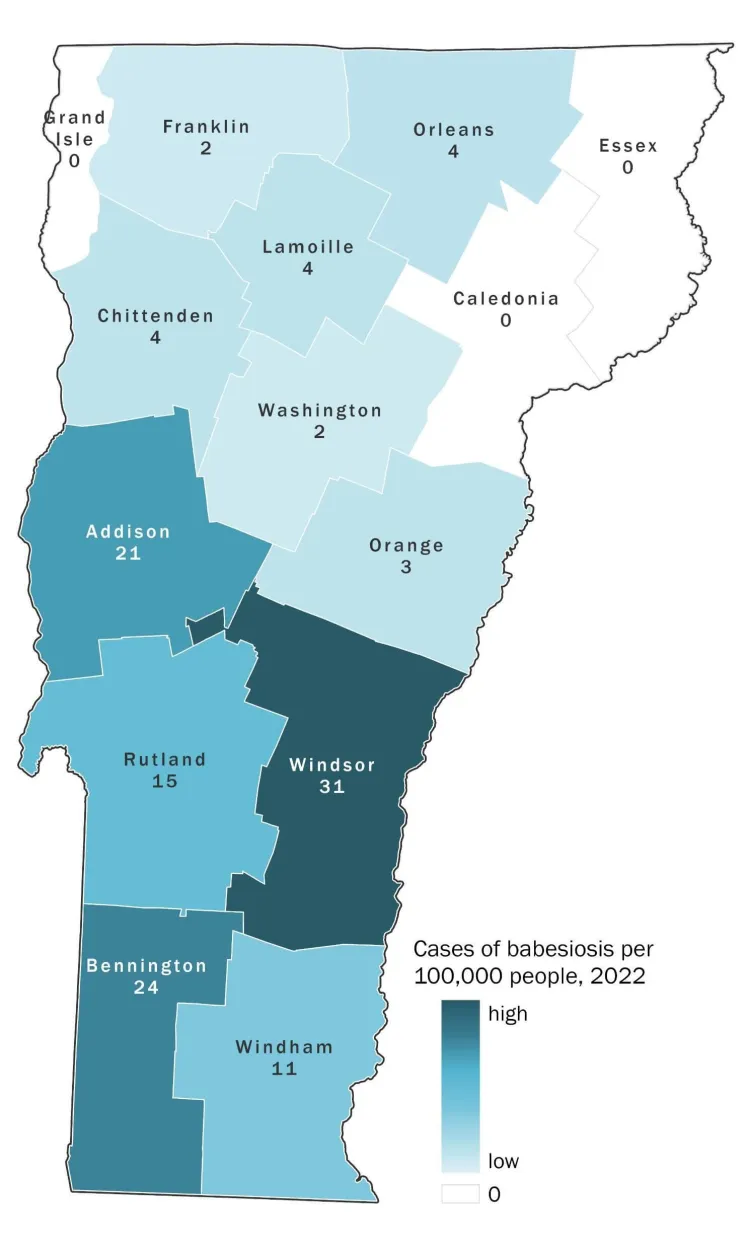
Source: Vermont Department of Health (2025l)
10.6.2 Mosquito-borne diseases
Temperature and precipitation affect the range and reproduction of mosquitoes, impacing the types and prevalence of mosquito-borne diseases. Longer warm periods can extend the mosquito season, and increases in standing water provide habitat for breeding (see Fish and Wildlife 5.7.3). There are currently three locally transmitted mosquito-borne diseases in Vermont, all three with low incidence rates compared to tick-borne diseases: West Nile virus, Eastern Equine Encephalitis virus, and Jamestown Canyon virus. VDH tests mosquitoes collected from sites around the state each week from June through October for the three mosquito-borne viruses. A new mosquito species, Aedes albopictus, has been declared to be locally reproducing in Windham county (Vermont Department of Health, 2025t), which is troubling as it can transmit viruses like Zika and Dengue (Vermont Department of Health, 2025t).
West Nile virus (WNV)
Hazard & exposure (WNV)
West Nile virus (WNV) is transmitted by a variety of mosquitoes, mostly those in the Culex genera. It has been detected across Vermont since 2002, with 0–5.2% of tested pools (group of 1–50 mosquitoes of the same species, collected at the same trap location, on the same date) testing positive for WNV each year between 2003 and 2025 (Vermont Department of Health, 2020; Vermont Department of Health, 2025h; Figure 10-19). From 2002–2023, 17 cases of WNV in humans were reported in Vermont.
Temperature and precipitation affect the virus directly in addition to affecting the mosquito populations. A different strain of WNV (WN02) than the strain that was first introduced in the U.S. became dominant nationally due to its temperature-related advantages. WN02 is more efficient at being transmitted and replicates faster at higher temperatures, leading to a higher viral load in infected mosquitoes (Kilpatrick et al., 2008).
Health effects (WNV)
Eighty percent of people infected with WNV are asymptomatic (Vermont Department of Health, 2025p). For those with symptoms, the majority exhibit fever, headache, fatigue, and occasionally rash or other symptoms (Vermont Department of Health, 2025p). However, less than 1% (1 in 150 infected individuals) experience neuroinvasive disease (typically encephalitis, meningitis, or acute flaccid myelitis; U.S. Centers for Disease Control and Prevention, 2026; Vermont Department of Health, 2025q). Out of those severe neurological cases, 10% result in death (Vermont Department of Health, 2025p).
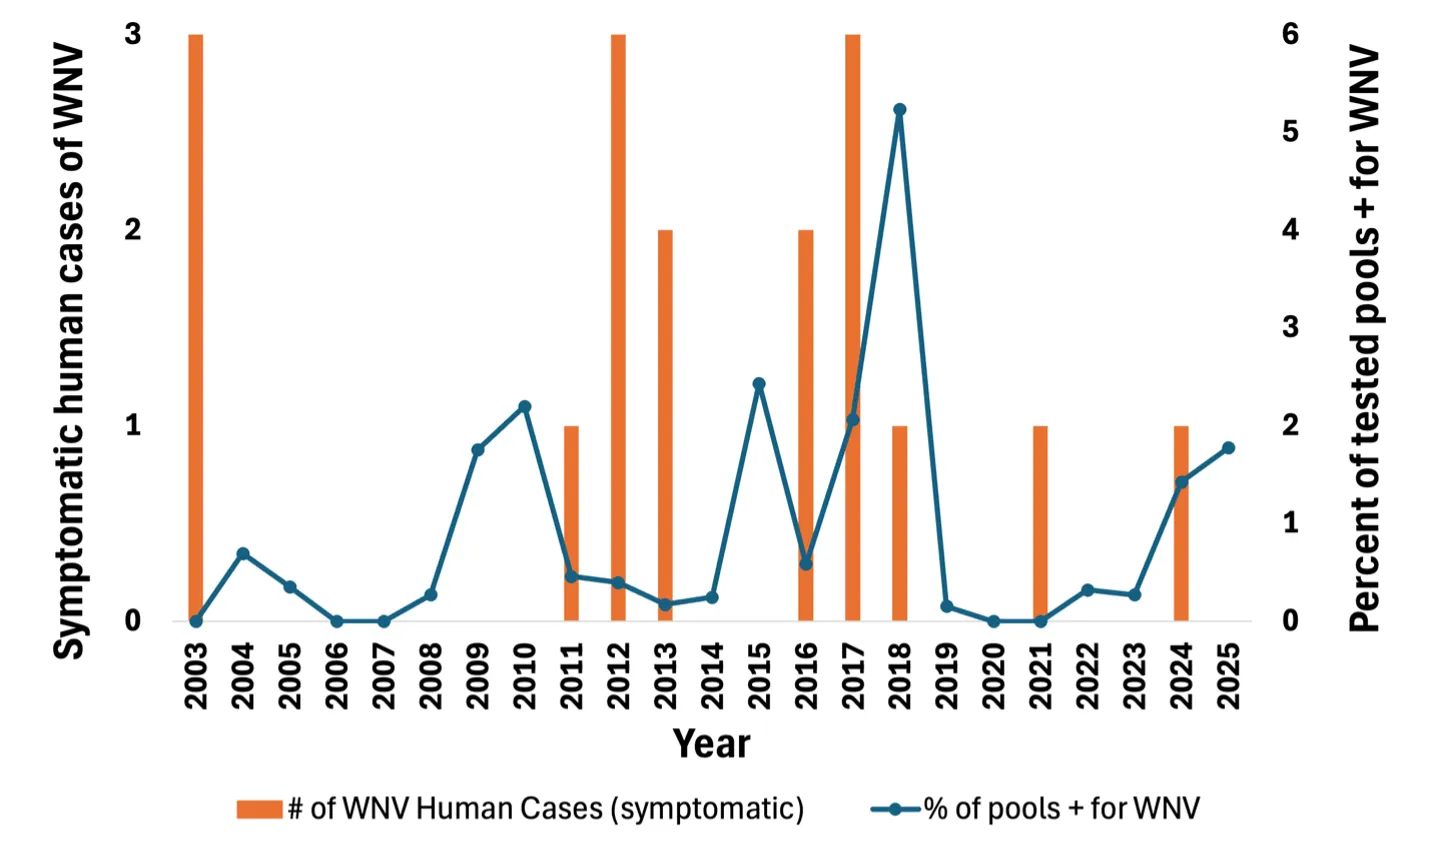
Source: Agency of Agriculture Food and Markets (2026); Vermont Agency of Agriculture, Food & Markets & Vermont Department of Health (2024); Vermont Department of Health (2025h, t)
Note: Human cases were counted from VDH-related sources. Cases from 2003–2023 were found in the Arbovirus Surveillance and Response Plan. Cases from 2024 were found in the 2024 Mosquito-Borne Virus Surveillance Report. Cases from 2025 were from the VDH website. The percent of pools that tested positive for WNV was taken from VAAFM’s annual Mosquito Surveillance Reports from 2023–2025.
Vulnerabilities (WNV)
Severe WNV disease is more common in people with reduced immune function or comorbidities like diabetes or hypertension (Vermont Department of Health, 2025p). Mortality rates for neuroinvasive disease are higher for patients aged 70 or older (20%) or those with certain immunodeficiencies related to treatments that deplete B cells, organ transplants, leukemia, lymphoma, and myeloma (Gould et al., 2025). People experiencing unsheltered homelessness are at increased risk of exposure because of more time spent outside, especially during mosquitoes’ peak activity, and are more likely to have conditions that increase their risk for severe disease (Ramin & Svoboda, 2009).
Eastern Equine Encephalitis (EEE)
Hazard & exposure (EEE)
Eastern Equine Encephalitis (EEE) virus can be transmitted to humans by mosquitoes in the Aedes, Culex, Ochlerotatus, and Coquillettidia genera (Vermont Agency of Agriculture, Food & Markets & Vermont Department of Health, 2024) that create a path from the reservoir (birds) to human hosts. EEE virus is believed to come to Vermont in cycles that relate to bird migration patterns (Oliver, 2025).
EEE antibodies indicate a past or current infection and were first detected in Vermont in 2010 in moose and deer (Mutebi et al., 2012). Vermont’s first outbreak of active illness was on an emu farm in 2011 (Saxton-Shaw et al., 2015). EEE was detected again in 2012–2015 and for a third time in 2023–2025 (Vermont Agency of Agriculture, Food & Markets & Vermont Department of Health, 2024; Vermont Department of Health, 2025t; Figure 10-20). In 2023, 14 mosquito pools tested positive, but there were no reported human cases (Vermont Department of Health, 2024c). In 2024, there were 86 positive pools and 2 reported human cases (Vermont Department of Health, 2025h). These were the first cases of EEE in Vermont in humans since 2012 (Vermont Department of Health, 2025h).
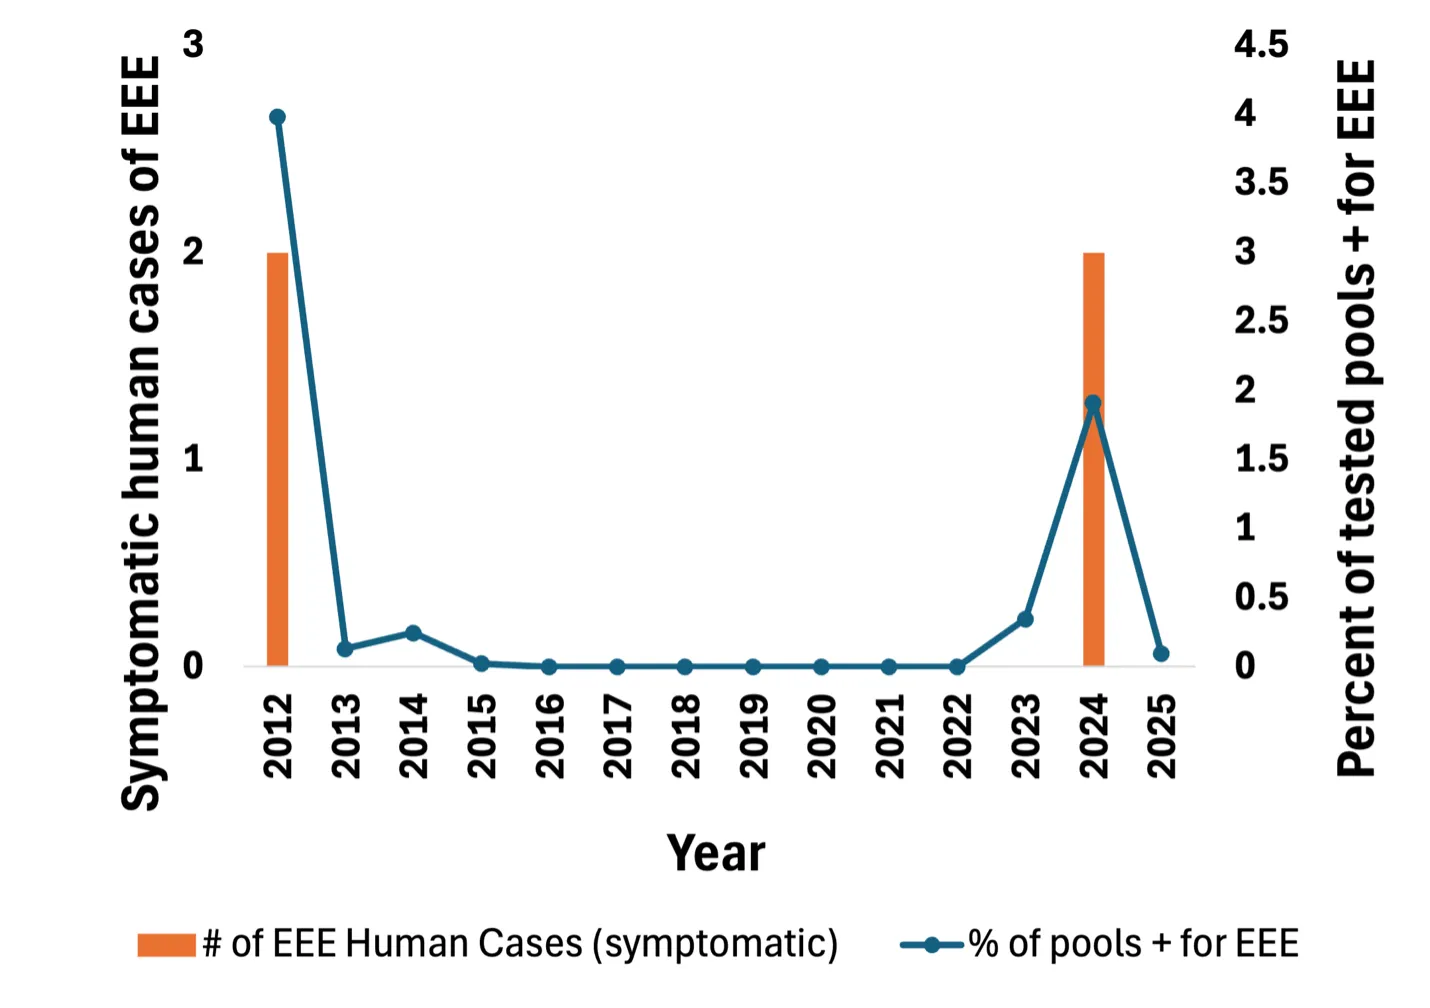
Source: Agency of Agriculture Food and Markets (2026); Vermont Agency of Agriculture, Food & Markets & Vermont Department of Health (2024); Vermont Department of Health (2025h, t)
Note: Human cases were counted from VDH-related sources. Cases from 2003–2023 were found in the Arbovirus Surveillance and Response Plan. Cases from 2024 were found in the 2024 Mosquito-Borne Virus Surveillance Report. Cases from 2025 were from the VDH website. The percent of pools that tested positive for EEE was taken from VAAFM’s annual Mosquito Surveillance Reports from 2023–2025.
Health effects (EEE)
Most human infections (96%) are asymptomatic (Banda et al., 2025) but symptomatic disease can cause fever, fatigue, myalgia, and arthralgia, or neuroinvasive disease leading to encephalitis or meningitis. The fatality rate for symptomatic cases ranges from 30–40% (Banda et al., 2025).
Vulnerabilities (EEE)
Immunocompromised people and people younger than five or older than 60 are more likely to have symptomatic EEE (Banda et al., 2025). Neuroinvasive case rates are about two times higher among males than females (Banda et al., 2025). The reason for this difference between sexes is unknown and could reflect differences in exposure or likelihood of experiencing symptoms once infected. In Vermont, human or animal cases of EEE have only occurred in five counties: Addison, Chittenden, Franklin, Orleans, and Rutland (Vermont Department of Health, 2025h).
Jamestown Canyon Virus (JCV)
Hazard & exposure (JCV)
Monitoring for Jamestown Canyon Virus (JCV) started in 2025 (Vermont Agency of Agriculture Food and Markets, 2025). It was first detected in mosquitoes in Rutland County (July 2025), and subsequently in Marshfield and Whitingham towns, and the first human case was confirmed in September 2025 (Windsor County) (Vermont Agency of Agriculture Food and Markets, 2025; Vermont Department of Health, 2025t; Vermont Department of Health & Vermont Agency of Agriculture, Food & Markets, 2025)
Health effects (JCV)
Symptoms typically include fatigue, fever, and headache, but severe disease can lead to encephalitis (U.S. Centers for Disease Control and Prevention, 2024c). Nationally (2011 to 2022), an average of 23 neuroinvasive cases were reported annually (U.S. Centers for Disease Control and Prevention, 2025g).
Vulnerabilities (JCV)
Information on vulnerabilities to JCV is limited. Vulnerabilities are likely similar to those for WNV and EEE, since the mechanism and health effects are similar.
10.6.3 What you can do
Tick-borne diseases
Individuals should take steps to prevent tick bites when recreating or working outside. These include avoiding forest edge habitat or walking in tall grass, wearing long sleeves and pants, treating outdoor clothing and gear with permethrin, using tick repellents, showering and checking for ticks after spending time outside, and checking outdoor pets for ticks (McCollough, 2018; see 10.13.4). When checking for ticks, special attention should be paid to the scalp, groin, neck, shoulders, and areas behind the ears (McCollough, 2018). Both the U.S. Environmental Protection Agency (EPA) and American Academy of Pediatrics state that use of DEET and picaridin are safe for children over 2 months of age (McCollough, 2018).
Ticks can be sent to VAAFM’s Passive Tick Surveillance Program to identify the species and life stage, but testing for pathogens is not performed.
Mosquito-borne diseases
Individuals should protect against mosquito bites with long clothing and insect repellent usage. Additionally, VDH recommends limiting time outdoors during dawn and dusk, when mosquitoes are most active, repairing gaps or holes in screens, and eliminating standing water (Vermont Department of Health, 2025s; see 10.13.4).
Reducing standing water, such as water that accumulates in flowerpots or other items around homes, is an easy way to reduce mosquito breeding sites. On farms, standing water collects in old tires used to weigh down tarps. To address this, VAAFM provides tire slicer equipment and training to farmers for free (Casey, 2025). The machine removes sidewalls, which are easier for farmers to use while reducing mosquito breeding sites (see 10.13.4).
Mosquito control districts work to reduce mosquito populations in collaboration with VAAFM and the Vermont Agency of Natural Resources using integrated pest management approaches (Lemon Fair Insect Control District, 2026; Otter Creek Watershed Insect Control District, 2011). These strategies include habitat management, insecticide application, biological controls, and human behavior modification (Lemon Fair Insect Control District, 2026). There are two mosquito control districts: the Otter Creek Watershed Insect Control District (Brandon, Goshen, Leichester, Pittsford, Proctor, and Salisbury), and the Lemon Fair Insect Control District (Bridgeport, Cornwall, and Weybridge) (Lemon Fair Insect Control District, 2026; Otter Creek Watershed Insect Control District, 2011; Vermont Agency of Agriculture, Food & Markets & Vermont Department of Health, 2024; Figure 10-21).
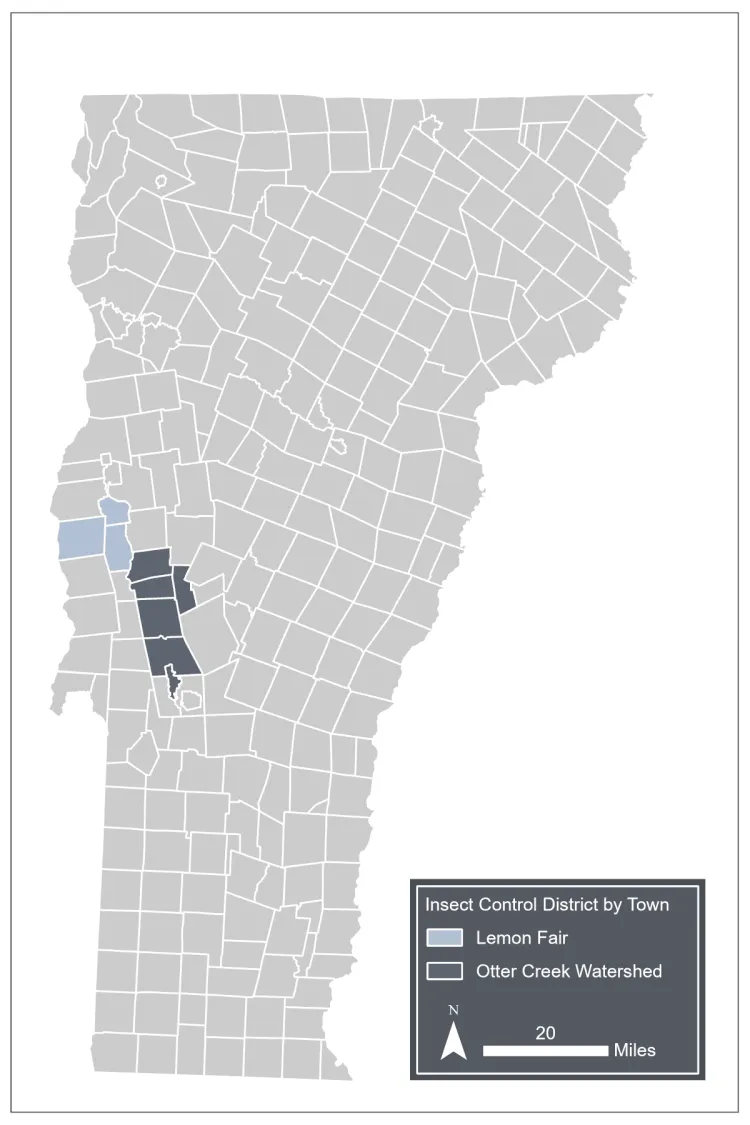
Source: Lemon Fair Insect Control District (2026); Otter Creek Watershed Insect Control District (2011); Vermont Agency of Agriculture, Food & Markets & Vermont Department of Health (2024)
Note: Data visualization by Hannah C. Turner
If the state determines that insecticide application is necessary to protect public health, VDH and VAAFM will follow the steps outlined in the Vermont Arbovirus Surveillance and Response Plan (Vermont Agency of Agriculture, Food & Markets & Vermont Department of Health, 2024). This plan includes communicating with relevant local stakeholders (e.g., municipal officials, health care providers, farmers, and veterinarians) and potentially spraying insecticides to control mosquito populations.
10.7 Water quality
Climate change affects water quality and quantity through higher temperatures and increased extreme weather events like flooding and drought (see Water Resources 4.3.3, 4.4, and 4.5). Climate and human health related water quality issues fall into two primary categories: 1) non-biological contaminants (e.g., nitrates and mercury) are themselves not biological, although they may have biological sources (e.g., nitrates from manure), while 2) biological contaminants (e.g., bacteria, protozoa) are living organisms or viruses that can have negative impacts on human health.
Flooding can increase exposure risk by spreading contaminants and damaging infrastructure. Flooding from Tropical Storm Irene (2011) led 30 public drinking water systems to issue boil water notices impacting around 16,590 people (Vermont Business Magazine, 2013). Flooding can release less common contaminants, like fuel from fuel tanks damaged by flooding. In the week following Tropical Storm Irene, the reporting of hazardous spills to state officials increased by a factor of 14 (Vermont Business Magazine, 2013; see 10.4.2).
Drought can affect water quality and quantity (see Water Resources 4.3.2; see 10.4.1), as water levels and streamflow decrease, pathogens and toxins can become concentrated. Water shortages can lead to decreased availability of water for hand-washing and other hygiene strategies that are important for preventing disease spread. For private well users, water shortages may dry up wells and require homeowners to pay for a water recharge, move wells, or dig the well deeper. Water conservation notices for those on town systems are a strategy for preserving water for essential uses like hygiene.
10.7.1 Non-biological contamination
The primary climate change–related non-biological water quality hazards in Vermont are nitrates and mercury. Other contaminants, such as fuel, can become a concern during flooding events, as noted above.
Nitrates/Nitrites
Nitrogen can be found in many organic and inorganic forms. This section focuses on two of them: nitrite (NO2) and nitrate (NO3), which are inorganic forms of nitrogen.
In surface waters, nitrate is the primary form of available nitrogen (Agency for Toxic Substances and Disease Registry, 2015). Nitrates can support the formation of cyanobacteria blooms (also known as HABs), although in Vermont, phosphorus is the primary limiting nutrient for cyanobacteria blooms (see 10.7.2). This section explores direct health effects from nitrate/nitrite contamination.
Hazard
Sources of nitrate/nitrite include sewage, fertilizer, and other organic matter but are also released from soil erosion (Vermont Department of Environmental Conservation, 2026a). Different bacterial species can convert nitrate to nitrite or vice versa. Some species of bacteria found in humans’ mouths and digestive tracts (enteric bacteria) can convert nitrate to nitrite (Tiso & Schechter, 2015).
If a septic system fails, or if a well is located near an agricultural field, nitrate/nitrite may leach into the well. Due to increased extreme precipitation events as well as warmer winters that lead to increased winter rainfall, agricultural runoff may increase and increase the risk of nitrate/nitrite contamination (see Water Resources 4.5.2).
Health effects
High levels of nitrites carry out an oxidation reaction in the body that prevents iron in blood from binding to oxygen molecules, leading to a condition called methemoglobinemia or blue baby syndrome (Chen & Nappe, 2025). Methemoglobinemia can lead to fatigue, nervous system effects including seizures, metabolic acidosis, coma, and, rarely, death (Chen & Nappe, 2025). In the U.S., there were six infant deaths from methemoglobinemia between 1979–1999 (Ward et al., 2018).
Based on concerns around methemoglobinemia, the EPA’s Maximum Contaminant Level (MCL) is 10 milligrams per liter (mg/L) for nitrates and 1 mg/L for nitrites, the same as the levels at which VDH recommends well owners treat their water (U.S. Environmental Protection Agency, 2025b; Vermont Department of Health, 2026c). However, VDH recommends taking action to improve water quality if the nitrate level exceeds 5 mg/L and the household includes an infant (Vermont Department of Health, 2026d).
Nitrate exposure may cause other health conditions, like cancer, but more research is needed. A review of research on nitrate/nitrite exposure and cancers found that it is associated with gastric cancer. For every 10 mg/L increase in nitrate exposure, risk of gastric cancer is 1.91 times greater than among people who were not exposed (Picetti et al., 2022). Other health conditions (e.g., colorectal or colon cancer, subclinical hypothyroidism, nervous system defects in utero) may also be related to nitrate exposure, but more research is needed (Ward et al., 2018). The Agency for Toxic Substances and Disease Registry states that it is unknown whether nitrate/nitrite can cause birth defects, and the International Agency for Research on Cancer classifies ingested nitrate/nitrite as a probable human carcinogen, though the EPA has yet to assess it (Agency for Toxic Substances and Disease Registry, 2017).
Exposure
As of 2015, about 39% of Vermonters got their drinking water from private wells (U.S. Environmental Protection Agency, 2013a). Private wells are not required to be regularly tested for nitrates, while public drinking water systems must be tested annually and have additional processing steps to manage nitrates if the levels exceed the allowable standard (Office of Ground Water and Drinking Water, 2021; Vermont Department of Environmental Conservation, 2026a). Because of this potential lack of regular testing, private well users may be at higher risk of nitrate exposure during floods (which increase nitrate runoff) or droughts (which can concentrate contaminants). Private wells with nitrate levels over the MCL are predominately in northwestern Vermont, according to data collected by VDH, and data is lacking for the southwest and northeast regions of Vermont (Vermont Department of Health, 2026d). The town with the highest percentage of wells over the MCL was Berkshire, where 5% of the 132 tested wells were over the MCL (Vermont Department of Health, 2026d). Nitrate levels in 34 Vermont municipalities, excluding Berkshire, exceeded the MCL in between 0.1 and 4% of tested wells (Vermont Department of Health, 2026d). Between 1999–2024, no tested public drinking water systems in Vermont exceeded the MCL for nitrates (Vermont Department of Health, 2026d).
Vulnerabilities
Infants, especially those under six months of age, are most at risk of acute poisoning. Infant mouths and stomachs are less acidic than adults, leading to higher bacteria loads that can convert nitrates into nitrites that can cause methemoglobinemia (Ward et al., 2018).
Mercury
Hazard
Mercury is a heavy metal that has been atmospherically deposited in water bodies throughout the northeastern U.S. due to emissions from coal power plants. With increased water temperatures, the rate of mercury methylation increases (Stager & Thill, 2010). Methylation is a chemical change that makes mercury easier for organisms to absorb into their tissues (more bioavailable). Flooding increases sediment delivery, including mercury. Flooding during Tropical Storm Irene (2011) may have contributed to the increase in mercury concentrations in Lake Champlain fish from 2011–2017, although other factors, like changing fish populations due to invasive species, play an important role (Swinton & Nierzwicki-Bauer, 2020; see Fish and Wildlife 5.4.1 and 5.5.1).
Health effects
Mercury impacts the kidneys and nervous system (U.S. Centers for Disease Control and Prevention, 2024g). High methylmercury exposure in utero can impair thinking, memory, and other cognitive processes in children (U.S. Environmental Protection Agency, 2015b). It can lead to symptoms like muscle weakness and impairment, vision loss, and a “pins and needles” feeling (U.S. Environmental Protection Agency, 2015b).
Exposure
Humans are primarily exposed to mercury through the consumption of fish. Eating too much or certain types of fish frequently can lead to unsafe levels of mercury exposure. VDH has developed species-specific “Vermont Safe Fish-Eating Guidelines” to support Vermonters in consuming safe levels (see 10.7.3).
In the 2007 regional total maximum daily load (TMDL) proposal to the EPA, which defines the maximum amount of a contaminant that can exist in a waterbody without impairing its use, 21 waterbodies in Vermont were listed as impaired due to mercury levels (McCarthy et al., 2007). As of 2024, segments of nine rivers were listed on Vermont’s 2024 Priority Waters List as impaired based on mercury concentrations in fish tissues: Poultney River, Lower Otter Creek, Little Otter Creek, Lower Dead Creek, LaPlatte River, Mississquoi River, Lamoille River, Winooski River, and Deerfield River (Vermont Department of Environmental Conservation, 2025; Figure 10‑22).
VDH has issued a specific fishing advisory for mercury for fish caught in the Deerfield River’s reservoirs or in the Connecticut River’s Comerford and Moore reservoirs. Vulnerable populations should not consume fish from these reservoirs, and individuals without vulnerabilities should not consume more than 16 ounces (oz) of these fish per month (Vermont Department of Health, 2025o).
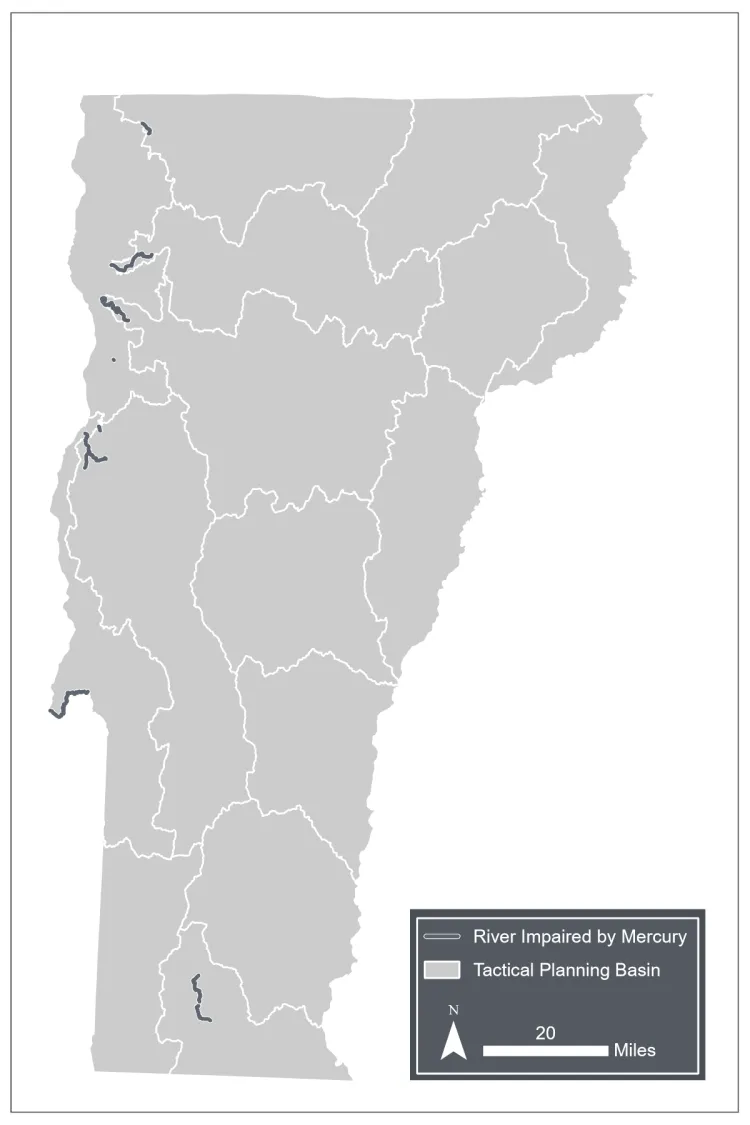
Source: Vermont Department of Environmental Conservation (2025); Vermont Department of Health (2025g)
Note: Data visualization by Hannah C. Turner
The Vermont Safe Fish-Eating Guidelines for other waterbodies bases the fish consumption guidelines for vulnerable groups on what the EPA considers safe amounts of methylmercury for fetuses and young children, 0.0001 mg/kg-day, and what the EPA considers to be safe for adults, 0.0003 mg/kg-day (Vermont Department of Health, 2025g). Different fish species have different levels of mercury, so they have different associated consumption recommendations (see 10.13.5).
Vulnerabilities
Groups that are especially vulnerable to the effects of mercury are people who are pregnant or nursing and children under the age of seven (Vermont Department of Health, 2025g).
10.7.2 Biological contamination
Biological water contamination includes the presence of harmful bacteria, parasites, viruses, and bacterial toxins. The connections between these biological contaminants and climate change varies. We will discuss cyanobacteria (blue-green algae) and water-borne pathogens in more detail below.
Cyanobacteria (blue-green algae)
Hazard
Cyanobacteria blooms, a type of HAB, are driven by nutrient runoff (especially of phosphorus) and temperature (see Water Resources 4.5.3 and 4.5.5; Figure 10‑23). Some cyanobacteria blooms lead to the production of cyanotoxins, but it is impossible to tell just by looking at the bloom if toxins are present.
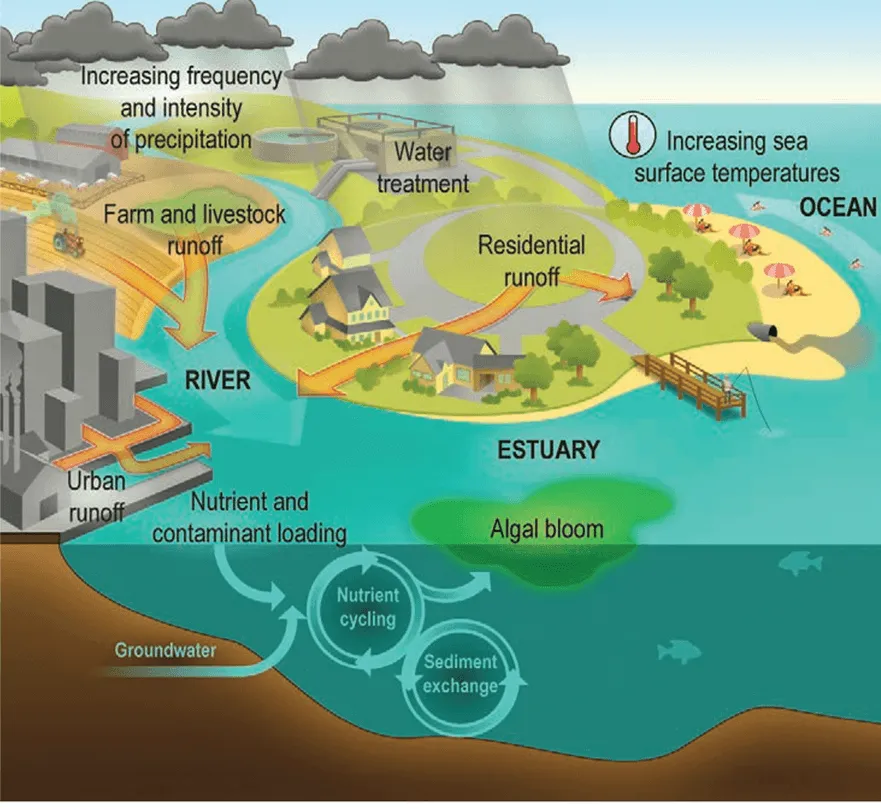
Source: Crimmins et al. (2016)
Health effects
There are six known types of cyanotoxins that cause human health effects when present in cyanobacteria blooms (Water, Sanitation, Hygiene, and Health WHO Team, 2021; Table 10-2). Public drinking water in Vermont has been consistently tested for microcystin and occasionally tested for cylindrospermopsins, and recreational water bodies have been tested for microcystins, anatoxins, and, occasionally, cylindrospermopsins. Overall, information on the chronic impacts of cyanotoxins is very limited and is an area of ongoing research.
Toxin | Health effects | WHO guideline value for recreation (μg/L) |
|---|---|---|
Microcystins (>250 variants) | Acute: liver damage Chronic: hepatic hypertrophy (liver enlargement); tumor promotion via phosphatase inhibition (IARC describes as “possibly carcinogenic to humans”) | 24
|
Cylindrospermopsins | Acute: mild skin irritation; liver, kidney, and erythrocyte (red blood cell) toxicity Chronic: genotoxic (limited animal and tissue studies) | 6 |
Anatoxins | Acute: neurotoxic effects as nicotinic receptor agonist (in humans, headache, confusion, and vision changes have been experienced; can be lethal to dogs) Chronic: no information | 58.8* *Provisional health-based reference value, not a guideline value
|
Saxitoxins | Acute: neurotoxic effects via ion channel blocking in neuronal and cardiac cells (twitching, convulsions, paralysis, impaired coordination, tingling, numbness, dizziness, vomiting, nausea, muscle weakness, diarrhea) Chronic: no sufficient information | 30 |
Anatoxin-a(S) (type of anatoxin) | Acute: neurotoxic effects through acetylcholinesterase inhibition (muscle weakness, convulsions, and respiratory distress that can lead to death) Chronic: no sufficient information | Not sufficient information to develop a guideline value, though New Zealand uses 1 microgram/L as a maximum level for drinking water |
Dermatoxins | Little information on dermatoxins produced by temperate cyanobacteria species. | No guideline value because exposure is through contact and not ingestion |
Source: Water, Sanitation, Hygiene, and Health WHO Team (2021)
Note: The WHO Guideline Value for Recreation is based on a 15kg child swallowing ≤250 mL of water
Exposure
In addition to exposure through swimming (ingestion or skin exposure), toxins from cyanobacteria blooms can aerosolize, so VDH has grouped different recreation activities by exposure risk (Table 10-3).
Level of potential exposure | Recreational activity | Primary exposure pathway of concern |
|---|---|---|
High | Swimming/wading Diving Water skiing/wake boarding Wind surfing Jet skiing | Ingestion Ingestion Ingestion/inhalation Ingestion/inhalation Ingestion/inhalation |
Moderate | Fish consumption Canoeing Paddle boarding Rowing Sailing Kayaking Motor boating | Ingestion Inhalation/skin Inhalation/skin Inhalation/skin Inhalation/skin Inhalation/skin Inhalation |
Low/none
| Catch and release fishing Hiking Picnicking Sightseeing | Skin Not applicable Not applicable Not applicable |
Source: Vermont Department of Health (2015)
To keep Vermonters safe while recreating, VTDEC, VDH, and the Lake Champlain Committee have developed the Cyanotracker map (Vermont Department of Health, 2026b; see 10.13.5). This online resource is continually updated with approved reports from VTDEC, trained volunteers, and members of the public. The reports are characterized by three alert levels. “Generally safe” means that there are no observable blooms, “low alert” means that some cyanobacteria have gathered but there are not wider bloom conditions, and “high alert” means that there is a large, dense bloom (Figure 10‑24). The reports are collected from all over Vermont and the number of reports per location varies, but the total number of reports is increasing. General guidance is to stay out of water when blooms are present.
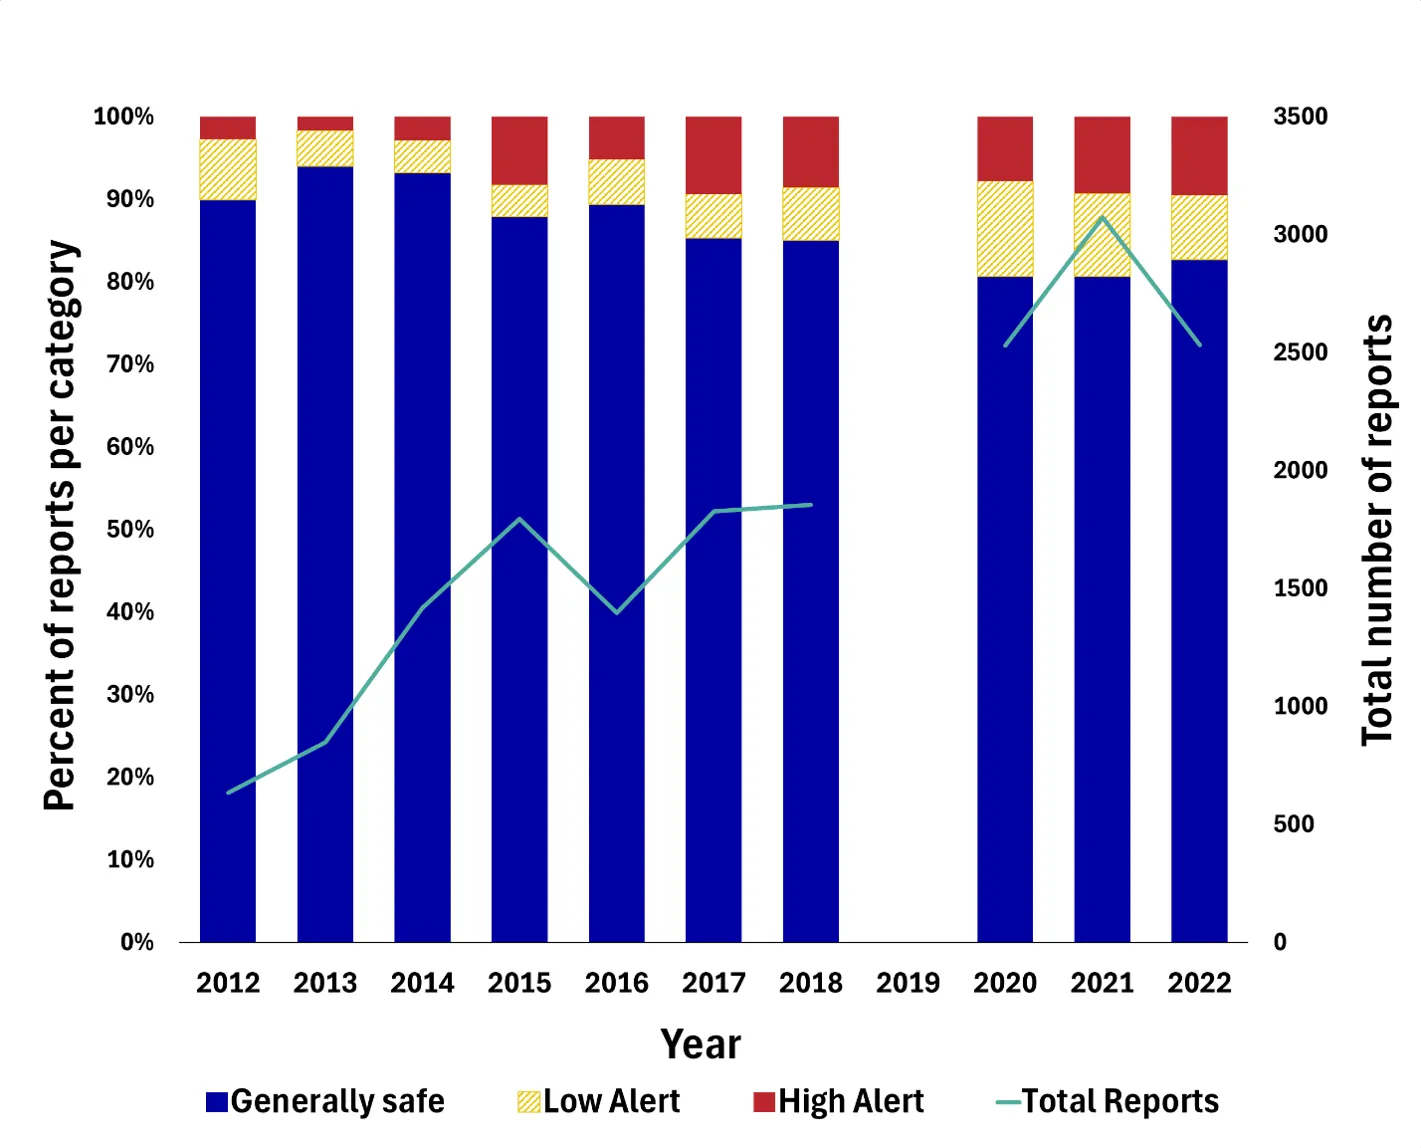
Source: Vermont Department of Health (2026a)
Note: Data from the VDH Cyanobacteria Tracker Season Summaries, 2012–2022; 2019 is excluded because the alert level data for reports is not available.
From 2021–2023, 31 public beaches on Lake Champlain (in New York and Vermont) were closed 4% of the days between Memorial Day and Labor Day due to cyanobacteria blooms (Lake Champlain Basin Program, 2024a).
Beginning in 2014, Vermont’s public drinking water systems have tested their raw (unprocessed) water for microcystin, a neurotoxin produced by some cyanobacteria (Vermont Department of Environmental Conservation, 2026c; Table 10-4). From 2014–2025, 13 raw samples had levels of microcystin over the current 0.3 μg/liter limit, while no finished (post-treatment) samples were over the limit. Samples are collected on a weekly basis for a period of around 12 weeks over the summer and fall, with annual totals ranging from 233 to 455 samples.
Year | Location | Sample collection date | Level(μg/L) |
|---|---|---|---|
2025 | Derby Center Water System | 9/8/25 | 0.31 |
2025 | Grand Isle Fire District 4 | 8/19/25 | 0.76 |
2024 | Alburgh Village Water System | 10/22/24 | 0.41 |
2024 | Alburgh Village Water System | 10/15/24 | 0.57 |
2024 | Grand Isle Fire District 4 | 10/8/24 | 1.9 |
2024 | Alburgh Village Water System | 10/1/24 | 0.4 |
2024 | Alburgh Village Water System | 9/17/24 | 0.32 |
2024 | Alburgh Village Water System | 9/10/24 | 0.5 |
2024 | Websterville Fire District 3 | 7/8/24 | 0.42 |
2021 | Alburgh Village Water System | 10/1/21 | 0.33 |
2021 | Alburgh Village Water System | 9/23/21 | 0.5 |
2021 | Thompson Pt Association | 8/10/21 | 0.74 |
2020 | Grand Isle Fire District 4 | 9/15/20 | 0.45 |
Source: Vermont Department of Environmental Conservation (2026c)
Vulnerabilities
Because children have smaller body masses and are more likely to accidentally swallow water while swimming, they are at higher risk of illness from cyanobacteria toxins.
Water-borne pathogens
Hazard
Pathogen contamination of water used for recreation and drinking is primarily caused by extreme precipitation events, which increase runoff of pathogens and nutrients (see Water Resources 4.5) and can lead to combined sewer overflow events. High levels of nutrients, like phosphorus, from runoff combined with increased temperatures can further exacerbate pathogen growth.
When wastewater treatment facilities are damaged or overwhelmed by too much water (e.g., floods; see Infrastructure 7.5.2), untreated sewage can be released into waterbodies used for recreation and drinking water. Facilities in Vermont have experienced flood-related damages. For example, Tropical Storm Irene damaged 17 municipal wastewater treatment facilities, though most issues were fixed within one week of the storm (Vermont Business Magazine, 2013). The flooding in 2023 impacted 33 wastewater treatment facilities; in Johnson, full repairs were estimated to take a year, and relocating the facility to an area less likely to flood is being considered (Robinson, 2023).
A more consistent concern is Escherichia coli (E. coli), a common water-borne pathogen that impairs 506 river segments in Vermont (Vermont Department of Environmental Conservation, 2025; Figure 10‑25). It is often used as an indicator of broader biological contamination from waste.
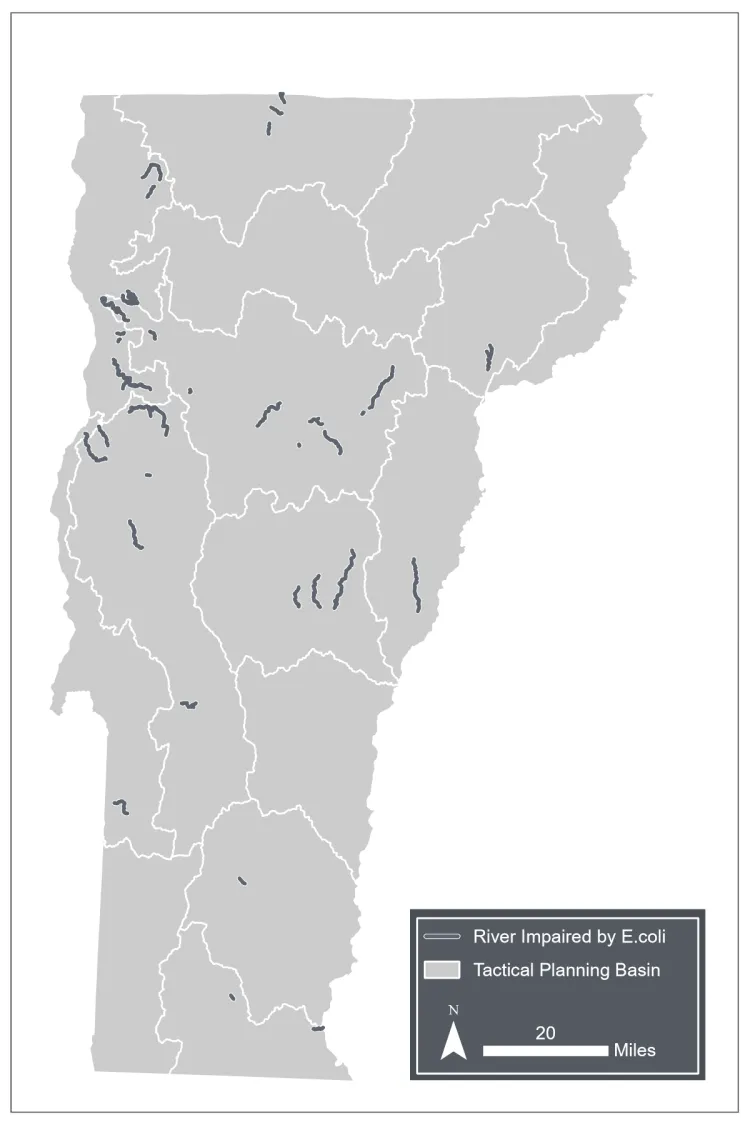
Source: Vermont Department of Environmental Conservation (2025)
Note: Data visualization by Hannah C. Turner
While pathogens can be found in some drinking water sources. Total coliform—a community of bacterial species that includes E. coli, and is also used as an indicator—was present in one-third of wells and two-thirds of springs tested in a study of Vermont private drinking water (Vermont Department of Health, 2025r). However, it should be noted that E. coli infection is not one of the primary waterborne diseases in the U.S. by case counts. A national analysis (2014) estimated that the top waterborne diseases by number of cases are otitis externa (swimmer’s ear caused by multiple pathogens), norovirus, giardiasis, and cryptosporidiosis (Collier et al., 2021; Table 10-5). This analysis looked at diseases associated with drinking water, recreation sources, and environmental exposure. In general, increased temperatures can increase the growth of some bacteria while leading to reduced loads of viruses and protozoa (specifically giardia and cryptosporidium), flooding can spread pathogens to both surface waters and groundwater, and drought can concentrate pathogens (Salubi et al., 2024; Semenza & Ko, 2023).
Pathogen | Climate change–related driver | Effect on pathogen |
|---|---|---|
Norovirus | Increased temperatures | Lowered viral load |
Heavy precipitation | Increased levels | |
Giardia | Increased temperatures | Reduced growth/die-off |
Flooding | Pathogen spread | |
Cryptosporidium | Increased temperatures | Reduced growth/die-off |
Flooding | Pathogen spread | |
Legionella species | Increased temperatures | Increased growth |
Staphylococcus aureus (common cause of otitis externa) | Flooding | Pathogen spread |
Source: Salubi et al. (2024); Semenza & Ko (2023)
Health effects
Most water-borne pathogens lead to gastrointestinal illness, but some lead to other symptoms (e.g., flu-like symptoms, neurological disorders, liver damage (Levy et al., 2018).
Exposure
Public drinking water systems treat water for pathogens, so the primary exposure pathways of concern are from contact with recreational waters and from consumption of well water.
Vulnerabilities
People under the age of five or over the age of 65 and those who are immunocompromised are at increased risk of serious illness from E. coli and other pathogens (U.S. Centers for Disease Control and Prevention, 2025b).
10.7.3 What you can do
Non-biological contamination
Nitrates
Private well owners concerned about nitrates can have their wells tested through the VAAFM Groundwater Monitoring Program or order a testing kit from the Health Department Laboratory. See the VDH website “How to test your drinking water” for guidance on self-testing drinking water from wells (Vermont Department of Health, 2026c; see 10.13.5). Testing after a flood, during drought, and after a drought is especially important, as these changes in water supply are periods of increased risk. VDH recommends that private well owners test for nitrates/nitrites every five years.
Supporting farmers in water quality conservation practices that reduce nutrient runoff (e.g., cover cropping, reduced tillage, and riparian buffers) will reduce nitrate contamination. Farmers can refer to the Vermont Nitrate Leaching Index on the Vermont Open Geodata Portal to evaluate their leaching risk (Vermont Center for Geographic Information, 2025).
Mercury
Individuals should follow VDH’s Vermont Safe Fish-Eating Guidelines and waterbody-specific advisories when consuming fish caught in Vermont. Find resources on safe fish consumption from the VDH website “Mercury in fish” page (Vermont Department of Health, 2025o; see 10.13.5). Multilingual public communication can help promote safe fish consumption among anglers and those that they share their catch with.
Biological contamination
Individuals should check VDH’s cyanobacteria tracker map before swimming to avoid HABs. If a beach is marked with signage that indicates high levels of E. coli or cyanobacteria, keep people and pets out of the water. Conditions can change rapidly, so it is important to know what cyanobacteria blooms look like so they can be avoided if present. When in doubt, stay out of the water. Generally, after heavy rainfall, it’s recommended to stay out of surface waters for 2–3 days. Private well owners are recommended by VDH to test annually for bacteria.
Vermonters can support cyanobacteria monitoring efforts by becoming a monitoring volunteer through VTDEC or Lake Champlain Committee. Vermonters can help reduce runoff by learning about green stormwater infrastructure (e.g., rain gardens) or participating in the “raise the blade” initiative (Lake Champlain Basin Program, 2024b).
Box 10-3: 10 years of the Vermont Clean Water Act
The Vermont Clean Water Act was passed in 2015 in response to increasing public concern about cyanobacteria blooms and the overturn of the 2011 total maximum daily load (TMDL) for phosphorus for Lake Champlain. The Vermont Clean Water Act strengthened requirements for phosphorus runoff prevention, developed new programs, and allocated more funding to this work across sectors. It sought to reduce runoff from a variety of sources, from urban areas to agricultural fields.
Between July 2015 and June 2023, 84% of the reductions in phosphorus pollution in both Lake Champlain and Lake Memphremagog were due to agricultural conservation practices. In June 2023, the reduction was 57.3 metric tons per year (MT/year); this is 27% of what is required to achieve the new TMDL by its 2036 target year.
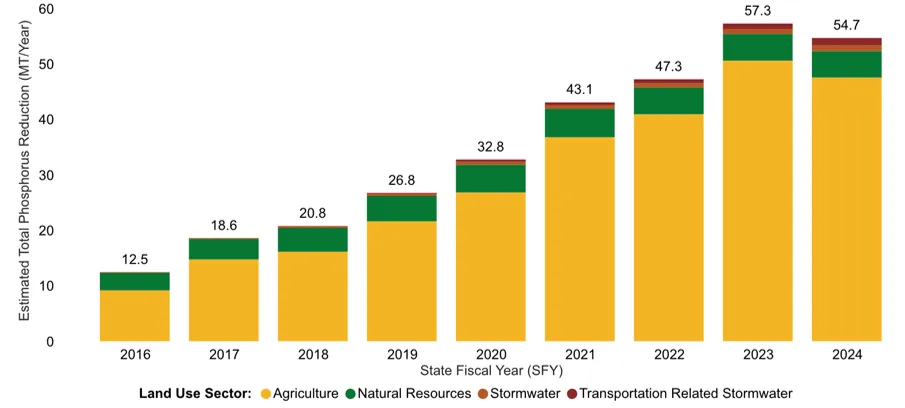
Source: Vermont Department of Environmental Conservation (2026b)
10.8 Food security
Food security means that individuals, “have physical and economic access to sufficient safe and nutritious food that meets their dietary needs and food preferences for an active and healthy life” (World Bank, 2026). Climate change can impact multiple aspects of food security, from threatening food safety and nutritional quality to creating physical and economic barriers to food through extreme weather events and changing growth regions for different crops (Tchonkouang et al., 2024; Figure 10‑26; see Agriculture and Food Systems 6.6.3).
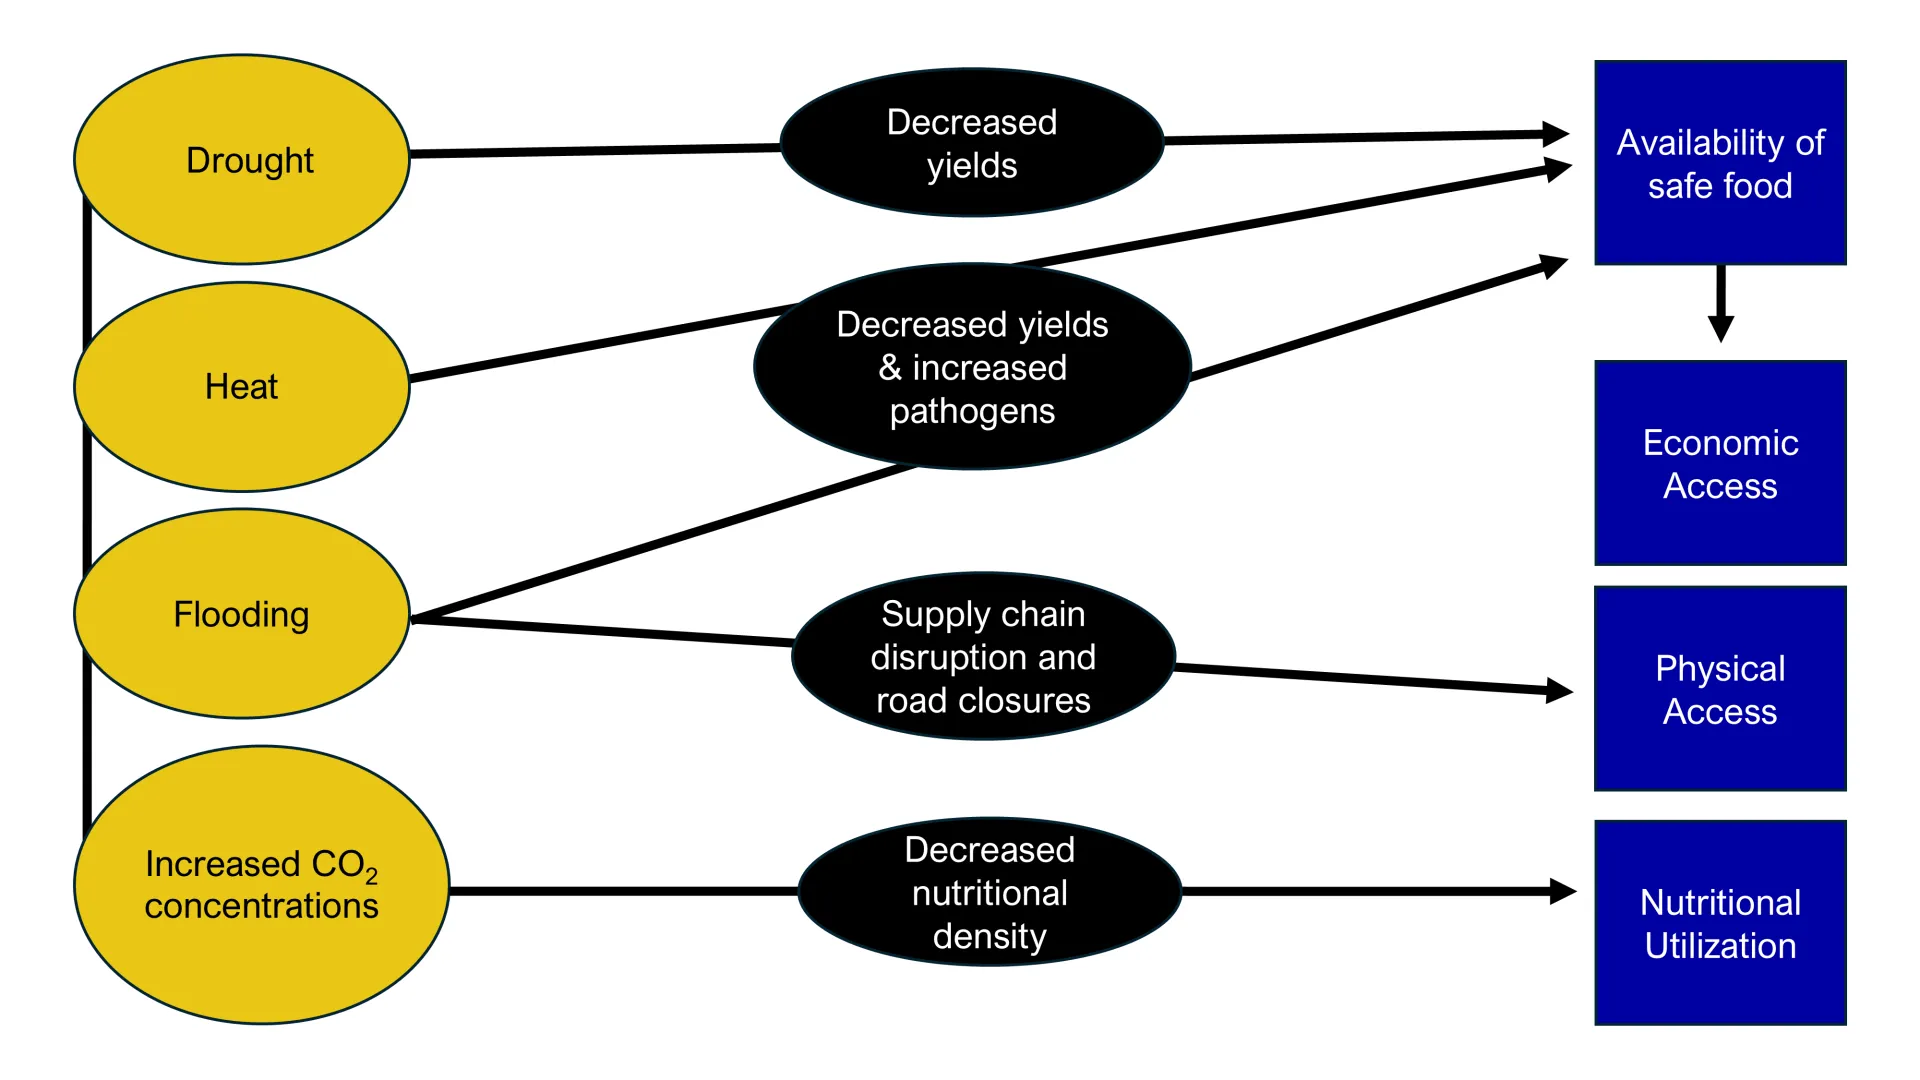
Source: This chapter
Many of the drivers of food insecurity relate to social factors like where people live, their income, and their access to health care—factors known as social determinants of health (Hunger Free Vermont, 2026; see 10.10). Health care costs are a driver of food insecurity and a determinant of health; for example, it is not uncommon for low-income families and individuals to have to choose between paying for medical care or buying nutritious food. To make matters more complicated, some of these factors exist in positive feedback loops: food insecurity can lead to diet-related illnesses, which can increase health care costs.
While climate change is very likely not a major driver of food insecurity or diet-related illnesses in Vermont, climate change impacts indirectly interact with existing drivers like poverty. According to Hunger Free Vermont, two in five people in Vermont were at risk of experiencing hunger as of 2022 (Hunger Free Vermont, 2026), and as of 2023, food insecurity rates in Vermont counties ranged from 10.3% to 15.9% (Figure 10‑27). Globally, between 2010 and 2050, inflation-adjusted prices of wheat, rice, and corn have been predicted to increase by 31–106% due to climate change and other factors, and higher prices are associated with greater food insecurity (Myers et al., 2017). In 2023, 123.7 million more people across 124 countries were experiencing food insecurity due to climate change and the increase in extreme weather events, compared to the period 1981–2010 (Romanello et al., 2025). This section outlines the status of food security and associated health outcomes in Vermont and the ways in which climate change may affect barriers to food security.
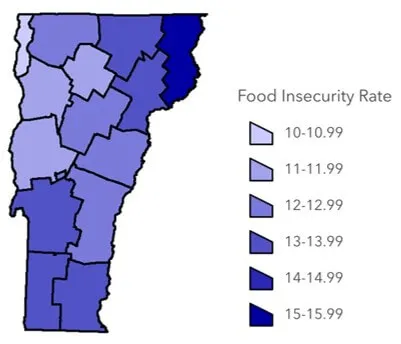
Source: Feeding America (2026)
Food insecurity can overlap with environmental justice concerns to create compounding vulnerabilities for individuals who are marginalized on the basis of race, income, and gender (Ren et al., 2023). In 2022, 16% of Black, Indigenous or People of Color Vermonters always, usually, or sometimes did not buy enough food and did not have enough money to buy more, in comparison with 6% of white, non-Hispanic Vermonters (Vermont Department of Health, 2024a).
It is important to note that food security status can drive or be affected by non-market food procurement (e.g., hunting, fishing, trapping, gathering, raising livestock, food preservation, gardening; Bliss et al., 2025). More research is needed to understand the ways in which these activities, classified as home or wild food procurement (HWFP), are affected by and affect food insecurity. Food insecure households in Maine and Vermont during the spring and early summer of 2021 were more likely to use, and to plan to continue to use, HWFP compared to food secure households, indicating that food security status might drive HWFP activity (Niles et al., 2021). More than half (66%) of all Vermont respondents reported engaging in some HWFP food activities since the start of the COVID-19 pandemic, demonstrating their broad popularity across socioeconomic statuses (Niles et al., 2021).
10.8.1 Food availability & economic access
Hazard and exposure
Climate change affects the growing regions for different crops, making some foods easier or harder to grow in different areas (see Agriculture and Food Systems 6.3.1). Despite being an agricultural state, the majority of the food that Vermonters consume comes from other parts of the world; in 2022, local food purchases only accounted for 10.1% of the money spent on food in Vermont, although this was a greater percentage than any other state in New England (New England Feeding New England, 2026). Global changes in food production and global supply chain disruptions from extreme weather events may impact food prices (Tchonkouang et al., 2024).
The summer 2023 floods affected local food availability through food banks. Many of the farms at the Intervale Center provide produce to the Center’s food access programming, but a lot of their produce was lost to floodwaters. The Food Access Manager at the Intervale was quoted “All these farmers make my programming possible and allow us to feed, like, upwards of 1,000 people every week, just because there’s so much surplus,” (Tanier, 2023). Flooding also destroyed food stored at the Montpelier Food Pantry (Tanier, 2023).
The nutritional quality of foods (protein and mineral concentrations) may decrease due to rising CO2 concentrations, although many factors impact nutritional quality (e.g., soils, genetics, local climate) (Soares et al., 2019).
Health effects
As climate change affects food supply chains and prices, it has the potential to indirectly impact the prevalence of different health outcomes, such as poor nutrition, CVD, and stress.
Poor nutrition leads to over 600,000 deaths per year in the U.S. (U.S. Department of Agriculture Food and Nutrition Service, 2022). VDH’s 3-4-50 campaign highlights the impact of three behaviors (poor diet, no physical activity, and tobacco use), that lead to four diseases (cancer, heart disease and stroke, type 2 diabetes, and lung disease) that result in over 50% of deaths in Vermont (Vermont Department of Health, 2024d). Approximately 16% of food insecure Vermonters have CVD and 44% have hypertension, while only 8% of food secure Vermonters have CVD and 31% have hypertension (Meddaugh, 2024; Figure 10‑28). Vermonters with hypertension who are also food insecure are about twice as likely to have three or more co-occurring chronic diseases compared to food secure Vermonters with hypertension (Meddaugh, 2024).
Rates of stress are higher among food insecure Vermonters: in 2020, only 13% of food secure Vermonters reported poor mental health, while 45% of food insecure Vermonters reported poor mental health (Meddaugh, 2023b). Stress has a variety of health impacts, including increasing inflammation which increases risk of CVD (Meddaugh, 2024).
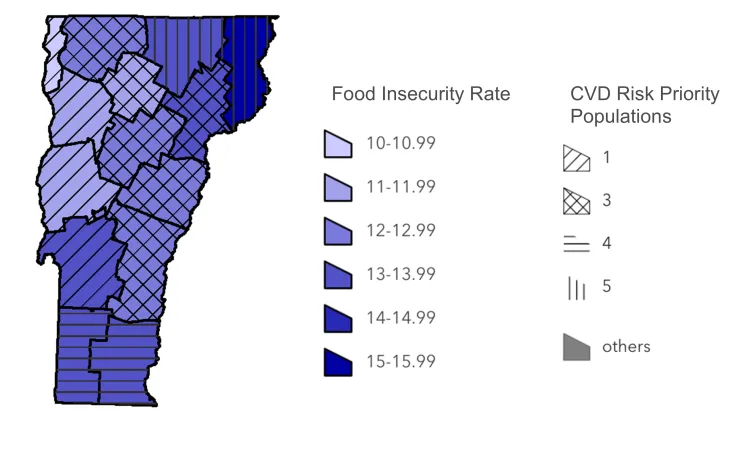
Source: Feeding America (2026); Meddaugh (2023a)
Note: CVD Risk Priority populations include those identifying as Indigenous, those identifying as sexually or gender diverse, those with any disability, those living in households with low annual incomes, and those experiencing poor mental health
Vulnerabilities
Forty percent of Vermonters are already at risk of hunger (Hunger Free Vermont, 2026) and low-income Vermonters are especially vulnerable to changes in food prices. In 2022, 24% of Vermonters making less than $25,000 annually were food insecure, meaning they reported that “in the past year they have always, usually or sometimes bought food that did not last and did not have money to get more” (Behavioral Risk Factor Surveillance System 2022 Report, 2024). Women and Black, Indigenous, and People of Color are more likely to be food insecure (Ren et al., 2023).
Vermonters who grow their own food are at increased risk of food insecurity due to climate change. In 2023, the food security of 100 families in the New Farms for New Americans program was threatened by flooding at the Intervale Center. The program provides land for refugee and immigrant families to grow crops, supporting food security and access to culturally significant foods (Cho, 2023).
10.8.2 Physical food access
Hazard and exposure
Due to extreme weather events (e.g., flooding; see 10.4.2), Vermonters may face physical barriers to food access, including loss of personal transportation to reach stores, road washouts, and grocery store closures (see Infrastructure 7.3.1). In Johnson, Vermont, the closure of Sterling Market after the July 2023 floods left the town without a full grocery store for almost two years, making it difficult to purchase fresh produce (Calvin, 2025).
Health impact
Short-term barriers to food access can result in mental health impacts. A study of Harris County, Texas following Hurricane Harvey found that food access disruption was the category most associated with well-being impacts; residents described: “feeling distant,” “[having] difficulty with daily tasks,” and “[lacking] safety” (Dargin & Mostafavi, 2020). Longer term barriers to access may make it harder to purchase perishable goods, including fresh produce, that are often important for a balanced diet. Feelings of anxiety and depression can be driven by a variety of other climate change–related hazards, too (see 10.9.1).
Vulnerabilities
Rural Vermonters travel greater distances to access food (Ren et al., 2023) so may experience greater barriers to food access.
10.8.3 Foodborne diseases
Hazard
Foodborne illnesses (viral, bacterial, or parasitic) are commonly spread through the consumption of contaminated food. The most common foodborne illnesses in Vermont are Campylobacter, Cryptosporidium, E. coli, norovirus, Salmonella, and Shigella (Vermont Department of Health, 2026a). Nationally, norovirus, Campylobacter, Salmonella, Listeria, and STEC (Shiga toxin-producing E. coli) cause the most hospitalizations and the most deaths (U.S. Centers for Disease Control and Prevention, 2025f). There is still debate about which specific foodborne pathogens will be most affected by climate change (Lake & Barker, 2018a).
Exposure
Climate change may affect rates of foodborne disease through increased temperatures, increased precipitation, and flooding. Increased temperatures and moisture facilitate increased growth of foodborne pathogens, and increased temperatures during the summer months were associated with increased hospitalizations for gastrointestinal illness—especially from bacterial pathogens—in New York (Lin et al., 2016). Flooding can pose food safety risks by spreading pathogens and causing power outages that disrupt refrigeration, allowing pathogens to grow (Marx et al., 2006). At 41°F (5°C), pathogens can replicate enough within two hours to cause gastrointestinal illness if consumed (Marx et al., 2006). During the July 2023 floods, the number of Vermonters affected by power outages peaked at just under 11,000 on the evening of July 10th (VTOutages, 2025; see Energy 8.4.1).
Food production changes in response to other effects of climate change (e.g., switching animal breeds, moving livestock indoors), may affect the transmission and prevalence of foodborne diseases (Lake & Barker, 2018a; see Agriculture and Food Systems 6.6.1).
Health effects
Foodborne illnesses typically cause gastrointestinal illness, with symptoms including vomiting, loose and/or bloody stool, and dehydration. Especially among people who are immunocompromised, there is a risk of the pathogen spreading to other areas of the body. An invasive Listeria infection, for example, can cause fever and flu-like symptoms, but can also lead to more dangerous conditions like sepsis, inflammation in the brain (encephalitis), or inflammation in other areas of the central nervous system (meningitis; Pogreba-Brown et al., 2022; U.S. Centers for Disease Control and Prevention, 2025d). Across the U.S., the top seven foodborne pathogens caused 931 deaths in 2019 (U.S. Centers for Disease Control and Prevention, 2025f).
Vulnerabilities
Precipitation had a stronger correlation with gastrointestinal illness in other groups: non-Hispanic, white, and male individuals (Lin et al., 2016). These different relationships between environmental variables and populations may be due to different diets or behaviors among the different groups. For example, if one population was more likely to consume certain higher risk foods or engage in poor food safety practices (e.g., washing raw meats, storing food that needs refrigeration at room temperature for long periods), that would make them more vulnerable. These findings demonstrate that climate-related variables driving foodborne illness may impact different sociodemographic groups differently.
The CDC describes pregnant people and those with weakened immune systems due to illness, treatment, or age (under five or over 65) as being at higher risk of food poisoning (U.S. Centers for Disease Control and Prevention, 2025c).
10.8.4 What you can do
To learn more about food system transformation across Vermont, see Agriculture and Food Systems 6.8. Information that is specific to the above sections is below.
Food availability and economic access
Many programs support food access in Vermont, such as food banks, gleaning programs, free community supported agriculture (CSA) programs for people who are food insecure and/or have diet-related illnesses, the Supplemental Nutrition Assistance Program (SNAP), and Vermont’s universal school meals program. The universal school meals program began in 2020, and was extended indefinitely in 2023 (Kinzel & McCullum, 2023). Hunger Free Vermont reports that the program saves families $1,500 per child per year (Horton, 2025).
To reduce the effects of global supply chain changes and disruptions on Vermonters’ food security, the Vermont Farm to Plate Network—in partnership with VAAFM and others—has created a 2021–2030 Strategic Plan to increase local food production and consumption (The Farm to Plate Network, 2021). New England Feeding New England, an initiative supported by Vermont Farm to Plate Network, has set a goal for 30% of the food consumed in New England to be produced in New England by 2030 (New England Feeding New England, 2023).
Physical food access
Ensuring physical access to food during high precipitation events relies on flooding mitigation and adaptation in infrastructure (see Infrastructure 7.3.1, 7.3.2, and 7.4.1 and Water Resources 4.4.6). See Box 6-7 in Agriculture and Food Systems 6.6.3 for information about the Vermont Emergency Eats program, which supported food insecure Vermonters impacted by the 2023 floods.
Foodborne diseases
Knowledge and implementation of proper food safety practices are essential for preventing the spread of foodborne illnesses. However, even when public health agencies communicate these practices, consumers may not always follow them. For example, an ethnographic study in the U.K. found that many consumers believed that washing raw chicken is a health-protective practice, even though it increases the risk of Campylobacter infection (Jackson & Meah, 2018). Determining effective food safety education methods will support consumers’ health.
Individuals looking for a comprehensive food safety guide for home cooks should explore the U.S. Department of Agriculture’s Kitchen Companion: Your Food Safety Handbook, which is freely available online and contains information about safe food preparation and storage (U.S. Department of Agriculture, 2015).
Additionally, interventions in the early stages of the supply chain can reduce the risk of foodborne diseases, such as increasing and streamlining surveillance for foodborne diseases in production and processing, connecting zoonotic disease surveillance with foodborne pathogen surveillance, and addressing the growing issue of antimicrobial resistance (Lake & Barker, 2018a; see Agriculture and Food Systems 6.6.1).
Box 10-4: Food security screenings & interventions at the UVM Children’s Hospital
Written by: Keith Robinson, University of Vermont Medical Center
Screening for food security is recommended by the American Academy of Pediatrics, Center for Medicare and Medicaid Services, and the American Hospital Association. However, the United States Preventive Services Taskforce (USPSTF) reported that there is insufficient evidence to recommend screening for food insecurity in the primary care setting, and the risk-benefit analysis could not be determined.
In Vermont, many hospitals and primary care offices use the Hunger Vital Sign to screen for food insecurity. In 2012, UVM Children’s Hospital began screening for food insecurity in the inpatient pediatric unit. In 2017, the hospital formed an interprofessional team that included patient advisors to improve screening rates and interventions for food insecurity. Training about food insecurity was provided to care team members to ensure confidentiality and maintain patient trust. UVM Children’s Hospital formed partnerships with the Vermont Foodbank, Hunger Free Vermont, Vermont 211, and Feeding Champlain Valley to ensure patients were connected to local resources after leaving the clinical setting.
UVM Children’s Hospital has since expanded screening for food insecurity to all primary care offices, specialty clinics, and inpatient units. Patients and families facing food insecurity are provided food shares or gift cards to local grocery stores. Additionally, patients and families are matched with social workers and case management support to screen for other social drivers of health and connect to local agencies as needed. UVM Children’s Hospital uses data from food security screening in population health initiatives aimed at improving access, reducing cost, and improving health outcomes.
Screening for food insecurity also expanded throughout Vermont’s pediatric and family medicine primary care practices in 2018 through a quality improvement initiative led by the Vermont Child Health Improvement Program (VCHIP) at UVM. The initiative trained primary care offices about social drivers of health, defined screening measures, and improved screening rates for social drivers of health. VCHIP championed the use of the Hunger Vital Sign and connections to community resources.
In 2024, OneCare Vermont and VDH helped to standardize data elements in electronic health records for social drivers of health screening. This provides an opportunity to understand current screening practices, access to community resources, and the health impacts to address the USPSTF statement.
10.9 Well-being, identity, and livelihoods
Climate change in Vermont is reshaping more than weather: it is transforming the rhythms of seasons, the stability of communities, the character of landscapes, and the ways people live, work, and connect. Many Vermonters’ identities, livelihoods, recreational activities, and social cohesion are deeply rooted in seasonal cycles—winter snow, maple sugaring, summer tourism, and fall foliage. As climate change disrupts these cycles, the effects extend beyond immediate physical hazards to influence mental health and well-being, identity and sense of place, and livelihoods.
10.9.1 Mental health
Hazard
Vermont’s climate hazards to mental health and well-being include the discrete risks outlined in prior sections of this chapter, yet, for some, these risks are compounded by the persistent awareness of a changing climate and the anticipation of worsening impacts—both at home and globally. This chronic background stress can shape daily decision-making, outlook, and sense of security.
Health effects
The mental health impacts of these hazards can be both acute and chronic. Acute effects include strong emotional responses (e.g., sadness, despair, anger, fear, hopelessness, stress), heightened anxiety, insomnia, and panic during extreme events. For example, Vermonters that regularly recreate outside may experience a mix of these negative emotions if they are suddenly and unexpectedly unable to participate in those activities due to extreme heat or wildfire smoke. Chronic exposures may cause depression, eco-anxiety, post-traumatic stress, and long-term stress-related disorders (American Psychological Association & ecoAmerica, 2017), all of which can lead to increased alcohol and drug use, increased ideation of suicide, suicide attempts, and deaths (Cunsolo & Ellis, 2018).
One writer expressed some of these emotions upon leaving Vermont after 22 years. She reflected,
Although my desire to leave has nothing to do with weather, I’m surprised that seeing winters diminish has left me with a feeling of sorrow. It’s like watching a big, strong man—Old Man Winter, I suppose—become erratic, frail and more vulnerable with time (Harrington, 2024).
Similarly, a college student shared,
In one view, the best parts of winter will be lost, while the worst parts will stick around. I think it’s gonna be dark, muddy, the leaves still won’t be here, and all in all it’ll be a more depressing experience (Kostelnik, 2024).
Chronic stress has been linked to lowered immune system function, which increases vulnerability to other illnesses (Morey et al., 2015), disruption of normal sleep patterns and increased prevalence of sleep disorders (Han et al., 2012). Stress is a known risk factor for developing CVD, and short-term emotional stress can trigger cardiac events in people with existing disease (Steptoe & Kivimäki, 2012).
Exposure
Exposure to mental health hazards can occur in advance of, during, and after climate change–related events (Hayes et al., 2018). Exposure depends on geographic location, socioeconomic status, and daily activities, and mirrors the same exposures as the relevant discrete health threats discussed in previous sections. For example, rural and semi-rural residents along rivers, floodplains, or steep terrain are more likely to experience repeated disruptions to daily life from flooding, including road closures, power outages, and limited access to medical care. People who are unhoused and those living in poorly insulated homes without air conditioning are more exposed to heat waves, which can exacerbate stress and disrupt sleep.
Individuals working outdoors, such as those in agriculture, construction, and forestry, face repeated exposure to extreme heat, unpredictable precipitation, and freeze–thaw instability, contributing to cumulative stress and impacts on mental health. Even those not exposed to direct threats experience secondary exposure: for example, loss of tourism revenue (see Outdoor Recreation and Tourism 9.2.2) or school closures due to flooding may increase financial and social stress (see 10.10.2).
Exposure to news and media regarding climate change can impact mental health. “Doomscrolling,” or habitual consumption of large amounts of media for an extended period of time, often on a phone or mobile device, is linked to higher levels of climate anxiety and stress (Dominguez-Rodriguez et al., 2025). In Vermont, coverage of climate change increased from 1.0% to 2.6% of total news coverage from 2012–2017, the highest national level of climate change news coverage (Bromley-Trujillo et al., 2023). Climate change–related news coverage does not inherently result in negative mental health impacts (in fact, it can promote awareness and positive civic engagement), but overconsumption of climate change–related media can have negative impacts on mental health, especially for young people (Parnes et al., 2024).
Vulnerability
Individuals with pre-existing mental health conditions, disabilities, or chronic illnesses face amplified risks during extreme events. Older adults, particularly those living alone or with limited social support, are vulnerable to isolation. Families with low income or limited insurance may experience greater anxiety about property damage, temporary displacement, or long-term recovery. Stress caused by climate change compounds on top of everyday concerns, so those already experiencing other forms of stress in their lives may be more vulnerable to breaching a tipping point that would onset new challenges, like substance abuse or depression (American Psychological Association & ecoAmerica, 2017).
Repeated climate events can lead to “psychological cumulative burden,” where anxiety, grief, and uncertainty compound over time. Vermont-specific examples include communities that experienced consecutive flooding events on the same day—July 10—in 2023, 2024, and 2025. One Vermonter, whose yard, barn, and basement were destroyed by the 2023 floods, shared, “There’s this anxiety when they talk about rain. It makes you want to shut off the TV and run away. It sets off that feeling that, ‘Oh my god, are we going to go through this again?’” (Malinak, 2024). An official with the Northeast Kingdom Human Services told Vermonters, “There’s no shame in being stressed out right now. We really just need to normalize that” (Malinak, 2024).
10.9.2 Identity and well-being
Hazard
Many people associate Vermont with a certain type of winter. In a piece for UVM’s Headwaters Magazine, California-born UVM student Valentin Kostalnik wrote “Winter in Vermont is a special thing in the United States: like the winds in Chicago, it’s a defining characteristic” (Kostelnik, 2024).
Climate hazards in Vermont threaten cultural practices, livelihoods, and seasonal activities central to identity and well-being. Maple sugaring, a centuries-old tradition, now begins approximately 8 days earlier and ends 11 days earlier than it did 40 years ago (Cotnoir, 2021; see Agriculture and Food Systems 6.4.5). Winters are shorter, snowpack is declining, and freeze–thaw cycles are less predictable, compromising winter sports, ice fishing, and snowmobiling (see Outdoor Recreation and Tourism 9.3.3). Disruptions to summer recreation and tourism also threaten livelihoods and social traditions (see Outdoor Recreation and Tourism 9.4 and 9.5).
Changes to weather patterns pose a risk to culture and cultural resources. Cultural continuity is particularly at risk in smaller rural communities, where seasonal rhythms structure social life and identity. Extreme weather events can damage historical sites, recreational areas, and community gathering spaces, further eroding cultural and social well-being. There were temporary closures at many historic sites due to the 2023 floods (e.g., Bennington Battle Monument, President Calvin Coolidge Historic Site, Hubbardton Battlefield, Mount Independence, Chimney Point, President Chester Arthur Historic Site, Justin Morrill Homestead; Vermont Agency of Commerce and Development, 2023).
Health effects
Disruption to identity and well-being can manifest as emotional stress, grief, or feelings of loss related to familiar landscapes and seasonal practices. Impacts include diminished life satisfaction, reduced community engagement, and heightened anxiety about the future of cultural practices. Economic instability from lost tourism or disrupted harvests can exacerbate stress and reduce access to health care or recreational resources. For example, families dependent on maple sugaring income may experience both financial strain and loss of connection to traditional labor, impacting mental well-being and family dynamics.
A college student who grew up in Colchester, remarked feeling a sense of “... climate sadness that I experience when it’s wintertime and this part of the culture is dying. This experience that something that was really important is starting to diminish.” (Kostelnik, 2024)
Exposure
Individuals whose livelihoods depend on land and seasonal cycles—farmers, maple sugar makers, forestry workers—are repeatedly exposed to climate unpredictability. Winter recreation operators and employees, as well as residents participating in skiing, snowmobiling, or ice fishing, are directly exposed to diminished snow and ice conditions. Even those not directly engaged in these activities feel secondary impacts: school and community event disruptions, reduced tourism income, and loss of recreational access indirectly affect social and cultural participation (see Outdoor Recreation and Tourism 9.2.4).
Vulnerability
Cultural and social vulnerability arises when climate change disrupts traditional practices, livelihoods, and community structures. Low-income households, families reliant on seasonal income, and small business owners in recreation, tourism, and agriculture are particularly vulnerable to economic shocks from unpredictable weather and poor snow seasons. Older adults and those dependent on community networks for social engagement are at risk of social isolation when public spaces, events, or recreational activities are disrupted.
10.9.3 What you can do
Individual level
To sustain mental health, Vermonters can maintain social connections to reduce isolation during and after events. Having an action plan in place before events happen can relieve anticipatory fear. For individuals impacted by extreme events, Vermont’s Department of Mental Health has a 24/7 call and text line for distress and crisis support, and for peer support (2026). More information can be found at mentalhealth.vermont.gov.
Community level
With 93% of Vermont hospitals identifying mental health as a need, there is clear opportunity for direct investment in Vermont’s health networks (Vermont Department of Health, 2023). Towns can support mental health and well-being by creating opportunities to build and strengthen community relationships, such as safe access to parks and recreational areas, organizing volunteers for post-disaster clean-up, and supporting peer support groups.
Communities can focus efforts on improving health and social equity. Collaborative care programs, which require buy-in across sectors (e.g., outpatient primary care, mental health services, substance use treatment services, homeless services) are one framework that has proven successful (Castillo et al., 2019). School-based interventions are an option for developing health resilience in children; one in-school program that taught emotional regulation, anxiety management, and problem solving was effective in decreasing social anxiety, generalized anxiety, and depression scores in students (Skryabina et al., 2016). Programs to assist and provide stable housing for people experiencing homelessness are crucial for achieving mental health equity, especially since that population is at increased risk due to climate change (Castillo et al., 2019).
The Vermont Department of Mental Health (DMH) created the Starting Over Strong (SOS) Vermont program after the 2023 floods; it was then extended as needed the following years to provide support to those affected by flooding in Vermont (Vermont Department of Mental Health, 2026). Mobile Crisis of Vermont, is a collaborative program between the Vermont DMH and Health Care & Rehabilitation Services (HCRS) whose goal is to “support and reassure people dealing with emotional, mental health, or substance use crises” (Mobile Crisis of Vermont, 2026).
Box 10-5: Nature-based solutions prove effective in improving well-being of college students
An interdisciplinary team at the University of Vermont found that prescribing time in nature improved well-being and decreased stress in first year college students (Bloomfield et al., 2024). The “Lived Experiences Measured Using Oura Rings Study” (LEMURS), started in 2022, uses a combination of weekly surveys and biophysical data collected from wearable devices (Oura rings) to understand students’ sleep behavior, stress, mental health, heart rate, and activity levels (M. Price et al., 2023). In this study, researchers tested three types of health interventions intended to decrease stress and improve well-being over a 14-week period: 1) Physical activity, 2) Nature experiences, and 3) Therapy.
The physical activity group involved coached and self-guided strength and conditioning sessions. The nature experiences group participated in guided and self-guided activities structured to maximize exposure to natural elements, like snowshoeing, hiking, bird watching, and mindfulness exercises in parks. The therapy group attended weekly group therapy sessions and completed weekly homework assignments that relied on established therapeutic interventions for achieving behavioral goals, like improved sleep and mood.
While there were measurable benefits from nature-based experiences, this study found only modest improvements in mental health outcomes from therapy and no impact from exercise. This contrasts the widespread recognition that therapy and exercise are good strategies for improving mental health. The authors note that this could be for several reasons, including low attendance, limited intensity, or contextual mismatches with students, but they emphasize that even so, nature-based interventions are a scalable and affordable tool for improving mental and physiological health of young adults.
10.10 Cascading Impacts
10.10.1 Modifiers of climate–health impacts
Climate hazards do not affect everyone equally. The severity of health impacts from climate events, whether from heat, flooding, poor air quality, or extreme weather, is shaped by a set of underlying social, economic, and environmental conditions. These conditions act as modifiers, intensifying risk for some populations while buffering others (Figure 10‑29). A growing body of evidence shows that monitoring these modifiers over time is essential to understanding long-term climate‑health burdens in the state.

Source: This chapter
Social and demographic shifts
Vermont’s population is aging, with 36.3% of Vermonters aged 55 or older—a share that continues to grow faster than many other age groups (see Community Development 11.3.1). Older adults are especially vulnerable to heat, air quality degradation, and disruptions to health care access during extreme events because they often have chronic conditions or mobility limitations.
Simultaneously, socioeconomic strains are rising. Currently, 10% of Vermont households live in poverty, including disproportionately high rates among non-white Vermonters (see Community Development 11.3.1). For lower-income families, especially those renting or without savings, climate events like floods or storms can mean loss of home, buried costs in repairs, displacement, or temporary housing instability. When housing and income are already precarious, the capacity to respond to climate hazards is severely limited.
Housing quality, infrastructure, and built environment
Many Vermont homes are older and lack modern insulation, weatherproofing, or air conditioning. For heat waves, this lack of adequate cooling makes residents especially vulnerable. The state’s “Heat Vulnerability Index” flags areas with high proportions of residents who are older, living in poverty, renting, have poor housing conditions, and those with limited access to cooling or green space as particularly at risk (Figure 10‑4).
Recurrent flooding and more frequent heavy rainfall have damaged roads, bridges, wastewater treatment facilities, and septic or well systems (see Infrastructure 7.3.1, 7.4.1, and 7.5.2). In 2023, flooding damaged more than 4,000 homes and 800 businesses statewide and led to multiple fatalities (U.S. Federal Emergency Management Agency, 2024). This exacerbates Vermont’s existing housing crisis, especially since flooding has disproportionately impacted Vermont’s affordable housing stock (Duffort, 2023). In days following the 2023 floods, Barre mayor Jake Hemmerick said, “My sense is the neighborhoods that were the hardest hit were the least resourced” (Duffort, 2023).
Health system access, social support, and inequities in care
Geographic isolation and limited health care access—already a concern in rural Vermont—becomes even more consequential when climate hazards strike. Climate change is contributing to events that can disrupt medical care: power outages may prevent refrigeration of medications, road closures may block access to health care services, and overwhelmed facilities may be unable to respond. Access to care was reported as the second leading priority of Vermont hospitals tied with substance use disorders, with 60% of hospitals identifying these as community health needs (Vermont Department of Health, 2023).
Moreover, persistent inequalities in social determinants (income, housing, insurance access, demographic marginalization) amplify vulnerability for historically underserved populations. People with disabilities, lower‑income households, and renters often face greater barriers to stable housing, quality care, and safe environments—conditions that climate‑driven hazards may worsen. Vermont hospitals listed affordable housing as their fourth highest priority (33%), and 20% of hospitals listed social determinants of health as a priority (Vermont Department of Health, 2023).
Compounding and intersecting hazards
In Vermont, flood risks, heat stress, air quality degradation (e.g., wildfire smoke, allergens), water contamination, and disruptions to infrastructure often overlap—sometimes within weeks or months of each other. During a single month of July 2023, Vermonters experienced heat waves, catastrophic flooding, and wildfire smoke causing compounding impacts: power loss from a storm can incapacitate cooling systems needed for mitigating extreme heat. The state’s Climate & Health Program warns that such overlapping hazards can compound risk, particularly for people with chronic disease, limited resources, or constrained mobility. These overlapping burdens magnify health risks and make recovery more difficult.
Changing social determinants and emerging vulnerabilities
Vermont is undergoing not only environmental change but social change: increasing poverty, rising housing instability, an aging population, and growing inequality (see Community Development 11.3). As these social determinants worsen, independent of climate change, they increase the “baseline vulnerability” of many residents. Thus, when climate hazards occur, they land on a population that may already be stressed, financially constrained, or socially isolated, amplifying health effects and reducing resilience.
10.10.2 Ripple effects of climate-driven health burdens
When climate hazards trigger health effects, the consequences often do not stop there. In Vermont, these effects ripple outward: impacting livelihoods, behavior, community stability, economics, and even long-term public health trajectories. This section explores those downstream and compound impacts, drawing on Vermont-specific experiences and data.
Housing instability, displacement, and economic strain
The floods of 2023 and 2024 devastated thousands of homes and businesses, displacing families and overwhelming housing supply (Vermont Emergency Management, 2023). Post-flood recovery was uneven. Some landlords have been unable to restore rental units to code, which reduced available housing stock, increasing rental costs, and forcing residents to rent units with prior flood damage or lingering mold. After the 2023 floods, displaced renters from one apartment complex in Montpelier reported renting Airbnbs, couch surfing, or staying in shelters while waiting for their apartments to be available (Duffort, 2023).
Housing instability can lead to long-term displacement, rent burden (i.e., when a household spends more than 30% of its income on housing costs), increased unsheltered homelessness risk, and greater difficulty accessing stable housing, especially among lower-income and marginalized populations who lack resources to relocate or repair damages. Over time, these shifts erode community cohesion and reduce the ability of households to recover from repeated climate events.
Climate events can impact the labor pool. School closures due to heat or poor air quality typically occur without much notice, so parents and caregivers that cannot find last-minute childcare are forced to stay home from work. In Vermont, wage losses due to extreme heat alone between years 2036–2065 are predicted to be between 10 and 21 million USD (Zhang & Shindell, 2021).
Disrupted health care access and chronic disease exacerbation
Flooding, storm damage, and extreme weather frequently disrupt utilities, water systems, roads, and power lines (see Infrastructure 7.3.2, 7.4.1, and 7.5.2). During such events, refrigeration of medicines can fail, medical equipment may stop working, and access to clinics can be blocked. These present additive and serious risks to continuity of care and health for people with chronic illnesses, older adults, and medically vulnerable populations.
Multiple coinciding extreme weather events (e.g., floods with heat waves; heat with smoke events), compound stress to physical health and may lead to spikes in emergency visits, hospitalizations, or long-term health deterioration—with ripple effects on health care costs, hospital capacity, and public health resource allocation.
Behavioral and lifestyle shifts—some adverse, some adaptive
Climate-driven disruptions can lead to changes in behavior and lifestyle that carry their own health consequences. For instance, during prolonged heat events or poor air quality episodes, people may reduce outdoor physical activity. In Vermont, this could reduce time spent in nature, recreation, or community outdoor gatherings, which undermines both physical health and social well-being.
Additionally, economic stress caused by illness, home damage, or lost workdays may lead to cutbacks in healthy behaviors (e.g., healthy food, recreation) thereby compounding the health burden in a feedback loop that is difficult to break.
Nutrition and health behaviors
During heat or disaster-related stress, households may turn to cheaper, processed foods with higher sugar, salt, and fat, especially if fresh produce becomes scarce, refrigerators are compromised, or time and resources are limited. Over time, such dietary shifts may contribute to increased chronic disease, obesity, diabetes, or other nutrition-related health problems, compounding the original climate-driven risks. In the U.S., researchers found a clear link between increased outdoor temperature and increased sugar intake, especially in neighborhoods with lower levels of education and income (He et al., 2025).
Educational disruption and intergenerational impacts
Climate events such as floods, storms, or extreme heat may cause school closures, displacement, or interruptions in transportation, which affect children’s education, daily routines, and social development. Missed school days impair academic progress; displacement or housing instability may lead to longer-term educational instability. For children from already vulnerable households, these disruptions may worsen inequities in educational attainment, social support, and long-term socioeconomic mobility.
Impacts to children’s health and development can even start before birth. Prenatal stress from natural disasters, including ice storms and floods, has been linked to lower cognitive, behavioral, socio-emotional, and physical development (i.e., balance and motor-skills) in children from 0–18 years (Lafortune et al., 2021).
Strain on public resources and inequitable recovery
Large-scale disasters draw on finite public and private resources for relief, recovery, and rebuilding. In the wake of floods or smoke events, public health systems, emergency services, housing agencies, and social services can become overwhelmed. For lower-income and marginalized populations, recovery may be slower or incomplete, deepening inequities in health outcomes, housing stability, and long-term resilience.
Delayed financial support after flooding caused ripple effects in Vermont towns. Ted Brady, of the Vermont League of Cities and Towns, said “Because of a delay in processing FEMA reimbursements, towns have to take out loans, towns have to take out tax anticipation notes. Therefore, their budgets and taxpayers are paying interest that they otherwise wouldn’t need to pay” (Hirschfeld, 2024). Managing funding after a disaster takes a toll on the mental health of local officials. Barton town clerk Kristin Atwood recounted that securing federal funding for her town’s public assistance projects after flooding required “a total loss of work-life balance,” including waking up at 3 a.m. from worry (Hirschfeld, 2024).
10.10.3 What you can do
Because modifiers and ripple effects shape the ultimate burden of climate‑health impacts, reducing vulnerability and building resilience requires systemic action through housing, infrastructure, health access, social policy, and community networks (Fielding & Hornsey, 2016).
- Prioritize investment in climate-resilient, affordable, and supportive housing: retrofit older homes (insulation, climate‑resilient foundations), ensure rental standards for flood‑resistant housing, and support low-income families and renters after disasters.
- Strengthen infrastructure resilience: upgrade wastewater and water systems, protect wells, invest in flood‑resistant drainage and bridges, improve road redundancy, and ensure rapid repair and recovery after disasters.
- Expand health care access and public health capacity, especially in rural areas: support telehealth, mobile clinics, emergency medical services, mental health support, and continuity of care for chronic conditions during and after events.
- Promote food security and nutrition support: support local agriculture, flood‑resistant farming practices, community gardens, backup food supply and refrigeration, especially for vulnerable households.
- Support economic resilience and diversified livelihoods: help seasonal and climate‑sensitive industries adapt (e.g., through diversification, insurance, or transition support), safeguard small businesses, and encourage local employment opportunities that are less climate‑vulnerable.
- Invest in community cohesion and social support networks: build social infrastructure like mutual aid groups, community centers, social services, networks for older adults, and support for marginalized populations so that recovery is equitable and community bonds remain strong.
- Integrate a climate justice and equity lens into all planning: prioritize support for historically marginalized communities (low‑income, non-white, renters, people with disabilities, elderly adults), ensure access to information, resources, and support before and after events.
- Monitor and track long-term data on health, housing, economy, demographics, and migration, to identify trends, emerging vulnerabilities, and guide policy including updating social vulnerability indices, public health tracking, and hazard maps regularly.
10.11 Climate & health multisolving
Multisolving is a framework for addressing multiple problems through one solution. Many approaches focus on one main issue and view solutions to additional issues as extra benefits. Multisolving envisions all problems as equally important and requires interdisciplinary teams of experts to collaborate on solutions.
Climate change is a long-term issue, which can make it hard to incentivize change, yet many actions taken to mitigate climate change have immediate benefits for other pressing challenges (TEDx Talks, 2019). Intentionally addressing actions that mitigate both climate change and other challenges benefits multiple issues and can increase support. For instance, emphasizing the health benefits of actions that also help mitigate climate change has been demonstrated to improve public engagement and policy support (Uppalapati et al., 2023).
The following sections explore some actions that have short-term health benefits and long-term climate benefits. These strategies include both individual level actions and possibilities for more structural solutions.
10.11.1 Strategy: public and active transport
Increasing use of public and active transportation is one example of a climate solution with other immediate benefits (including to human health). Public transportation in Vermont is limited to busses but is offered by a variety of providers (Figure 10‑30; see 10.13.8). Active transport encompasses transportation via walking, biking, or any other people-powered method. Active and public transport solutions together can reduce car usage.
Between state fiscal year 2012–2017, Vermont public transit provided around five million rides (Vermont Agency of Transportation, 2022). The COVID-19 pandemic led to a decline in ridership, and by 2022, rates had still not recovered, with about 2.4 million trips. Consistently, around half of those rides occur in the Chittenden county area (Vermont Agency of Transportation, 2022).
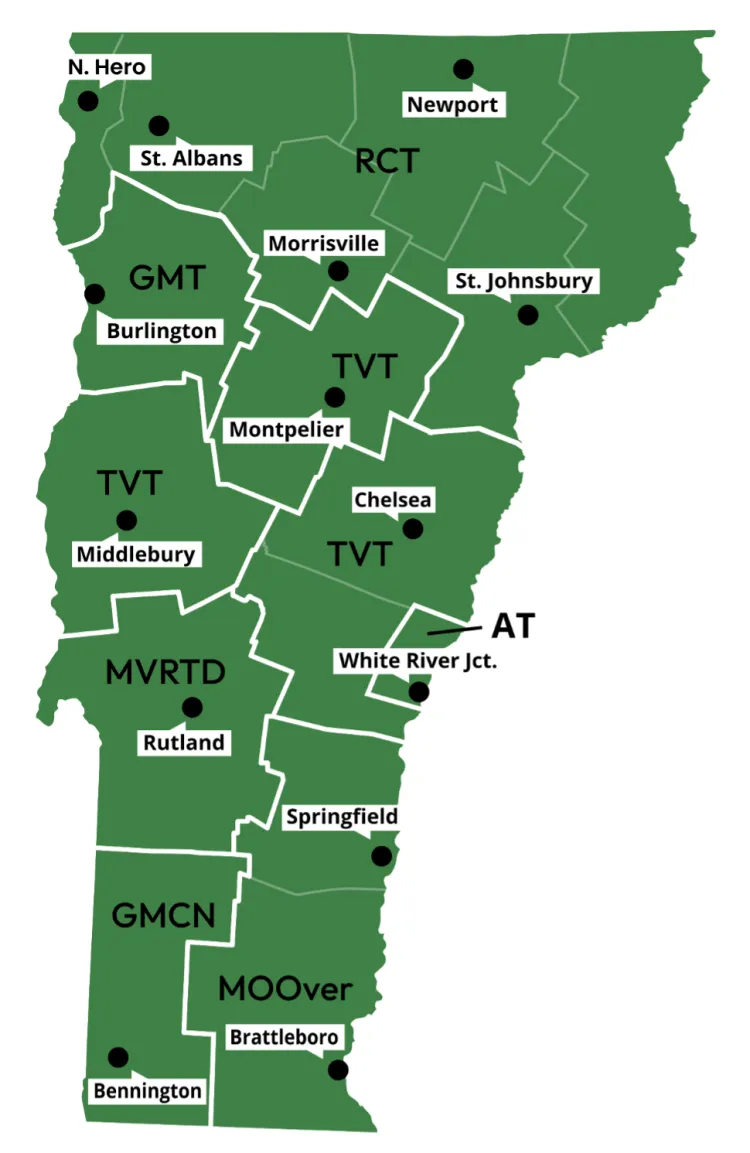
Source: Go! Vermont (2026)
Health benefits
The Vermont Comprehensive Energy Plan includes the following goals: increasing electric vehicle ownership, reducing driving alone, and increasing active and public transport usage (Vermont Department of Public Service, 2022; see 10.13.8). If these goals were met by 2050, VDH estimates that 2,000 lives would be saved by 2050, with the majority of those health benefits tied to active transport (Vermont Department of Health, 2019). Data from around 2010–2011 was used as a baseline to align with the Comprehensive Energy Plan.
Active Transport: Active transport has health benefits because it increases physical activity. In 2022, 20% of Vermonters reported having no leisure time physical activity within the last month (Vermont Department of Health, 2025b). Residents of Orleans, Caledonia, and Orange counties had significantly lower levels than the statewide average (Figure 10‑31).
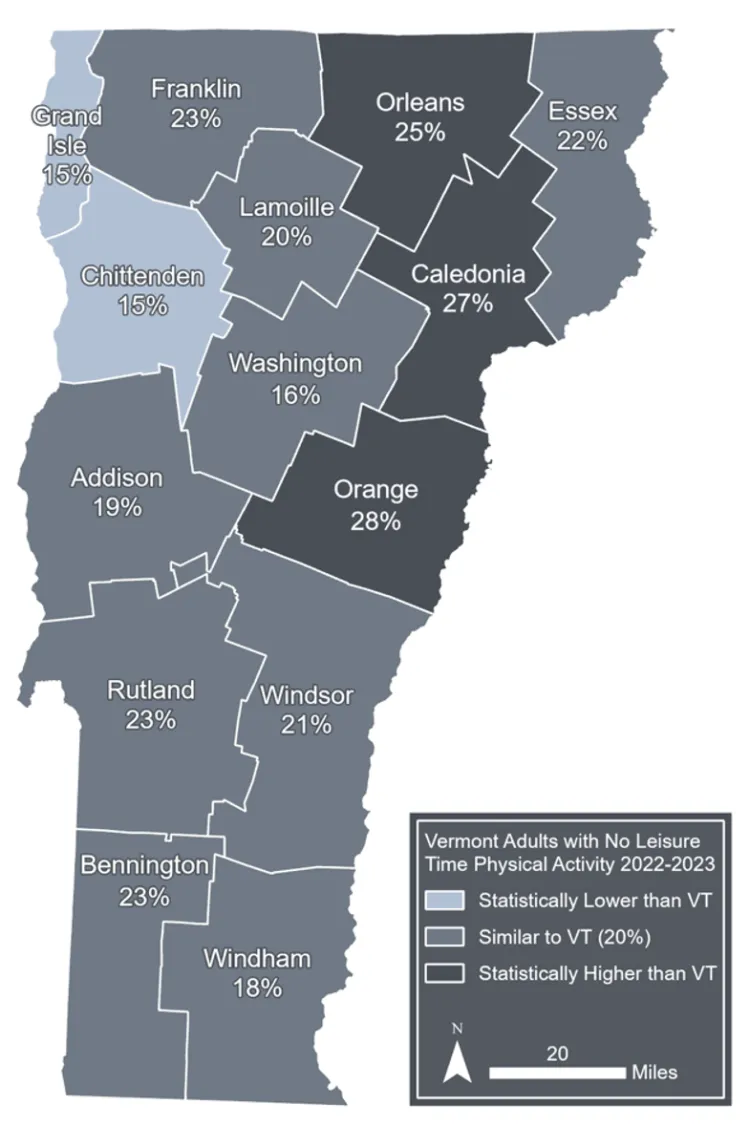
Source: Vermont Department of Health (2025b)
Note: Visualization by Hannah C. Turner
Limited physical activity is one of three behaviors associated with four diseases (cancer, heart disease and stroke, type 2 diabetes, and lung disease) that cause 50% of deaths in Vermont (Vermont Department of Health, 2024d). Increasing physical activity through walking or biking as a form of transportation can help prevent these chronic diseases.
Physical activity can benefit Vermonters with other conditions. Arthritis affected 29% of Vermonters in 2023 (Vermont Department of Health, 2025b). Low-impact exercise, like walking, can reduce severe joint pain. In 2021, 32% of Vermonters with arthritis who were not physically active experienced severe joint pain, as opposed to 17% of those who were active (Vermont Department of Health, 2025d). Improved bone and muscle health from exercise can also reduce risk of falls and allow older adults to complete more activities. For all adults, exercise is associated with reduced anxiety and depression and improved sleep (U.S. Centers for Disease Control and Prevention, 2024f).
Public Transportation: Ensuring access to public transport may support health care access and utilization. Travel time and distance has been identified as a barrier to rural Americans in using health care (Douthit et al., 2015). Because rural residents are also more likely to face other barriers (e.g., financial constraints, lower likelihood of broadband connection to access telehealth services), ensuring that rural residents have access to public transportation that connects them with health care providers is even more important.
Climate benefits
Public and active transport can help reduce transportation-related emissions. According to the EPA, an average passenger vehicle emits 4.6 MTs of CO2 per year (U.S. Environmental Protection Agency, 2016b). Altogether, the transportation sector accounted for 39% of GHG emissions in Vermont in 2021 (Giles, 2025; see Energy 8.3). Increasing public and active transport usage is challenging to implement in Vermont, which is largely rural and has declining ridership and high costs that put pressure on transportation providers to cut routes (Brouwer, 2025).
10.11.2 Strategy: plant-based diets
Plant-based diets emphasize plant-based foods and have decreased amounts of meat, dairy, eggs, and other animal products. While diets focused on both climate and health benefits have been proposed, it is essential that any dietary recommendations are responsive to local cultures (both in terms of diet and food production methods), locally available foods, and specific individual health needs (e.g., reproductive-age women have different dietary needs than other groups; Klapp et al., 2025). As such, this assessment will make no specific dietary recommendations.
Health benefits
In 2015, 79% of Vermont adults did not eat the recommended five servings of fruits and vegetables per day (Vermont Department of Health, 2025a). Eating more produce is important and has many health benefits including decreased risk of many chronic diseases such as obesity, heart disease, diabetes, and some cancers (Vermont Department of Health, 2025a; Table 10-6).
Total meat consumption is positively correlated with weight gain, although so is an unhealthy plant-based diet (high in sugar, low in fruits and vegetables; Gibbs & Cappuccio, 2022). Meat consumption is associated with an increase in type 2 diabetes risk, even when adjusted for weight (Gibbs & Cappuccio, 2022). Two meta-analyses found that plant-based diets were associated with a 10% or 16% lower risk of CVD incidence (Gibbs & Cappuccio, 2022). To learn more about the importance of food security for health, see 10.8 Food security.
Nutrition-related disease | % of Vermont adults reporting lifetime impact in 2023 |
|---|---|
Obesity | 30% (aged 20 or older) |
Cardiovascular disease | 8% |
Hypertension | 33% |
Diabetes | 9% |
High cholesterol | 34% |
Source: Vermont Department of Health (2025b)
Climate benefits
Transitioning to a plant-based diet could reduce diet-related GHG emissions by 49% (Gibbs & Cappuccio, 2022). Another analysis estimated a 29–70% decrease in food-related GHG emissions by 2050 (compared to a 2005/2007 baseline) if different levels of plant-based diets were adopted globally (Springmann et al., 2016). Reducing red meat consumption is a key component, as 52% of global GHG emissions related to food systems come from cattle products (Gibbs & Cappuccio, 2022).
10.11.3 Strategy: reduced food waste
Food waste has negative impacts on human health and the environment, as food that is thrown into the landfill is both lost calories and nutrients, and it releases GHGs. While composted food still releases carbon dioxide, if managed properly, it does not release methane (a more potent heat-trapping GHG). In contrast, all landfilled foods contribute to methane emissions. The VTDEC estimated that in 2023, between 144,365 and 162,653 tons of food waste were produced in Vermont, and between 50.7% and 56.8% was diverted from the landfill (Vermont Department of Environmental Conservation, 2024). Part of this diversion, 3,430 tons, is food that grocery stores and other businesses sent to Vermont Foodbank instead of the landfill, but this did not account for other programs that provide otherwise-wasted food to food insecure individuals (Vermont Department of Environmental Conservation, 2024).
Food waste can be reduced by food banks by increasing delivery to clients directly and through partner agencies managing some pickup and distribution (Zou et al., 2025).
Health benefits
Food waste diversion programs may improve food access. For example, the Intervale Center, Vermont Gleaning Collective, and other similar organizations harvest excess produce from farms and give the food to people experiencing food insecurity. It is important to note that food wasted on farms is often termed food loss instead of food waste, leading to different categorization and tracking, but there are still environmental and health benefits from not wasting this supply of food.
There can be concerns, especially among businesses donating food, about foodborne illness spread via diverted food. A case study of food waste diversion for consumption in California demonstrates the importance of outreach to businesses, especially by environmental health inspectors, who can alleviate concerns about liability for foodborne illnesses. To further address these concerns, the partnership organizing program also developed a training for volunteers to ensure proper food safety practices are implemented (Garcia-Silva et al., 2017).
Concerns about food diversion exist on the food bank side. Retailers may pass the burden of managing food waste to food banks by sending inedible or unwanted donations, requiring infrastructure, time, and money. Recovering food waste for consumption for food insecure people should not be viewed as a solution to food insecurity or food waste (Millar et al., 2020). These programs would be more effective if recipient organizations had more power to control the type, quality, and flow of donations, or tax incentives that support beneficial donations (Neff et al., 2015).
School-based nutrition education has been shown to increase fresh produce consumption and nutrition while reducing food waste (Brennan & Browne, 2021). Fruits and vegetables are the most wasted category of food, even though they are important for nutrition. Reducing waste may support more consumption of these foods and lead to savings that can be partially directed towards the continued purchase of high-quality foods (Neff et al., 2015).
Climate benefits
When food is wasted, the cropland, energy, fertilizers, and other resources dedicated to its production, transportation, and processing are also wasted. When food waste is disposed of in the landfill, it decays anaerobically, leading to CO2 and methane production. Nationally, food waste accounts for 58% of methane emissions from municipal solid waste landfills (U.S. Environmental Protection Agency, 2023c). While composting is a better option than landfills, it is not a comprehensive solution to food waste. Less food needs to be discarded.
10.11.4 Strategy: green spaces
Green spaces vary in size and characteristics but have a variety of health benefits. Vermont is 76% forested and has 55 state parks, among other recreation sites (Vermont State Parks, 2026; see Forests 3.2). There is a state park within a 30 minute drive of every Vermont town (Vermont Agency of Natural Resources, 2025). For those without reliable personal transportation and for day-to-day use, urban trees and smaller parks provide important benefits to the environment and human health. However, urban trees are more vulnerable to climate change, so adaptation actions will be needed to preserve these resources and expand them in areas with less urban tree cover (see Forests 3.9 and 3.10.3).
One effort to add trees to private lands in areas that are more impacted by extreme heat has involved VDH, the Vermont Urban & Community Forestry Program, and the Arbor Day Foundation, among others. Areas with higher heat vulnerability are targeted to provide benefits to the homeowners and the broader community. Between 2017–2025, the Community Canopy Program planted 6,060 trees, leading to over a million dollars in estimated benefits (Vermont Urban & Community Forestry Program, 2026; see 10.13.8).
Health benefits
Green spaces improve air quality, decrease temperatures, improve water quality by absorbing and slowing runoff, and have a multitude of mental health benefits. There are a variety of theories about the drivers of mental health benefits of nature, but spending time in nature has been clearly associated with reduced stress and improved cognition. Attention Restoration Theory suggests that human-made and natural environments engage our brains in different ways, and that natural environments require less effort to view, allowing attention to be restored (Mcdonnell et al., 2025). In a randomized controlled study comparing individuals who went on an urban versus natural walk, self-reported emotional state improved and neural activity associated with executive attention decreased (McDonnell & Strayer, 2024). Recreating in green spaces contributes additional health benefits. The American Heart Association recommends that adults get at least 150 minutes of moderate aerobic activity weekly (American Heart Association, 2024), and green spaces provide more opportunities for safely achieving this.
Climate benefits
Green spaces act as a carbon sink, absorbing CO2 from the atmosphere. Vermont’s forests sequester over five million metric tons of CO2 equivalents annually (Vermont Department of Forests, Parks and Recreation, 2026). However, the amount of CO2 equivalents absorbed by Vermont’s forests has been in decline (see Forests 3.4). The previously mentioned Community Canopy Program’s trees planted between 2017–2025 will lead to avoided or sequestered CO2emissions of 1,614 MT over the next 40 years (Vermont Urban & Community Forestry Program, 2026).
10.11.5 Strategy: weatherization
Weatherization is the process of improving home infrastructure to reduce leakage of heat in or out of the home, such as adding insulation or sealing gaps (e.g., around windows). Vermont’s 2022 Comprehensive Energy Plan set a goal to increase the number of weatherized homes in VT by 120,000 by 2030 (compared to 2008 levels; see Energy 8.5.1). State policy has focused on weatherizing the homes of low-income and moderate-income Vermonters, where energy costs account for a larger portion of household spending (see Energy 8.5.2). The 2025 Vermont Climate Action Plan mentioned weatherization in six of its 52 priority actions (Vermont Climate Council, 2025).
Since 2016, the Rutland Regional Medical Center has referred low-to-moderate income patients dealing with respiratory illness or home accessibility challenges to NeighborWorks of Western Vermont’s HEAT Squad (now Cornerstone Housing Partners), which completes weatherization and other health-protective home upgrades (Vermont Department of Health, 2018a). Expanding this across the state, from 2018–2021, Efficiency Vermont, the Vermont Office of Economic Opportunity Weatherization Assistance Program, VDH, and partner hospitals ran four pilots of the Healthy Homes program to improve population health and reduce GHG emissions (Capps, 2022). Ten households with occupants affected by asthma and/or COPD participated in the first year and received education, air quality improvements and other health upgrades (e.g., grab bars to prevent falls), and energy efficiency upgrades on top of standard weatherization actions. The pilots have served a variety of areas and demographic groups (based on income and/or health conditions; see 10.13.8).
Health Benefits
Weatherization can benefit health indirectly by decreasing the cost of heating and electricity and thus allowing for more spending on health care, nutritious food, and other necessities. This is especially relevant for low-income Vermonters who spend a higher portion of their budget on energy and may face more pressure to choose between energy and health-supportive essentials. Weatherization impacts health more directly by improving temperature regulation and air quality and decreasing opportunities for pests like mosquitoes to enter the home (see 10.3, 10.5, and 10.6.2 for more information on these hazards). VDH estimated that over a decade, weatherizing 2,000 low-income homes “would help prevent an estimated 223 emergency department visits… associated with reduced health impacts caused by asthma, cold and heat” (Vermont Department of Health, 2018b). Home improvements may also lead to general improvements in quality of life and mental health (Vermont Department of Health, 2018a).
Participants in the 2019 Healthy Homes pilot shared the following testimonials:
“We don’t get mold on the windows anymore.”
“I was able to take a shower in the morning because it’s warm. The floors are warm. I hope to move my bed back into the bedroom now that it’s warm in there.”
“With the work done, I’m saving $150 a month on fuel. I feel a consistent comfortable and my breathing is good” (Capps, 2022).
In an analysis of weatherization recipients who also use Medicaid, health care costs associated with respiratory and cardiovascular health were lower than the control group for two years post-weatherization (Vermont Department of Health, 2025j; see 10.13.8).
Climate benefits
Weatherization practices allow for decreased energy consumption because energy leakage (in the form of heat) decreases. This decreased energy consumption leads to decreased emissions when heating is derived from fossil fuel–related sources. In 2020, thermal/heating was the second-largest contributing sector to Vermont’s GHG emissions at 36%, making energy efficiency key for Vermont to reach its emissions goals (Energy Action Network, 2026a).
10.11.6 Strategy: electrification
While most of Vermonters’ electricity comes from renewable sources, most of residential heating in Vermont does not use electricity, creating barriers to emissions’ reductions in the thermal sector. Approximately 12% of Vermont households are primarily heated by electricity, less than any other state in the U.S. (U.S. Energy Information Administration, 2026). In contrast, approximately 11% of Vermont households use wood as their primary heat source, more than any other state (U.S. Energy Information Administration, 2026), while 38% of Vermonters use wood as a primary or secondary heat source (Vermont Department of Health, 2017). Many Vermonters use at least two heat sources in case of extreme events that disable one, such as electric outages or fuel delivery disruptions.
Electrifying household energy systems and switching away from other sources like wood can have higher upfront costs than alternative energy sources. However, they can lead to reduced costs over time, making incentives, grants, and financing programs key for supporting electrification on the household level (Vermont Climate Council, 2025).
Health benefits
Burning wood improperly or using inefficient stoves is associated with PM2.5 levels that can often exceed the EPA’s ambient air quality standards (Walker et al., 2021). PM2.5 exposure can lead to negative respiratory and cardiovascular health outcomes (see 10.5). People at increased risk of health effects from wood smoke are: people who work outdoors, pregnant people, children, teens, seniors, and people with heart or lung diseases, diabetes, or obesity (U.S. Environmental Protection Agency, 2013b). Gas stoves also emit pollutants like nitrogen dioxide and carbon monoxide that have negative health effects (Krasner & Seals, 2020). Switching to electricity for heating and cooking reduces negative health effects from indoor air pollution, but may require a back-up (e.g., battery, generator, secondary heat source) in case of power outages.
Climate benefits
In 2024, Vermont’s electricity was 75% based on renewable energy sources, so switching to electric heating and cooking sources will reduce emissions (Vermont Climate Council, 2025). Currently, the thermal sector is the second-largest contributor to GHG emissions in Vermont, accounting for 31.5% of emissions in 2022 (Energy Action Network, 2026b). About half of those emissions are residential.
10.11.7 Strategy: health care sector decarbonization
The health care sector plays a bi-directional role in climate change as a significant contributor of GHG emissions (Lenzen et al., 2020). In 2021, over 200 medical journals issued an unprecedented joint statement declaring climate change the greatest threat to public health (Atwoli et al., 2021). Soon thereafter, the National Academy of Medicine launched an Action Collaborative in Decarbonizing the U.S. Health Sector (National Academy of Medicine, 2021). Globally, health care is responsible for roughly 5% of GHG emissions, with the U.S. accounting for about a quarter of that total—the highest per capita (Eckelman et al., 2020; Pichler et al., 2019). Approximately 80% of these emissions result from supply chains that support resource-intensive diagnostics, treatments, and infrastructure (Seervai et al., 2022). Pharmaceuticals alone contribute 10% of GHG emissions in the health care sector.
In response, the health care sector has a critical role to play in mitigating climate change and improving health outcomes through decarbonization and by embracing climate-smart practices (Bhopal & Norheim, 2023; Hough & Cohen Tanugi-Carresse, 2024; Lakatos et al., 2023). This includes transitioning to renewable energy, reducing reliance on single-use plastics, optimizing supply chains, minimizing unnecessary pharmaceutical reliance and rethinking prescribing practices to include all evidence-based, non-pharmacologic therapies (Lakatos et al., 2023; Vatovec, 2025). Climate-smart health care involves designing facilities with energy-efficient infrastructure and adopting sustainable waste management (Walsh et al., 2024). By aligning clinical practices with environmental stewardship, the sector can reduce its ecological footprint while enhancing resilience to climate-related health threats.
Box 10-6: UVM medical center GHG emission reductions
Written by: Christine Vatovec, University of Vermont
The University of Vermont Medical Center (UVMMC) has implemented a wide range of initiatives to reduce GHG emissions and promote climate-friendly health care. As one of the top 25 sustainable hospitals in the U.S., UVMMC has demonstrated leadership in environmental stewardship through energy-efficient infrastructure, waste reduction, and climate resilience efforts (Gardner Carson, 2025).
The UVMMC has upgraded lighting systems, improved anesthesia delivery for better air quality, and constructed Leadership in Energy and Environmental Design (LEED)-certified buildings—leading to energy savings and a reduction in GHG emissions. Recent changes in nitrous oxide delivery systems alone will reduce GHG emissions equivalent to 65 homes’ annual energy use (Thomas, 2025). UVMMC prioritizes sustainable food sourcing, purchasing from over 70 local producers and spending 42% of its food budget within 250 miles to reduce transportation emissions. Its telemedicine expansion aims to reduce vehicle trips, thereby lowering GHG emissions while improving access to care.
The Environmental Services team has been honored for its waste reduction and recycling programs, including a robust composting initiative.
10.13 Resources
See resources linked below.
10.13.2 Extreme Weather
10.13.4 Tick and mosquito-borne diseases
10.13.6 Food security
10.13.7 Well-being, identity, and livelihoods
10.14 References
Adetona, O., Reinhardt, T. E., Domitrovich, J., Broyles, G., Adetona, A. M., Kleinman, M. T., Ottmar, R. D., & Naeher, L. P. (2016). Review of the health effects of wildland fire smoke on wildland firefighters and the public. Inhalation Toxicology, 28(3), 95–139. https://doi.org/10.3109/08958378.2016.1145771
Agency for Toxic Substances and Disease Registry. (2015, September). Public Health Statement Nitrate and Nitrite. U.S. Department of Health and Human Services Public Health Service Agency for Toxic Substances and Disease Registry. https://www.atsdr.cdc.gov/ToxProfiles/tp204-c1-b.pdf
Agency for Toxic Substances and Disease Registry. (2017, July). ToxGuide for Nitrate and Nitrite. U.S. Department of Health and Human Services Public Health Service Agency for Toxic Substances and Disease Registry. https://www.atsdr.cdc.gov/toxguides/toxguide-204.pdf
Agency of Agriculture Food and Markets. (2026). Annual Mosquito Reports | Agency of Agriculture Food and Markets. Agency of Agriculture Food and Markets. Agency of Agriculture Food and Markets. https://agriculture.vermont.gov/public-health-agricultural-resource-management-division/plant-health-and-pest-management-2
American Heart Association. (2024, January 19). American Heart Association Recommendations for Physical Activity in Adults and Kids. Www.Heart.Org. https://www.heart.org/en/healthy-living/fitness/fitness-basics/aha-recs-for-physical-activity-in-adults
American Lung Association. (2025). Vermont Air Quality Report Card. https://www.lung.org/research/sota/city-rankings/states/vermont
American Psychological Association & ecoAmerica. (2017). Mental Health and Our Changing Climate: Impacts, Implications, and Guidance: (503122017-001) [Dataset]. https://doi.org/10.1037/e503122017-001
Anderegg, W. R. L., Abatzoglou, J. T., Anderegg, L. D. L., Bielory, L., Kinney, P. L., & Ziska, L. (2021). Anthropogenic climate change is worsening North American pollen seasons. Proceedings of the National Academy of Sciences, 118(7), e2013284118. https://doi.org/10.1073/pnas.2013284118
Archie, A. (2023, February 13). 3 men in 3 days die after falling through ice on Vermont’s Lake Champlain. NPR. https://www.npr.org/2023/02/13/1156480132/men-fell-through-ice-vermont
Atwoli, L., Baqui, A. H., Benfield, T., Bosurgi, R., Godlee, F., Hancocks, S., Horton, R., Laybourn-Langton, L., Monteiro, C. A., Norman, I., Patrick, K., Praities, N., Rikkert, M. G. M. O., Rubin, E. J., Sahni, P., Smith, R., Talley, N. J., Turale, S., & Vázquez, D. (2021). Call for emergency action to limit global temperature increases, restore biodiversity, and protect health. The Lancet, 398(10304), 939–941. https://doi.org/10.1016/S0140-6736(21)01915-2
Bacon, R. M., Kugeler, K. J., Mead, P. S., & Centers for Disease Control and Prevention (CDC). (2008). Surveillance for Lyme disease—United States, 1992-2006. Morbidity and Mortality Weekly Report. Surveillance Summaries, 57(10), 1–9. https://www.cdc.gov/mmwr/preview/mmwrhtml/ss5710a1.htm
Banda, C., Tristram, D., & Samanta, D. (2025). Eastern Equine Encephalitis. In StatPearls. StatPearls Publishing. http://www.ncbi.nlm.nih.gov/books/NBK557692/
Bhopal, A., & Norheim, O. F. (2023). Fair pathways to net-zero healthcare. Nature Medicine, 29(5), 1078–1084. https://doi.org/10.1038/s41591-023-02351-2
Bliss, S., McCarthy, A. C., Mitchell, R. C., Merrill, S. C., Schattman, R. E., Anderzén, J., & Niles, M. T. (2025). Does Home and Wild Food Procurement Enhance Food Security in High-Income Countries? Current Environmental Health Reports, 12(1), 32. https://doi.org/10.1007/s40572-025-00495-6
Bloomfield, L. S. P., Fudolig, M. I., Kim, J., Llorin, J., Lovato, J. L., McGinnis, E. W., McGinnis, R. S., Price, M., Ricketts, T. H., Dodds, P. S., Stanton, K., & Danforth, C. M. (2024). Predicting stress in first-year college students using sleep data from wearable devices. PLOS Digital Health, 3(4), e0000473. https://doi.org/10.1371/journal.pdig.0000473
Borchers Arriagada, N., Horsley, J. A., Palmer, A. J., Morgan, G. G., Tham, R., & Johnston, F. H. (2019). Association between fire smoke fine particulate matter and asthma-related outcomes: Systematic review and meta-analysis. Environmental Research, 179, 108777. https://doi.org/10.1016/j.envres.2019.108777
Bouchard, C., Dibernardo, A., Koffi, J., Wood, H., Leighton, P., & Lindsay, L. (2019). N Increased risk of tick-borne diseases with climate and environmental changes. Canada Communicable Disease Report, 45(4), 83–89. https://doi.org/10.14745/ccdr.v45i04a02
Brennan, A., & Browne, S. (2021). Food Waste and Nutrition Quality in the Context of Public Health: A Scoping Review. International Journal of Environmental Research and Public Health, 18(10), 5379. https://doi.org/10.3390/ijerph18105379
Bromley-Trujillo, R., Dunk, B., & Karch, A. (2023). Analyzing variation in state newspaper coverage of climate change. Climatic Change, 176(12), 174. https://doi.org/10.1007/s10584-023-03638-6
Brouwer, D. (2025, July 16). Green Mountain Transit Searches for Cash—And Its ‘Soul.’ Seven Days. https://www.sevendaysvt.com/news/green-mountain-transit-searches-for-cash-and-its-soul-44002430/
Calvin, A. (2025, May 30). Johnson General Store gets warm welcome. VTDigger. https://vtdigger.org/2025/05/30/johnson-general-store-gets-warm-welcome/
Capps, L. (2022). Healthy Homes Vermont 2021: Efficiency Vermont R&D Project: Healthcare Partnerships. Efficiency Vermont. https://www.efficiencyvermont.com/Media/Default/docs/white-papers/Healthy_Homes_Vermont_2021.pdf
Casey, P. (2025, August). Tire Slicer Program is Coming to a Farm Near You | Agency of Agriculture Food and Markets. Vermont Agency of Agriculture, Food & Markets. https://agriculture.vermont.gov/tire-slicer-program-coming-farm-near-you
Castillo, E. G., Ijadi-Maghsoodi, R., Shadravan, S., Moore, E., Mensah, M. O., Docherty, M., Aguilera Nunez, M. G., Barcelo, N., Goodsmith, N., Halpin, L. E., Morton, I., Mango, J., Montero, A. E., Rahmanian Koushkaki, S., Bromley, E., Chung, B., Jones, F., Gabrielian, S., Gelberg, L., … Wells, K. B. (2019). Community Interventions to Promote Mental Health and Social Equity. Current Psychiatry Reports, 21(5), 35. https://doi.org/10.1007/s11920-019-1017-0
Chen, R., & Nappe, T. (2025). Methemoglobinemia. In StatPearls. StatPearls Publishing. http://www.ncbi.nlm.nih.gov/books/NBK537317/
Chen, S., Zhang, X., Lin, J., Huang, J., Zhao, D., Yuan, T., Huang, K., Luo, Y., Jia, Z., Zang, Z., Qiu, Y., & Xie, L. (2019). Fugitive Road Dust PM2.5 Emissions and Their Potential Health Impacts. Environmental Science & Technology, 53(14), 8455–8465. https://doi.org/10.1021/acs.est.9b00666
Cheng, Y.-T., Lung, S.-C. C., & Hwang, J.-S. (2019). New approach to identifying proper thresholds for a heat warning system using health risk increments. Environmental Research, 170, 282–292. https://doi.org/10.1016/j.envres.2018.12.059
Cho, H. (2023, July 14). Burlington’s refugee farmers face a completely lost season from floods. VTDigger. https://vtdigger.org/2023/07/14/burlingtons-refugee-farmers-face-a-completely-lost-season-from-floods/
Choi, Y.-J., Lee, K. S., & Oh, J.-W. (2021). The Impact of Climate Change on Pollen Season and Allergic Sensitization to Pollens. Immunology and Allergy Clinics of North America, Climate Change and Allergy, 41(1), 97–109. https://doi.org/10.1016/j.iac.2020.09.004
Cleveland Clinic. (2021, November 4). Alkaline Phosphatase (ALP): What It Is, Causes & Treatment. Cleveland Clinic. https://my.clevelandclinic.org/health/diagnostics/22029-alkaline-phosphatase-alp
Cleveland Clinic. (2022, January 19). Leukocytosis (High White Blood Cell Count): Causes & Symptoms. Cleveland Clinic. https://my.clevelandclinic.org/health/diseases/17704-high-white-blood-cell-count
Climate Superfund Act, Pub. L. No. 122, 17 (2024). https://legislature.vermont.gov/Documents/2024/Docs/ACTS/ACT122/ACT122%20As%20Enacted.pdf
Collier, S. A., Deng, L., Adam, E. A., Benedict, K. M., Beshearse, E. M., Blackstock, A. J., Bruce, B. B., Derado, G., Edens, C., Fullerton, K. E., Gargano, J. W., Geissler, A. L., Hall, A. J., Havelaar, A. H., Hill, V. R., Hoekstra, R. M., Reddy, S. C., Scallan, E., Stokes, E. K., … Beach, M. J. (2021). Estimate of Burden and Direct Healthcare Cost of Infectious Waterborne Disease in the United States—Volume 27, Number 1—January 2021—Emerging Infectious Diseases journal—CDC. https://doi.org/10.3201/eid2701.190676
Cotnoir, A. (2021, March 31). The End of Maple? Maple Sugaring Amid a Changing Climate. Audubon Vermont. https://vt.audubon.org/news/end-maple-maple-sugaring-amid-changing-climate
Cox-Ganser, J. M. (2023). Is exposure to pollen a risk factor for moderate and severe asthma exacerbations? Allergy, 78(8), 2121–2147. https://doi.org/10.1111/all.15724
Crimmins, A., Balbus, J., Gamble, J. L., Beard, C. B., Bell, J. E., Dodgen, D., Eisen, R. J., Fann, N., Hawkins, M. D., Herring, S. C., Jantarasami, L., Mills, D. M., Saha, S., Sarofim, M. C., Trtanj, J., & Ziska, L. (2016, April). The Impacts of Climate Change on Human Health in the United States: A Scientific Assessment. U.S. Global Change Research Program. https://doi.org/http://dx.doi.org/10.7930/J0R49NQX
Crimmins, A. R. (editor), Avery, C. W. (editor), Easterling, D. R., Kunkel, K. E. (editor), Stewart, B. C. (editor), & Maycock, T. K. (editor). (2023). Fifth National Climate Assessment. U.S. National Climate Assessment. (noaa:61592). https://nca5.climate.us/
Cunsolo, A., & Ellis, N. R. (2018). Ecological grief as a mental health response to climate change-related loss. Nature Climate Change, 8(4), 275–281. https://doi.org/10.1038/s41558-018-0092-2
Cutler, C., & LaShomb, A. (2025, August 4). Wildfire haze prompts air quality concerns across the region. Https://Www.Wcax.Com. https://www.wcax.com/2025/08/04/air-quality-alerts-remain-effect-new-york/
D’Amato, G., & D’Amato, M. (2023). Climate change, air pollution, pollen allergy and extreme atmospheric events. Current Opinion in Pediatrics, 35(3), 356. https://doi.org/10.1097/MOP.0000000000001237
Dargin, J. S., & Mostafavi, A. (2020). Human-centric infrastructure resilience: Uncovering well-being risk disparity due to infrastructure disruptions in disasters. PLOS ONE, 15(6), e0234381. https://doi.org/10.1371/journal.pone.0234381
de Longueville, F., Ozer, P., Doumbia, S., & Henry, S. (2013). Desert dust impacts on human health: An alarming worldwide reality and a need for studies in West Africa. International Journal of Biometeorology, 57(1), 1–19. https://doi.org/10.1007/s00484-012-0541-y
Delfino, R. J., Brummel, S., Wu, J., Stern, H., Ostro, B., Lipsett, M., Winer, A., Street, D. H., Zhang, L., Tjoa, T., & Gillen, D. L. (2009). The relationship of respiratory and cardiovascular hospital admissions to the southern California wildfires of 2003. Occupational and Environmental Medicine, 66(3), 189–197. https://doi.org/10.1136/oem.2008.041376
Diuk-Wasser, M. A., VanAcker, M. C., & Fernandez, M. P. (2021). Impact of Land Use Changes and Habitat Fragmentation on the Eco-epidemiology of Tick-Borne Diseases. Journal of Medical Entomology, 58(4), 1546–1564. https://doi.org/10.1093/jme/tjaa209
Dominguez-Rodriguez, A., Apprich, F., Friehs, M. A., van der Graaf, S., & Steinrücke, J. (2025). Climate change news and doomscrolling: An examination of influencing factors and psychological effects. Acta Psychologica, 255, 104925. https://doi.org/10.1016/j.actpsy.2025.104925
Doran, E., Antonczak, B., King, P., Nilgitsalanont, A., Dwyer, A., Lombard, B., & Rowangould, G. (2023). Drivers of Heat Microenvironments and Exposure Risk in Small Cities and Rural Communities. 103, 7.4. https://ui.adsabs.harvard.edu/abs/2023AMS...10319245D
Doran, E. M. B., Reichard, W., Boothe, M., Donnell, G., Fan, H., Rowangould, G., & Guensler, R. (2025). Mitigating Extreme Heat Exposure Using Advanced and Novel Materials and Improved Pedestrian Infrastructure Design: A Systematic Literature Review and Survey of Agencies. https://doi.org/10.7922/G23J3BBH
Douthit, N., Kiv, S., Dwolatzky, T., & Biswas, S. (2015). Exposing some important barriers to health care access in the rural USA. Public Health, 129(6), 611–620. https://doi.org/10.1016/j.puhe.2015.04.001
Dowd, M. D. (2018). Vehicular Hyperthermia—A Highly Preventable and Potentially Fatal Problem. Pediatric Annals, 47(3), e88–e90. https://doi.org/10.3928/19382359-20180220-04
Duffort, L. (2023, July 31). The floodwaters disproportionately hit Vermont’s affordable housing stock—At the worst time. VTDigger. https://vtdigger.org/2023/07/31/the-flood-waters-disproportionately-hit-vermonts-affordable-housing-stock-at-the-worst-time/
Ebi, K. L., Capon, A., Berry, P., Broderick, C., Dear, R. de, Havenith, G., Honda, Y., Kovats, R. S., Ma, W., Malik, A., Morris, N. B., Nybo, L., Seneviratne, S. I., Vanos, J., & Jay, O. (2021). Hot weather and heat extremes: Health risks. The Lancet, 398(10301), 698–708. https://doi.org/10.1016/S0140-6736(21)01208-3
Eisen, R. J., Eisen, L., Ogden, N. H., & Beard, C. B. (2016). Linkages of Weather and Climate With Ixodes scapularis and Ixodes pacificus (Acari: Ixodidae), Enzootic Transmission of Borrelia burgdorferi , and Lyme Disease in North America. Journal of Medical Entomology, 53(2), 250–261. https://doi.org/10.1093/jme/tjv199
Eisenman, D. P., & Galway, L. P. (2022). The mental health and well-being effects of wildfire smoke: A scoping review. BMC Public Health, 22(1), 2274. https://doi.org/10.1186/s12889-022-14662-z
Energy Action Network. (2026a). 2023 APR: Key Findings | Energy Action Network. https://eanvt.org/2023-annual-report/2023-apr-key-findings/
Energy Action Network. (2026b). Vermont GHG Emissions Dashboard | Energy Action Network. https://eanvt.org/emissions-dashboard/
Feeding America. (2026). Hunger & Poverty in Vermont | Map the Meal Gap. https://map.feedingamerica.org/county/2023/overall/vermont
Fernandez, A., Black, J., Jones, M., Wilson, L., Salvador-Carulla, L., Astell-Burt, T., & Black, D. (2015). Flooding and Mental Health: A Systematic Mapping Review. PLOS ONE, 10(4), e0119929. https://doi.org/10.1371/journal.pone.0119929
Fielding, K. S., & Hornsey, M. J. (2016). A Social Identity Analysis of Climate Change and Environmental Attitudes and Behaviors: Insights and Opportunities. Frontiers in Psychology, 7. https://doi.org/10.3389/fpsyg.2016.00121
Finno, A., & Oliver, C. (2025, September 28). Vermont’s drought is straining communities and leading residents to suffer. VTDigger. https://vtdigger.org/2025/09/28/vermonts-drought-is-straining-communities-and-leading-residents-to-suffer/
Fischhoff, I. R., Keesing, F., & Ostfeld, R. S. (2019). Risk Factors for Bites and Diseases Associated With Black-Legged Ticks: A Meta-Analysis. American Journal of Epidemiology, 188(9), 1742–1750. https://doi.org/10.1093/aje/kwz130
Fisk, W. J., Lei-Gomez, Q., & Mendell, M. J. (2007). Meta-analyses of the associations of respiratory health effects with dampness and mold in homes. Indoor Air, 17(4), 284–296. https://doi.org/10.1111/j.1600-0668.2007.00475.x
Garcia-Silva, B., Handler, E., & Wolfe, J. (2017). A Public–Private Partnership to Mitigate Food Insecurity and Food Waste in Orange County, California. American Journal of Public Health, 107(1), 105–107. https://doi.org/10.2105/AJPH.2016.303450
Gardner Carson, L. (2025, June 16). Practice Greenhealth Honors UVM Medical Center with Top 25 Environmental Excellence Award, HC&O Reports. University of Vermont. UVM Larner College of Medicine. https://www.uvm.edu/larnermed/medcommunications/news/practice-greenhealth-honors-uvm-medical-center-top-25
Garrett, C. M., & Altman, R. (2024). Vulnerabilized: Revisiting the Language of the Vulnerable Populations Framework. American Journal of Public Health, 114(2), 177–179. https://doi.org/10.2105/AJPH.2023.307532
Gibbs, J., & Cappuccio, F. P. (2022). Plant-Based Dietary Patterns for Human and Planetary Health. Nutrients, 14(8), 1614. https://doi.org/10.3390/nu14081614
Giles, A. (2025, July 1). Vermont’s new climate plan enters a challenging political landscape. Vermont Public. https://www.vermontpublic.org/local-news/2025-07-01/vermonts-new-climate-plan-enters-a-challenging-political-landscape
Go! Vermont. (2026). Local Bus Routes. Vermont Agency of Transportation. Go! Vermont. https://www.connectingcommuters.org/information-and-schedules/bus-info/bus-providers/
Gould, C. V., Staples, J. E., Guagliardo, S. A. J., Martin, S. W., Lyons, S., Hills, S. L., Nett, R. J., & Petersen, L. R. (2025). West Nile Virus: A Review. JAMA, 334(7), 618–628. https://doi.org/10.1001/jama.2025.8737
Gould, L. H., Fee, R., White, J., Webb, N., Carlyle, M., Dick, L., Tan, Y., Walker, V., Angulo, F. J., Moïsi, J. C., Stark, J. H., & Pugh, S. (2025). Risk factors for Lyme disease among residents of rural, suburban, and urban areas in the United States: A case-control study. American Journal of Epidemiology, 194(8), 2287–2294. https://doi.org/10.1093/aje/kwae368
Gray, E., & Herwaldt, B. (2019). Babesiosis Surveillance—United States, 2011–2015. MMWR. Surveillance Summaries, 68. https://doi.org/10.15585/mmwr.ss6806a1
Green, D., O’Donnell, E., Johnson, M., Slater, L., Thorne, C., Zheng, S., Stirling, R., Chan, F. K. S., Li, L., & Boothroyd, R. J. (2021). Green infrastructure: The future of urban flood risk management? WIREs Water, 8(6), e1560. https://doi.org/10.1002/wat2.1560
Han, K. S., Kim, L., & Shim, I. (2012). Stress and sleep disorder. Experimental Neurobiology, 21(4), 141–150. https://doi.org/10.5607/en.2012.21.4.141
Harrington, K. (2024, December 18). “The Last Vermont Winter”: An Essay by Kimberly Harrington. Seven Days. https://www.sevendaysvt.com/arts-culture/the-last-vermont-winter-an-essay-by-kimberly-harrington-42489887/
Hayes, K., Blashki, G., Wiseman, J., Burke, S., & Reifels, L. (2018). Climate change and mental health: Risks, impacts and priority actions. International Journal of Mental Health Systems, 12(1), 28. https://doi.org/10.1186/s13033-018-0210-6
He, P., Xu, Z., Chan, D., Liu, P., & Bai, Y. (2025). Rising temperatures increase added sugar intake disproportionately in disadvantaged groups in the USA. Nature Climate Change, 15(9), 963–970. https://doi.org/10.1038/s41558-025-02398-8
Heilman, E. (2025, October 16). Twenty-nine cows, eight pigs and no water. Vermont Public. https://www.vermontpublic.org/local-news/2025-10-16/twenty-nine-cows-eight-pigs-and-no-water
Henry, S., Ospina, M. B., Dennett, L., & Hicks, A. (2021). Assessing the Risk of Respiratory-Related Healthcare Visits Associated with Wildfire Smoke Exposure in Children 0–18 Years Old: A Systematic Review. International Journal of Environmental Research and Public Health, 18(16), 8799. https://doi.org/10.3390/ijerph18168799
Hill, N. (2021, March 2). New American Climate Perspectives Survey. ecoAmerica. https://ecoamerica.org/american-climate-perspectives-survey-2021-vol-ii/
Hirschfeld, P. (2024, September 23). FEMA’s plodding bureaucracy exacts financial toll on Vermont towns. Vermont Public. https://www.vermontpublic.org/local-news/2024-09-23/fema-plodding-bureaucracy-puts-small-rural-vermont-towns-debt
Holder, A. L., Halliday, H. S., & Virtaranta, L. (2022). Impact of do-it-yourself air cleaner design on the reduction of simulated wildfire smoke in a controlled chamber environment. Indoor Air, 32(11), e13163. https://doi.org/10.1111/ina.13163
Holstius, D. M., Reid, C. E., Jesdale, B. M., & Morello-Frosch, R. (2012). Birth weight following pregnancy during the 2003 Southern California wildfires. Environmental Health Perspectives, 120(9), 1340–1345. https://doi.org/10.1289/ehp.1104515
Hondula, D. M., Gettel, A., Guardaro, M., Lin, H., Sexton-Wood, K., Warner, C., Watkins, L., & Witt, N. (2024). Re. The Role of Cooling Centers in Protecting Vulnerable Individuals from Extreme Heat. Epidemiology, 35(2), e4. https://doi.org/10.1097/EDE.0000000000001685
Horton, A. (2025). Hunger Free Vermont 2024 Annual Report [Annual Report]. https://www.hungerfreevt.org/2024-annual-report
Hough, E., & Cohen Tanugi-Carresse, A. (2024). Supporting Decarbonization of Health Systems-A Review of International Policy and Practice on Health Care and Climate Change. Current Environmental Health Reports, 11(2), 266–278. https://doi.org/10.1007/s40572-024-00434-x
Housing & Homelessness Alliance of Vermont. (2025). 2025 State of Homelessness in Vermont Report. Helping to House VT. https://helpingtohousevt.org/wp-content/uploads/2025/07/FINAL-State-of-Homelessness-2025.pdf
Hunger Free Vermont. (2026). Hunger Free Vermont. Hunger Free Vermont. https://www.hungerfreevt.org
Ismail, R., Warner, J. S., Chaudhry, M., Kozlowski, K., & Kaminsky, D. A. (2025). Impact of Wildfire Smoke on COPD and Asthma Exacerbation Prevalence and Lung Function. American Journal of Respiratory and Critical Care Medicine, 211(Supplement_1), A5407. https://doi.org/10.1164/ajrccm.2025.211.Abstracts.A5407
Jackson, P., & Meah, A. (2018). Re-assessing vulnerability to foodborne illness: Pathways and practices. Critical Public Health, 28(1), 81–93. CINAHL Complete (126248209). https://doi.org/10.1080/09581596.2017.1285008
Jain, P., Barber, Q. E., Taylor, S. W., Whitman, E., Castellanos Acuna, D., Boulanger, Y., Chavardès, R. D., Chen, J., Englefield, P., Flannigan, M., Girardin, M. P., Hanes, C. C., Little, J., Morrison, K., Skakun, R. S., Thompson, D. K., Wang, X., & Parisien, M.-A. (2024). Drivers and Impacts of the Record-Breaking 2023 Wildfire Season in Canada. Nature Communications, 15(1), 6764. https://doi.org/10.1038/s41467-024-51154-7
Johnston, F. H., Purdie, S., Jalaludin, B., Martin, K. L., Henderson, S. B., & Morgan, G. G. (2014). Air pollution events from forest fires and emergency department attendances in Sydney, Australia 1996–2007: A case-crossover analysis. Environmental Health, 13(1), 105. https://doi.org/10.1186/1476-069X-13-105
Katz, A. S., Hardy, B.-J., Firestone, M., Lofters, A., & Morton-Ninomiya, M. E. (2020). Vagueness, power and public health: Use of ‘vulnerable‘ in public health literature. Critical Public Health, 30(5), 601–611. https://doi.org/10.1080/09581596.2019.1656800
Keck, N. (2021, August 27). A Decade Later, Community Remembers Rutland Father And Son Who Lost Their Lives To Tropical Storm Irene. Vermont Public. https://www.vermontpublic.org/vpr-news/2021-08-27/a-decade-later-community-remembers-rutland-father-and-son-who-lost-their-live…
Kids and Car Safety. (2024). U.S. Child Hot Car Deaths Data Analysis from the Kids and Car Safety National Database (1990-2024). https://www.kidsandcars.org/document_center/download/hot-cars/Child-Hot-Car-Deaths-Data-Analysis.pdf
Kilpatrick, A. M., Meola, M. A., Moudy, R. M., & Kramer, L. D. (2008). Temperature, viral genetics, and the transmission of West Nile virus by Culex pipiens mosquitoes. PLoS Pathogens, 4(6), e1000092. https://doi.org/10.1371/journal.ppat.1000092
Kim, P., Maxwell, S., Parijat, N., Kim, D., & McNeely, C. L. (2024). Targeted Tick-Borne Disease Recognition: Assessing Risk for Improved Public Health. Healthcare, 12(10). https://doi.org/10.3390/healthcare12100984
Kim, S., Damialis, A., Charalampopoulos, A., Voelker, D. H., & Rorie, A. C. (2025). The Effect of Climate Change on Allergen and Irritant Exposure. The Journal of Allergy and Clinical Immunology. In Practice, 13(2), 266–273. https://doi.org/10.1016/j.jaip.2024.12.019
Kinney, P. L., Schwartz, J., Pascal, M., Petkova, E., Tertre, A. L., Medina, S., & Vautard, R. (2015). Winter season mortality: Will climate warming bring benefits? Environmental Research Letters, 10(6), 064016. https://doi.org/10.1088/1748-9326/10/6/064016
Kinzel, B., & McCullum, A. (2023, June 14). Gov. Scott allows universal free school meals to become law. Vermont Public. https://www.vermontpublic.org/local-news/2023-06-14/gov-phil-scott-allows-universal-free-school-meals-to-become-law
Klapp, A.-L., Wyma, N., Alessandrini, R., Ndinda, C., Perez-Cueto, A., & Risius, A. (2025). Recommendations to address the shortfalls of the EAT–Lancet planetary health diet from a plant-forward perspective. The Lancet Planetary Health, 9(1), e23–e33. https://doi.org/10.1016/S2542-5196(24)00305-X
Kostelnik, V. (2024, May 21). Winter in Vermont: Changes in Climate and Culture. Headwaters Magazine. https://www.headwatersmagazine.com/blog-1-1/winter-in-vermont-changes-in-climate-and-culture
Kovats, R. S., & Hajat, S. (2008). Heat stress and public health: A critical review. Annual Review of Public Health, 29(2008), 41–55. https://doi.org/10.1146/annurev.publhealth.29.020907.090843
Krasner, A., & Seals, B. (2020). Gas Stoves: Health and Air Quality Impacts and Solutions. RMI. https://rmi.org/insight/gas-stoves-pollution-health/
Kugeler, K., Mead, P., Schwartz, A., & Hinckley, A. (2022). Changing Trends in Age and Sex Distributions of Lyme Disease—United States, 1992-2016. Public Health Reports, 137(4), 655–659. https://doi.org/10.1177/00333549211026777
Kurganskiy, A., Creer, S., de Vere, N., Griffith, G. W., Osborne, N. J., Wheeler, B. W., McInnes, R. N., Clewlow, Y., Barber, A., Brennan, G. L., Hanlon, H. M., Hegarty, M., Potter, C., Rowney, F., Adams-Groom, B., Petch, G. M., Pashley, C. H., Satchwell, J., de Weger, L. A., … Skjøth, C. A. (2021). Predicting the severity of the grass pollen season and the effect of climate change in Northwest Europe. Science Advances, 7(13), eabd7658. https://doi.org/10.1126/sciadv.abd7658
Lafortune, S., Laplante, D. P., Elgbeili, G., Li, X., Lebel, S., Dagenais, C., & King, S. (2021). Effect of Natural Disaster-Related Prenatal Maternal Stress on Child Development and Health: A Meta-Analytic Review. International Journal of Environmental Research and Public Health, 18(16), 8332. https://doi.org/10.3390/ijerph18168332
Lakatos, K., Teherani, A., Thottathil, S. E., Gandhi, S., Weiser, S. D., & Brindis, C. D. (2023). A race to net zero—Early lessons from healthcare’s decarbonization marathon. Health Affairs Scholar, 1(1), qxad006. https://doi.org/10.1093/haschl/qxad006
Lake Champlain Basin Program. (2024a). 2024 Lake Champlain State of the Lake and Ecosystem Indicators Report. Lake Champlain Basin Program. https://www.lcbp.org/wp-content/uploads/2024/06/2024-State-of-the-Lake-Report.pdf
Lake Champlain Basin Program. (2024b, July 23). Partners Revitalize Raise the Blade, a Campaign to Reduce Stormwater Runoff to Lake Champlain [7/23/2024]. Lake Champlain Basin Program. https://www.lcbp.org/2024/07/partners-revitalize-raise-the-blade-a-campaign-to-reduce-stormwater-runoff-to-lake-champlain/
Lake Champlain Sea Grant. (2025). Reducing Use of Deicing Salt for Homeowners. https://www.uvm.edu/seagrant/reducing-use-deicing-salt-homeowners
Lake, I. R., & Barker, G. C. (2018a). Climate Change, Foodborne Pathogens and Illness in Higher-Income Countries. Current Environmental Health Reports, 5(1), 187–196. https://doi.org/10.1007/s40572-018-0189-9
Lake, I. R., & Barker, G. C. (2018b). Climate Change, Foodborne Pathogens and Illness in Higher-Income Countries. Current Environmental Health Reports, 5(1), 187–196. https://doi.org/10.1007/s40572-018-0189-9
Lemon Fair Insect Control District. (2026). Insect Control District | Lemon Fair Insect Control District | Weybridge. LFICD. https://www.lficd.org
Lenzen, M., Malik, A., Li, M., Fry, J., Weisz, H., Pichler, P.-P., Chaves, L. S. M., Capon, A., & Pencheon, D. (2020). The environmental footprint of health care: A global assessment. The Lancet Planetary Health, 4(7), e271–e279. https://doi.org/10.1016/S2542-5196(20)30121-2
Levy, K., Smith, S. M., & Carlton, E. J. (2018). Climate Change Impacts on Waterborne Diseases: Moving Toward Designing Interventions. Current Environmental Health Reports, 5(2), 272–282. https://doi.org/10.1007/s40572-018-0199-7
Lin, S., Sun, M., Fitzgerald, E., & Hwang, S.-A. (2016). Did summer weather factors affect gastrointestinal infection hospitalizations in New York State? Science of The Total Environment, 550, 38–44. https://doi.org/10.1016/j.scitotenv.2015.12.153
Liu, Y., L. Goodrick, S., & A. Stanturf, J. (2013). Future U.S. wildfire potential trends projected using a dynamically downscaled climate change scenario. Forest Ecology and Management, The Mega-Fire Reality, 294, 120–135. https://doi.org/10.1016/j.foreco.2012.06.049
Lundgren-Kownacki, K., Hornyanszky, E. D., Chu, T. A., Olsson, J. A., & Becker, P. (2018). Challenges of using air conditioning in an increasingly hot climate. International Journal of Biometeorology, 62(3), 401–412. https://doi.org/10.1007/s00484-017-1493-z
Maassel, A. K., Brochu, P., Harder, V. S., Ricketts, T. H., Teach, S. J., & Robinson, K. J. (2025). Wildfire smoke and pediatric asthma control in the Northeastern United States: A cross-sectional study. Environmental Health, 24(1), 91. https://doi.org/10.1186/s12940-025-01245-9
Maclachlan, L., Betnér, S., Lind, T., Georgelis, A., & Lõhmus, M. (2025). The association between zero-crossing temperatures and accidents due to icy conditions. Scandinavian Journal of Public Health, 53(2), 156–161. https://doi.org/10.1177/14034948221148046
Maibach, E. W., Kreslake, J. M., Roser-Renouf, C., Rosenthal, S., Feinberg, G., & Leiserowitz, A. A. (2015). Do Americans Understand That Global Warming Is Harmful to Human Health? Evidence From a National Survey. Annals of Global Health, Climate Change, Global Health and Human Rights, 81(3), 396–409. https://doi.org/10.1016/j.aogh.2015.08.010
Malinak, E. (2024, August 5). Survivors know flood damage can cause trauma. Professionals are fanning out to help. VTDigger. https://vtdigger.org/2024/08/05/survivors-know-flood-damage-can-cause-trauma-professionals-are-fanning-out-to-help/
Mareedu, N., Schotthoefer, A. M., Tompkins, J., Hall, M. C., Fritsche, T. R., & Frost, H. M. (2017). Risk Factors for Severe Infection, Hospitalization, and Prolonged Antimicrobial Therapy in Patients with Babesiosis. The American Journal of Tropical Medicine and Hygiene, 97(4), 1218–1225. https://doi.org/10.4269/ajtmh.17-0146
Marsooli, R., Lin, N., Emanuel, K., & Feng, K. (2019). Climate change exacerbates hurricane flood hazards along US Atlantic and Gulf Coasts in spatially varying patterns. Nature Communications, 10(1), 3785. https://doi.org/10.1038/s41467-019-11755-z
Marx, M. A., Rodriguez, C. V., Greenko, J., Das, D., Heffernan, R., Karpati, A. M., Mostashari, F., Balter, S., Layton, M., & Weiss, D. (2006). Diarrheal Illness Detected Through Syndromic Surveillance After a Massive Power Outage: New York City, August 2003. American Journal of Public Health, 96(3), 547–553. https://doi.org/10.2105/AJPH.2004.061358
McCarthy, G., Littell, D., Burt, L., Burack, T., Grannis, A., Sullivan, W. M., & Crombie, G. (2007, October 24). Re: Northeast regional mercury TMDL [Letter]. https://dec.vermont.gov/sites/dec/files/documents/WSMD_mapp_TMDL_Northeast_Mercury.pdf
McCollough, M. (2018). RMSF and Serious Tick-Borne Illnesses (Lyme, Ehrlichiosis, Babesiosis and Tick Paralysis). In E. Rose (Ed.), Life-Threatening Rashes: An Illustrated, Practical Guide (pp. 215–240). Springer International Publishing. https://doi.org/10.1007/978-3-319-75623-3_16
Mcdonnell, A., Lotemplio, S., Scott, E., & Strayer, D. (2025). Nature images are more visually engaging than urban images: Evidence from neural oscillations in the brain. FRONTIERS IN HUMAN NEUROSCIENCE, 19. (WOS:001520166900001). https://doi.org/10.3389/fnhum.2025.1575102
McDonnell, A., & Strayer, D. (2024). The influence of a walk in nature on human resting brain activity: A randomized controlled trial. SCIENTIFIC REPORTS, 14(1). (WOS:001378238200001). https://doi.org/10.1038/s41598-024-78508-x
Mead, P., Hook, S., Niesobecki, S., Ray, J., Meek, J., Delorey, M., Prue, C., & Hinckley, A. (2018). Risk factors for tick exposure in suburban settings in the Northeastern United States. Ticks and Tick-Borne Diseases, 9(2), 319–324. https://doi.org/10.1016/j.ttbdis.2017.11.006
Meddaugh, P. (2023a). Cardiovascular Disease (CVD) Risk Prevalence among Vermont Adults Never Diagnosed with CVD by Social Determinants of Health, 2017-2021 [Map]. Vermont Department of Health. https://www.healthvermont.gov/sites/default/files/document/hsi-cardivascular-risk-priority-map.pdf
Meddaugh, P. (2023b). Living with Food Insecurity: Risk Factors, Quality of Life, and Chronic Disease Rates. Vermont Department of Health. https://www.healthvermont.gov/sites/default/files/document/hsi-chronic-disease-living-with-food-insecurity.pdf
Meddaugh, P. (2024). Impact of Food Insecurity on Cardiovascular Disease (CVD). Vermont Department of Health. https://www.healthvermont.gov/sites/default/files/document/HSI_databrief_CVD_foodsecurity_071824.pdf
Mendell, M. J., Mirer, A. G., Cheung, K., Tong, M., & Douwes, J. (2011). Respiratory and allergic health effects of dampness, mold, and dampness-related agents: A review of the epidemiologic evidence. Environmental Health Perspectives, 119(6), 748–756. https://doi.org/10.1289/ehp.1002410
Metts, T. A. (2008). Addressing Environmental Health Implications of Mold Exposure after Major Flooding. AAOHN Journal, 56(3), 115–122. https://doi.org/10.1177/216507990805600304
Millar, S., Parizeau, K., & Fraser, E. D. G. (2020). The Limitations of Using Wasted Food to “Feed Hungry People.” Journal of Hunger & Environmental Nutrition, 15(4), 574–584. https://doi.org/10.1080/19320248.2020.1730292
Mobile Crisis of Vermont. (2026). About Mobile Crisis of Vermont. https://gethelpvt.org/about-mobile-crisis-vermont/
Morey, J. N., Boggero, I. A., Scott, A. B., & Segerstrom, S. C. (2015). Current directions in stress and human immune function. Current Opinion in Psychology, Health Behavior, 5, 13–17. https://doi.org/10.1016/j.copsyc.2015.03.007
Morgan, H., & Goodrich, A. (2024, February 20). Child hospitalized following Lake Memphremagog ice rescue. Https://Www.Wcax.Com. https://www.wcax.com/2024/02/20/child-hospitalized-following-lake-memphremagog-ice-rescue/
Mutebi, J.-P., Swope, B. N., Saxton-Shaw, K. D., Graham, A. C., Turmel, J. P., & Berl, E. (2012). Eastern Equine Encephalitis in Moose (Alces americanus) in Northeastern Vermont. Journal of Wildlife Diseases, 48(4), 1109–1112. https://doi.org/10.7589/2012-03-076
Myers, S. S., Smith, M. R., Guth, S., Golden, C. D., Vaitla, B., Mueller, N. D., Dangour, A. D., & Huybers, P. (2017). Climate Change and Global Food Systems: Potential Impacts on Food Security and Undernutrition. In Annual Review of Public Health (Vol. 38, Issue Volume 38, 2017, pp. 259–277). Annual Reviews. https://doi.org/https://doi.org/10.1146/annurev-publhealth-031816-044356
National Academy of Medicine. (2021, September 27). National Academy of Medicine Launches Action Collaborative on Decarbonizing the U.S. Health Sector—NAM. https://nam.edu/news-and-insights/national-academy-of-medicine-launches-action-collaborative-on-decarbonizing-the-u-s-health-se…
National Institutes of Health. (2025, June 13). Person-first and Destigmatizing Language. https://www.nih.gov/nih-style-guide/person-first-destigmatizing-language
National Weather Service. (2016, May 13). 2011 Flood Fatalities by State and Location. Weather.Gov. https://www.weather.gov/media/hazstat/flood11.pdf
National Weather Service. (2024, May 9). 2023 Flood Fatalities by State and Location. Weather.Gov. https://www.weather.gov/media/hazstat/flood23.pdf
National Weather Service. (2025a). Burlington, Vermont Heat Waves. https://www.weather.gov/media/btv/climo/extremes/heatwave.pdf
National Weather Service. (2025b). Cold Water Hazards and Safety. NOAA’s National Weather Service. https://www.weather.gov/safety/coldwater
National Weather Service. (2025c). What is the heat index? NOAA’s National Weather Service. https://www.weather.gov/ama/heatindex
National Weather Service. (2025d, September 15). 2024 Flood Fatalities by State and Location. Weather.Gov. https://www.weather.gov/media/hazstat/flood24.pdf
Neff, R. A., Kanter, R., & Vandevijvere, S. (2015). Reducing Food Loss And Waste While Improving The Public’s Health. Health Affairs, 34(11), 1821-5A. https://doi.org/10.1377/hlthaff.2015.0647
New England Feeding New England. (2023). Vermont State Brief. New England Feeding New England. https://www.vtfarmtoplate.com/resources/vermont-state-brief-new-england-feeding-new-england
New England Feeding New England. (2026). Local Food Count. New England Feeding New England. https://nefoodsystemplanners.org/dashboard_posts/local-food-count/
New Jersey Department of Health. (2025, March 10). Anaplasmosis. New Jersey Department of Health. https://www.nj.gov/health/cd/documents/chapters/anaplasmosis.pdf
Niles, M., Alpaugh, M., Bertmann, F., Belarmino, E., Bliss, S., Laurent, J., Malacarne, J., McCarthy, A., Merrill, S., Schattman, R., & Yerxa, K. (2021, January 1). Home Food Production and Food Security Since the COVID-19 Pandemic. National Food Acces and COVID Research Team. NFACT: National Food Acces and COVID Research Team. https://www.nfactresearch.org/vermont-policy-briefs
NOAA National Centers for Environmental Information. (2023). Monthly National Climate Report for February 2023. https://www.ncei.noaa.gov/access/monitoring/monthly-report/national/202302
North, C. S., Kawasaki, A., Spitznagel, E. L., & Hong, B. A. (2004). The Course of PTSD, Major Depression, Substance Abuse, and Somatization After a Natural Disaster. The Journal of Nervous and Mental Disease, 192(12), 823. https://doi.org/10.1097/01.nmd.0000146911.52616.22
Office of Ground Water and Drinking Water. (2021, May). Addressing nitrate in drinking water with the drinking water state revolving fund. Environmental Protection Agency. https://www.epa.gov/sites/default/files/2021-06/documents/addressing_nitrates_with_the_dwsrf-final.pdf
Oliver, C. (2025, September 25). EEE detected in mosquitos in three Vermont counties. VTDigger. https://vtdigger.org/2025/09/25/eee-detected-in-mosquitos-in-three-vermont-counties/
Orlando, S., Mosconi, C., De Santo, C., Emberti Gialloreti, L., Inzerilli, M. C., Madaro, O., Mancinelli, S., Ciccacci, F., Marazzi, M. C., Palombi, L., & Liotta, G. (2021). The Effectiveness of Intervening on Social Isolation to Reduce Mortality during Heat Waves in Aged Population: A Retrospective Ecological Study. International Journal of Environmental Research and Public Health, 18(21), 11587. https://doi.org/10.3390/ijerph182111587
Orr, A., A. L. Migliaccio, C., Buford, M., Ballou, S., & Migliaccio, C. T. (2020). Sustained Effects on Lung Function in Community Members Following Exposure to Hazardous PM2.5 Levels from Wildfire Smoke. Toxics, 8(3), 53. https://doi.org/10.3390/toxics8030053
Ostfeld, R. (2011). An Overview of Tick-Borne Diseases: A System’s Approach to Understanding Tick-borne Diseases: People, Animals, and Ecosystems. In Critical Needs and Gaps in Understanding Prevention, Amelioration, and Resolution of Lyme and Other Tick-Borne Diseases: The Short-Term and Long-Term Outcomes: Workshop Report. National Academies Press (US). https://www.ncbi.nlm.nih.gov/books/NBK57013/
Otter Creek Watershed Insect Control District. (2011, February 18). About Us. OCWICD. https://ocwicd.com/about/
Pacheco, S. E., Guidos-Fogelbach, G., Annesi-Maesano, I., Pawankar, R., D’ Amato, G., Latour-Staffeld, P., Urrutia-Pereira, M., Kesic, M. J., & Hernandez, M. L. (2021). Climate change and global issues in allergy and immunology. Journal of Allergy and Clinical Immunology, 148(6), 1366–1377. https://doi.org/10.1016/j.jaci.2021.10.011
Pakdehi, M., Ahmadisharaf, E., Azimi, P., Yan, Z., Keshavarz, Z., Caballero, C., & Allen, J. G. (2025). Modeling the latent impacts of extreme floods on indoor mold spores in residential buildings: Application of machine learning algorithms. Environment International, 196, 109319. https://doi.org/10.1016/j.envint.2025.109319
Parker, C. L., Wellbery, C. E., & Mueller, M. (2019). The Changing Climate: Managing Health Impacts. American Family Physician, 100(10), 618–626. https://www.aafp.org/pubs/afp/issues/2019/1115/p618.pdf
Parnes, M. F., Amort, B., Calderon-Smith, C., Chambers, E. C., & Musicaro, R. (2024). Child and Adolescent Engagement with Climate Change on Social Media and Impacts on Mental Health: A Narrative Review. Current Pediatrics Reports, 12(4), 158–167. https://doi.org/10.1007/s40124-024-00331-9
Patterson, B. (2025, December 11). Canadian Wildfire Smoke Worsened Pediatric Asthma in U.S. Northeast: UVM Study. University of Vermont. https://www.uvm.edu/gund/news/canadian-wildfire-smoke-worsened-pediatric-asthma-us-northeast-uvm-study
Peek-Asa, C., Ramirez, M., Young, T., & Cao, Y. (2012). Flood-Related Work Disruption and Poor Health Outcomes Among University Students. Prehospital and Disaster Medicine, 27(6), 503–508. https://doi.org/10.1017/S1049023X1200129X
Picetti, R., Deeney, M., Pastorino, S., Miller, M. R., Shah, A., Leon, D. A., Dangour, A. D., & Green, R. (2022). Nitrate and nitrite contamination in drinking water and cancer risk: A systematic review with meta-analysis. Environmental Research, 210, 112988. https://doi.org/10.1016/j.envres.2022.112988
Pogreba-Brown, K., Boyd, K., Schaefer, K., Austhof, E., Armstrong, A., Owusu-Dommey, A., Villa-Zapata, L., Arora, M., McClelland, J., & Hoffman, S. (2022). Complications Associated with Foodborne Listeriosis: A Scoping Review | Foodborne Pathogens and Disease. Foodborne Pathogens and Disease, 19(11). https://doi.org/https://doi.org/10.1089/fpd.2022.0012
Price, D., Hughes, K. M., Thien, F., & Suphioglu, C. (2021). Epidemic Thunderstorm Asthma: Lessons Learned from the Storm Down-Under. The Journal of Allergy and Clinical Immunology: In Practice, 9(4), 1510–1515. https://doi.org/10.1016/j.jaip.2020.10.022
Price, M., Hidalgo, J. E., Bird, Y. M., Bloomfield, L. S. P., Buck, C., Cerutti, J., Dodds, P. S., Fudolig, M. I., Gehman, R., Hickok, M., Kim, J., Llorin, J., Lovato, J., McGinnis, E. W., McGinnis, R. S., Norton, R., Ramirez, V., Stanton, K., Ricketts, T. H., & Danforth, C. M. (2023). A large clinical trial to improve well-being during the transition to college using wearables: The lived experiences measured using rings study. Contemporary Clinical Trials, 133, 107338. https://doi.org/10.1016/j.cct.2023.107338
Ramin, B., & Svoboda, T. (2009). Health of the Homeless and Climate Change. Journal of Urban Health : Bulletin of the New York Academy of Medicine, 86(4), 654–664. https://doi.org/10.1007/s11524-009-9354-7
Rappold, A. G., Stone, S. L., Cascio, W. E., Neas, L. M., Kilaru, V. J., Carraway, M. S., Szykman, J. J., Ising, A., Cleve, W. E., Meredith, J. T., Vaughan-Batten, H., Deyneka, L., & Devlin, R. B. (2011). Peat Bog Wildfire Smoke Exposure in Rural North Carolina Is Associated with Cardiopulmonary Emergency Department Visits Assessed through Syndromic Surveillance. Environmental Health Perspectives, 119(10), 1415–1420. https://doi.org/10.1289/ehp.1003206
Rebman, A. W., Yang, T., Yoon, I., Powell, D., Geller, S. A., & Aucott, J. N. (2023). Initial Presentation and Time to Treatment in Early Lyme Disease. The American Journal of Tropical Medicine and Hygiene, 108(4), 734–737. https://doi.org/10.4269/ajtmh.22-0437
Reid, C. E., Brauer, M., Johnston, F. H., Jerrett, M., Balmes, J. R., & Elliott, C. T. (2016). Critical Review of Health Impacts of Wildfire Smoke Exposure. Environmental Health Perspectives, 124(9), 1334–1343. https://doi.org/10.1289/ehp.1409277
Ren, Q., Panikkar, B., Mares, T., Berlin, L., & Golder, C. (2023). Food justice in Vermont’s environmentally vulnerable communities. Agriculture and Human Values, 40(4), 1465–1479. https://doi.org/10.1007/s10460-023-10431-9
Riggs, M. A., Rao, C. Y., Brown, C. M., Van Sickle, D., Cummings, K. J., Dunn, K. H., Deddens, J. A., Ferdinands, J., Callahan, D., Moolenaar, R. L., & Pinkerton, L. E. (2008). Resident cleanup activities, characteristics of flood-damaged homes and airborne microbial concentrations in New Orleans, Louisiana, October 2005. Environmental Research, Special Section: 8th International Conference on the Protection and Restoration of the Environment, 106(3), 401–409. https://doi.org/10.1016/j.envres.2007.11.004
Robinson, S. (2023, July 19). ‘Total destruction’: Flooding knocks out Johnson’s wastewater plant, disrupts operations elsewhere. VTDigger. https://vtdigger.org/2023/07/18/total-destruction-flooding-knocks-out-johnsons-wastewater-plant-disrupts-operations-elsewhere/
Romanello, M., Walawender, M., Hsu, S.-C., Moskeland, A., Palmeiro-Silva, Y., Scamman, D., Smallcombe, J. W., Abdullah, S., Ades, M., Al-Maruf, A., Ameli, N., Angelova, D., Ayeb-Karlsson, S., Ballester, J., Basagaña, X., Bechara, H., Beggs, P. J., Cai, W., Campbell-Lendrum, D., … Costello, A. (2025). The 2025 report of the Lancet Countdown on health and climate change: Climate change action offers a lifeline. The Lancet, 406(10521), 2804–2857. https://doi.org/10.1016/S0140-6736(25)01919-1
Roome, A., Trombley, D., Kern, M., Scribani, M., Jenkins, P., Ostfeld, R., & Sorensen, J. (2026). Ticking Time Bomb: The Escalating Threat of Tick-Borne Diseases in Rural Farming Communities. Journal of Agromedicine, 31(1), 102–108. https://doi.org/10.1080/1059924X.2025.2579639
Rowney, F. M., Brennan, G. L., Skjøth, C. A., Griffith, G. W., McInnes, R. N., Clewlow, Y., Adams-Groom, B., Barber, A., de Vere, N., Economou, T., Hegarty, M., Hanlon, H. M., Jones, L., Kurganskiy, A., Petch, G. M., Potter, C., Rafiq, A. M., Warner, A., Wheeler, B., … Creer, S. (2021). Environmental DNA reveals links between abundance and composition of airborne grass pollen and respiratory health. Current Biology, 31(9), 1995-2003.e4. https://doi.org/10.1016/j.cub.2021.02.019
Salubi, E. A., Gizaw, Z., Schuster-Wallace, C. J., & Pietroniro, A. (2024). Climate change and waterborne diseases in temperate regions: A systematic review. Journal of Water and Health, 23(1), 58–78. https://doi.org/10.2166/wh.2024.314
Saunders, R., Weiler, B., Scherrer, P., & Zeppel, H. (2019). Best practice principles for communicating safety messages in national parks. Journal of Outdoor Recreation and Tourism, 25, 132–142. https://doi.org/10.1016/j.jort.2018.01.006
Saxton-Shaw, K. D., Ledermann, J. P., Kenney, J. L., Berl, E., Graham, A. C., Russo, J. M., Powers, A. M., & Mutebi, J.-P. (2015). The First Outbreak of Eastern Equine Encephalitis in Vermont: Outbreak Description and Phylogenetic Relationships of the Virus Isolate. PLoS ONE, 10(6), e0128712. https://doi.org/10.1371/journal.pone.0128712
Schweitzer, M. D., Calzadilla, A. S., Salamo, O., Sharifi, A., Kumar, N., Holt, G., Campos, M., & Mirsaeidi, M. (2018). Lung health in era of climate change and dust storms. Environmental Research, 163, 36–42. https://doi.org/10.1016/j.envres.2018.02.001
Seervai, S., Gustafsson, L., & Abrams, M. (2022, April 19). How the U.S. Health Care System Contributes to Climate Change. The Commonwealth Fund. The Commonwealth Fund. https://doi.org/10.26099/m2nn-gh13
Semenza, J. C., & Ko, A. I. (2023). Waterborne Diseases That Are Sensitive to Climate Variability and Climate Change. New England Journal of Medicine, 389(23), 2175–2187. https://doi.org/10.1056/NEJMra2300794
Sk802 Burlington. (2025). https://sites.google.com/view/sk802burlington/
Skryabina, E., Taylor, G., & Stallard, P. (2016). Effect of a universal anxiety prevention programme (FRIENDS) on children’s academic performance: Results from a randomised controlled trial. Journal of Child Psychology and Psychiatry, and Allied Disciplines, 57(11), 1297–1307. https://doi.org/10.1111/jcpp.12593
Smith, C. J. (2019). Pediatric Thermoregulation: Considerations in the Face of Global Climate Change. Nutrients, 11(9), 2010. https://doi.org/10.3390/nu11092010
Soares, J., Santos, C., Carvalho, S., Pintado, M., & Vasconcelos, M. (2019). Preserving the nutritional quality of crop plants under a changing climate: Importance and strategies. PLANT AND SOIL, 443(1–2), 1–26. (WOS:000493661800001). https://doi.org/10.1007/s11104-019-04229-0
Soares, R., A. Balerna, J., Quainoo, R., C. Merrill, S., Ali-Khan, M., Shrum, T. R., & Koliba, C. J. (2025). “The Great Vermont Floods of 2023”: A Risk and Crisis Communication Assessment. Society & Natural Resources, 0(0), 1–23. https://doi.org/10.1080/08941920.2025.2553353
Springmann, M., Godfray, H. C. J., Rayner, M., & Scarborough, P. (2016). Analysis and valuation of the health and climate change cobenefits of dietary change. Proceedings of the National Academy of Sciences, 113(15), 4146–4151. https://doi.org/10.1073/pnas.1523119113
Stager, J., & Thill, M. (2010). Climate change in the champlain basin: What natural resource managers can expect and do (p. 44). The Nature Conservancy. https://www.northeastans.org/docs/meetings/201412/files/Champlain%20climate%20report%205.17.10.pdf
Stanke, C., Kerac, M., Prudhomme, C., Medlock, J., & Murray, V. (2013). Health Effects of Drought: A Systematic Review of the Evidence. PLoS Currents, 5, https://doi.org/10.1371/currents.dis.7a2cee9e980f91ad7697b570bcc4b004
Steptoe, A., & Kivimäki, M. (2012). Stress and cardiovascular disease. Nature Reviews Cardiology, 9(6), 360–370. https://doi.org/10.1038/nrcardio.2012.45
Sun, S., Weinberger, K. R., Nori-Sarma, A., Spangler, K. R., Sun, Y., Dominici, F., & Wellenius, G. A. (2021). Ambient heat and risks of emergency department visits among adults in the United States: Time stratified case crossover study. BMJ, 375, e065653. https://doi.org/10.1136/bmj-2021-065653
Swinton, M. W., & Nierzwicki-Bauer, S. A. (2020). Mercury increase in Lake Champlain fish: Links to fishery dynamics and extreme climatic events. Ecotoxicology, 29(10), 1750–1761. https://doi.org/10.1007/s10646-019-02148-5
Tanier, J. (2023, August 3). How flood damage to Vermont’s farms is changing food assistance programs. Vermont Public. https://www.vermontpublic.org/local-news/2023-08-03/how-flood-damage-to-vermonts-farms-is-changing-food-assistance-programs
Tchonkouang, R. D., Onyeaka, H., & Nkoutchou, H. (2024). Assessing the vulnerability of food supply chains to climate change-induced disruptions. Science of The Total Environment, 920, 171047. https://doi.org/10.1016/j.scitotenv.2024.171047
TEDx Talks. (2019, January 25). The Power of Multisolving for People and Climate | Elizabeth Sawin | TEDxSunValley [Video recording]. https://www.youtube.com/watch?v=prF8trTallQ
The Farm to Plate Network. (2021). Vermont Agriculture & Food System Strategic Plan 2021-2030. The Farm to Plate Network. https://agriculture.vermont.gov/sites/agriculture/files/doc_library/Vermont%20Agriculture%20and%20Food%20System%20Strategic%20P…
The Flood Safety Act. (2024). Vermont’s Flood Safety Act of 2024. https://floodready.vermont.gov/flood-safety-act
Thiery, W., Lange, S., Rogelj, J., Schleussner, C.-F., Gudmundsson, L., Seneviratne, S. I., Andrijevic, M., Frieler, K., Emanuel, K., Geiger, T., Bresch, D. N., Zhao, F., Willner, S. N., Büchner, M., Volkholz, J., Bauer, N., Chang, J., Ciais, P., Dury, M., … Wada, Y. (2021). Intergenerational inequities in exposure to climate extremes. Science, 374(6564), 158–160. https://doi.org/10.1126/science.abi7339
Thomas, M. (2006). Allergic rhinitis: Evidence for impact on asthma. BMC Pulmonary Medicine, 6(1), S4. https://doi.org/10.1186/1471-2466-6-S1-S4
Thomas, S. (2025, September 9). UVM Medical Center’s new practice has environmental perks. Gray Media. Https://Www.Wcax.Com. https://www.wcax.com/2025/09/09/uvm-medical-centers-new-practice-has-environmental-perks/
Tiso, M., & Schechter, A. N. (2015). Nitrate Reduction to Nitrite, Nitric Oxide and Ammonia by Gut Bacteria under Physiological Conditions. PLoS ONE, 10(3), e0119712. https://doi.org/10.1371/journal.pone.0119712
Uppalapati, S., Ansah, P., Campbell, E., Gour, N., Thier, K., Kotcher, J., & Maibach, E. (2023). A Global Review of Research on Effective Advocacy and Communication Strategies at the Intersection of Climate Change and Health. George Mason University Center for Climate Change Communication. https://climatecommunication.gmu.edu/wp-content/uploads/2023/11/Climate-and-Health-Literature-Review-Final.pdf
U.S. Bureau of Labor Statistics. (2023, April 3). Vermont—May 2023 OEWS State Occupational Employment and Wage Estimates. Bureau of Labor Statistics. https://www.bls.gov/oes/2023/may/oes_vt.htm?utm#45-0000
U.S. Centers for Disease Control and Prevention. (2006). Mold Prevention Strategies and Possible Health Effects in the Aftermath of Hurricanes and Major Floods. https://www.cdc.gov/mmwr/preview/mmwrhtml/rr5508a1.htm?ref=driverlayer.com
U.S. Centers for Disease Control and Prevention. (2024a, February 21). Recognizing Hypothermia. Natural Disasters and Severe Weather. https://www.cdc.gov/natural-disasters/psa-toolkit/recognizing-hypothermia.html
U.S. Centers for Disease Control and Prevention. (2024b, February 27). About Babesiosis. Babesiosis. https://www.cdc.gov/babesiosis/about/index.html
U.S. Centers for Disease Control and Prevention. (2024c, May 15). About Jamestown Canyon. U.S. Centers for Disease Control and Prevention. https://www.cdc.gov/jamestown-canyon/about/index.html
U.S. Centers for Disease Control and Prevention. (2024d, September 26). Mold. Mold. https://www.cdc.gov/mold-health/about/index.html
U.S. Centers for Disease Control and Prevention. (2024e, September 26). Mold. Mold. https://www.cdc.gov/mold-health/about/index.html
U.S. Centers for Disease Control and Prevention. (2024f, October 29). Benefits of Physical Activity. Physical Activity Basics. https://www.cdc.gov/physical-activity-basics/benefits/index.html
U.S. Centers for Disease Control and Prevention. (2024g, November 5). Mercury | ToxFAQsTM | ATSDR. https://wwwn.cdc.gov/TSP/ToxFAQs/ToxFAQsDetails.aspx?faqid=113&toxid=24
U.S. Centers for Disease Control and Prevention. (2024h, December 10). Preferred Terms for Select Population Groups & Communities. Gateway to Health Communication. https://www.cdc.gov/health-communication/php/toolkit/preferred-terms.html
U.S. Centers for Disease Control and Prevention. (2025a, January 14). Pollen and Your Health. Climate and Health. https://www.cdc.gov/climate-health/php/effects/pollen-health.html
U.S. Centers for Disease Control and Prevention. (2025b, January 30). Risk and E. coli Infection. E. Coli Infection (Escherichia Coli). https://www.cdc.gov/ecoli/risk-factors/index.html
U.S. Centers for Disease Control and Prevention. (2025c, January 31). People at Increased Risk for Food Poisoning. Food Safety. https://www.cdc.gov/food-safety/risk-factors/index.html
U.S. Centers for Disease Control and Prevention. (2025d, February 3). Symptoms of Listeria Infection. Listeria Infection (Listeriosis). https://www.cdc.gov/listeria/signs-symptoms/index.html
U.S. Centers for Disease Control and Prevention. (2025e, February 25). Health Problems. Workplace Mold. https://www.cdc.gov/niosh/mold/health-problems/index.html
U.S. Centers for Disease Control and Prevention. (2025f, April 21). Estimates: Burden of Foodborne Illness in the United States. Food Safety. https://www.cdc.gov/food-safety/php/data-research/foodborne-illness-burden/index.html
U.S. Centers for Disease Control and Prevention. (2025g, June 11). Data and Maps for Jamestown Canyon. U.S. Centers for Disease Control and Prevention. https://www.cdc.gov/jamestown-canyon/data-maps/index.html
U.S. Centers for Disease Control and Prevention. (2025h, September 30). Safety Guidelines: Wildfires and Wildfire Smoke. Wildfires. https://www.cdc.gov/wildfires/safety/how-to-safely-stay-safe-during-a-wildfire.html
U.S. Centers for Disease Control and Prevention. (2026, February 11). Clinical Signs and Symptoms of West Nile Virus Disease. West Nile Virus. https://www.cdc.gov/west-nile-virus/hcp/clinical-signs/index.html
U.S. Department of Agriculture. (2015, March). Kitchen Companion: Your Safe Food Handbook. U.S. Department of Agriculture. https://www.fsis.usda.gov/sites/default/files/media_file/2020-12/Kitchen-Companion.pdf
U.S Department of Agriculture. (2024). Table 7. Hired Farm Labor—Workers and Payroll: 2022 (Vermont). USDA NASS. https://www.nass.usda.gov/Publications/AgCensus/2022/Full_Report/Volume_1%2C_Chapter_2_County_Level/Vermont/st50_2_007_007.pdf
U.S. Department of Agriculture Food and Nutrition Service. (2022). USDA Actions on Nutrition Security. U.S. Department of Agriculture Food and Nutrition Service. https://www.usda.gov/sites/default/files/documents/usda-actions-nutrition-security.pdf
U.S. Energy Information Administration. (2023). Highlights for air conditioning in U.S. homes by state, 2020. https://www.eia.gov/consumption/residential/data/2020/state/pdf/State%20Air%20Conditioning.pdf
U.S. Energy Information Administration. (2026, January 15). United States—U.S. Energy Information Administration (EIA). https://www.eia.gov/states/VT/analysis
U.S. Environmental Protection Agency. (2013a, March 27). Estimated Nitrate Concentrations in Groundwater Used for Drinking [Data and Tools]. https://www.epa.gov/nutrientpollution/estimated-nitrate-concentrations-groundwater-used-drinking
U.S. Environmental Protection Agency. (2013b, May 28). Wood Smoke and Your Health [Overviews and Factsheets]. https://www.epa.gov/burnwise/wood-smoke-and-your-health
U.S. Environmental Protection Agency. (2015a, September). Air Quality Flag Program Quick Start Guide. Air Quality Flag Program. https://www.airnow.gov/sites/default/files/2023-04/air-quality-flag-program-quick-start.pdf
U.S. Environmental Protection Agency. (2015b, September 3). Health Effects of Exposures to Mercury [Overviews and Factsheets]. https://www.epa.gov/mercury/health-effects-exposures-mercury
U.S. Environmental Protection Agency. (2016a). Excessive Heat Events Guidebook. Heat.Gov. https://heat.gov/tools-resources/excessive-heat-events-guidebook-epa/
U.S. Environmental Protection Agency. (2016b, January 12). Greenhouse Gas Emissions from a Typical Passenger Vehicle [Overviews and Factsheets]. https://www.epa.gov/greenvehicles/greenhouse-gas-emissions-typical-passenger-vehicle
U.S. Environmental Protection Agency. (2021, August 19). Research on DIY Air Cleaners to Reduce Wildfire Smoke Indoors [Overviews and Factsheets]. https://www.epa.gov/air-research/research-diy-air-cleaners-reduce-wildfire-smoke-indoors
U.S. Environmental Protection Agency. (2023a). Climate Change and Children’s Health and Well-Being in the United States (EPA 430-R-23-001). U.S. Environmental Protectin Agency. https://doi.org/10.1163/9789004322714_cclc_2023-0166-0788
U.S. Environmental Protection Agency. (2023b, July 31). EPA’s 2020 National Emissions Inventory and Trends Report. ArcGIS StoryMaps. https://storymaps.arcgis.com/stories/d7d730f974c6474190b142a49ae8d3bd
U.S. Environmental Protection Agency. (2023c, October 12). Quantifying Methane Emissions from Landfilled Food Waste [Data and Tools]. https://www.epa.gov/land-research/quantifying-methane-emissions-landfilled-food-waste
U.S. Environmental Protection Agency. (2025a, January 15). Climate Change Indicators: Lyme Disease. EPA. EPA. https://19january2025snapshot.epa.gov/climate-indicators/climate-change-indicators-lyme-disease/index.html#ref5
US Environmental Protection Agency. (2025b, December 1). National Primary Drinking Water Regulations [Overviews and Factsheets]. https://www.epa.gov/ground-water-and-drinking-water/national-primary-drinking-water-regulations
U.S. Federal Emergency Management Agency. (2024, January 2). Individual Assistance Snapshot DR 4720 VT. https://legislature.vermont.gov/Documents/2024/WorkGroups/House%20Environment/Climate%20Action/Flood%20Resiliency/W~Sue%20Minte…
Vatovec, C. (2025). Making a Planetary Health Case for Whole Person Health. Global Advances in Integrative Medicine and Health, 14, 27536130251388470. https://doi.org/10.1177/27536130251388470
Vega, S. L., Childs, M. L., Aggarwal, S., & Nethery, R. C. (2025). Wildfire Smoke Exposure and Cause-Specific Hospitalization in Older Adults. JAMA Network Open, 8(4), e257956–e257956. https://doi.org/10.1001/jamanetworkopen.2025.7956
Vermont Agency of Agriculture, Food & Markets. (2020). Vermont Survey for Tick-Borne Diseases Cumulative Report, 2015-2019. Vermont Agency of Agriculture, Food & Markets. https://agriculture.vermont.gov/sites/agriculture/files/MosquitoTick/AGR%20Tick%202015-2019%20Cumulative%20Report.pdf
Vermont Agency of Agriculture, Food & Markets. (2025). Vermont Survey for Tick-Borne Diseases: Cumulative Report, 2020-2024. Vermont Agency of Agriculture, Food & Markets. https://agriculture.vermont.gov/sites/agriculture/files/MosquitoTick/AGR%20Tick%202020-2024%20Cumulative%20Report.pdf
Vermont Agency of Agriculture, Food & Markets, & Vermont Department of Health. (2024, June). State of Vermont Arbovirus Surveillance and Response Plan: Revised June 2024. https://www.healthvermont.gov/sites/default/files/document/lsid-arbovirus-response-plan-2024.pdf
Vermont Agency of Agriculture Food and Markets. (2025, July 25). Mosquitoes Test Positive for West Nile and Jamestown Canyon Viruses | Agency of Agriculture Food and Markets. Vermont Agency of Agriculture Food and Markets. State of Vermont Agency of Agriculture Food and Markets. https://agriculture.vermont.gov/agency-agriculture-food-markets-news/mosquitoes-test-positive-west-nile-and-jamestown-canyon
Vermont Agency of Commerce and Development. (2023, July 28). State Historic Sites Reopen after Severe Flooding Events. https://accd.vermont.gov/press-releases/state-historic-sites-reopen-after-severe-flooding-events
Vermont Agency of Natural Resources. (2025). Family Fun. Vermont State Parks. https://www.vtstateparks.com/family-fun
Vermont Agency of Transportation. (2022). Vermont Agency of Transportation 2022 Fact Book and Annual Report. Vermont Agency of Transportation. https://vtrans.vermont.gov/sites/aot/files/documents/AOT%20Fact%20Book%202023%20-%20Compressed_0.pdf
Vermont Agency of Transportation. (2024). General Statistics. https://vtrans.vermont.gov/planning/maps/stats
Vermont Business Magazine. (2013, August 28). Tropical Storm Irene by the numbers. https://vermontbiz.com/news/2013/august/28/tropical-storm-irene-numbers
Vermont Center for Geographic Information. (2025, December 14). VT Nitrate Leaching Index. Vermont Open Geodata Portal. https://geodata.vermont.gov/datasets/vt-nitrate-leaching-index/data?geometry=-86.522,40.368,-58.397,45.971
Vermont Clean Water Act, 2015 Vt. Acts & Resolves No. 64 (2015). https://legislature.vermont.gov/Documents/2016/Docs/ACTS/ACT064/ACT064%20As%20Enacted.pdf
Vermont Climate Council. (2025). Vermont 2025 Climate Action Plan Priority Recommendations. Vermont Climate Council. https://outside.vermont.gov/agency/anr/climatecouncil/Shared%20Documents/Vermont_Climate_Council/CAP2025_RecommendedPriorityAct…
Vermont Department of Environmental Conservation. (2024). 2023 Vermont Waste Composition Study. Vermont Department of Environmental Conservation. https://dec.vermont.gov/sites/dec/files/wmp/SolidWaste/Documents/2023-VT-Waste-Composition-Study.pdf
Vermont Department of Environmental Conservation. (2025, April 21). Vermont’s 2024 Priority Waters List (Impaired)—Data. https://www.arcgis.com/home/item.html?id=90121fa0c9fd447797c5491a14395f1c#data
Vermont Department of Environmental Conservation. (2026a). Chemical Contaminants | Department of Environmental Conservation. https://dec.vermont.gov/water/drinking-water/water-quality-monitoring/chemical-monitoring
Vermont Department of Environmental Conservation. (2026b). Clean Water Interactive Dashboard. Clean Water Interactive Dashboard. https://app.powerbigov.us/view?r=eyJrIjoiMzVjODgzZmQtYmMzMi00OGE5LTkzNGMtOWIzZjQ4MWY1NTlkIiwidCI6IjIwYjQ5MzNiLWJhYWQtNDMzYy05Yz…
Vermont Department of Environmental Conservation. (2026c). Cyanotoxin Monitoring Program | Department of Environmental Conservation. https://dec.vermont.gov/water/drinking-water/water-quality-monitoring/cyanobacteria/cyanotoxin-monitoring-program
Vermont Department of Environmental Conservation. (2026d). DEC PWS Drought Reports. https://experience.arcgis.com/experience/1ca6197412c64163937d7fb7cc220582#data_s=id%3AdataSource_4-1999b5343b8-layer-10-1999b1f…
Vermont Department of Forests, Parks and Recreation. (2026). Forest Carbon | Department of Forests, Parks and Recreation. https://fpr.vermont.gov/anr/forest/climate-change/forest-carbon
Vermont Department of Health. (2015, August). Cyanobacteria (Blue-green Algae) Guidance for Vermont Communities. Vermont Department of Health. https://www.healthvermont.gov/sites/default/files/documents/pdf/ENV_RW_CyanobacteriaGuidance.pdf
Vermont Department of Health. (2016, September). Vermont Climate and Health Profile Report. Vermont Department of Health. https://www.healthvermont.gov/sites/default/files/documents/pdf/ENV_CH_ProfileReport.pdf
Vermont Department of Health. (2017, December). Wood Heat and Indoor Air Quality. Vermont Department of Health. https://healthvermont.org/sites/default/files/documents/pdf/ENV_CH_WoodHeat%26IndoorAirQuality.pdf
Vermont Department of Health. (2018a). Weatherization + Health: Health and Climate Change Co-Benefits of Home Weatherization in Vermont. Vermont Department of Health. https://www.healthvermont.gov/sites/default/files/documents/pdf/ENV_CH_WxHealthReport.pdf
Vermont Department of Health. (2018b). Weatherization + Health in Vermont. Vermont Department of Health.https://www.healthvermont.gov/sites/default/files/documents/pdf/ENV_CH_WxHealthReport.pdf
Vermont Department of Health. (2019, December). Improving Health Through Transportation. Vermont Department of Health. https://www.healthvermont.gov/sites/default/files/documents/pdf/ENV_CH_Transportation-Health.pdf
Vermont Department of Health. (2020, November). 2020 Arbovirus Surveillance Report. Vermont Department of Health. https://www.healthvermont.gov/sites/default/files/documents/pdf/HS_ID_ArbovirusSurveillanceReport_2020.pdf
Vermont Department of Health. (2023, August). Community Health Needs Assessment Priority Areas for Vermont Hospitals. https://www.healthvermont.gov/sites/default/files/document/hsi-chna-summary-2023.pdf
Vermont Department of Health. (2024a). Behavioral Risk Factor Surveillance System 2022 Report (p. 126). Division of Health Statistics & Informatics Vermont Department of Health. https://www.healthvermont.gov/sites/default/files/document/HSI-BRFSS-2022-DataSummary.pdf
Vermont Department of Health. (2024b). Cold-Related Illness Season Summary. https://www.healthvermont.gov/sites/default/files/document/env-epht-cold-related-illness-season-summary.pdf
Vermont Department of Health. (2024c, January). 2023 Mosquito-borne Virus Surveillance Report. Vermont Department of Health. https://www.healthvermont.gov/sites/default/files/document/lsid-mosquito-borne-virus-surveillance-report-2023_0.pdf
Vermont Department of Health. (2024d, April 25). 3-4-50: Prevent Chronic Disease | Vermont Department of Health. https://www.healthvermont.gov/wellness/3-4-50-prevent-chronic-disease
Vermont Department of Health. (2024e, July). 2018-2022 Tick Pathogen Surveillance Report. Vermont Department of Health. https://www.healthvermont.gov/sites/default/files/document/2018-2022%20Tick%20Pathogen%20Surv%20Report.pdf
Vermont Department of Health. (2025a). 3-4-50. Vermont Department of Health. https://embed.clearimpact.com/Scorecard/Embed/20434
Vermont Department of Health. (2025b). Behavioral Risk Factor Surveillance System 2023 Report. Division of Health Statistics & Informatics Vermont Department of Health. https://www.healthvermont.gov/sites/default/files/document/HSI-BRFSS-2022-DataSummary.pdf
Vermont Department of Health. (2025c). Heat Safety Guidance for Caregivers. https://www.healthvermont.gov/sites/default/files/document/env-ch-heat-safety-for-caregivers.pdf
Vermont Department of Health. (2025d). Improving Arthritis Outcomes Through Physical Activity and Education. Vermont Department of Health. https://www.healthvermont.gov/sites/default/files/document/hsi-factsheet-arthritis-self-management_0.pdf
Vermont Department of Health. (2025e). Stay Safe in a Flood. https://www.healthvermont.gov/emergency/public-health-preparedness/stay-safe-flood
Vermont Department of Health. (2025f). Tracking Pollen in Vermont: Expected Number of High Pollen Count Days per Week (2009-2024). https://app.powerbigov.us/view?r=eyJrIjoiODU1M2I5ZDgtZjEzNS00NjE3LTg1MDAtNDliYTZiMzA3ODMxIiwidCI6IjIwYjQ5MzNiLWJhYWQtNDMzYy05Yz…
Vermont Department of Health. (2025g). Vermont Department of Health Vermont fish mercury report: Mercury concentrations in Vermont fish & basis for safe fish-eating guidelines. Vermont Department of Health. https://www.healthvermont.gov/sites/default/files/document/env-rw-vermont-fish-mercury-report.pdf
Vermont Department of Health. (2025h, January). 2024 Mosquito-borne Virus Surveillance Report. Vermont Department of Health. https://www.healthvermont.gov/sites/default/files/document/lsid-epi-mosquito-borne-virus-surveillance-report-2024_1.pdf
Vermont Department of Health. (2025i, May 8). Lyme Disease | Vermont Department of Health. Vermont Department of Health. Vermont Department of Health. https://www.healthvermont.gov/disease-control/tick-bite-illnesses/lyme-disease
Vermont Department of Health. (2025j, June). Exploring Health Benefits of Home Weatherization. Vermont Department of Health. https://www.healthvermont.gov/sites/default/files/document/env-ch-health-benefits-home-weatherization-summary.pdf
Vermont Department of Health. (2025k, June 4). Anaplasmosis | Vermont Department of Health. Vermont Department of Health. Vermont Department of Health. https://www.healthvermont.gov/disease-control/tick-bite-illnesses/anaplasmosis
Vermont Department of Health. (2025l, June 4). Babesiosis | Vermont Department of Health. Vermont Department of Health. Vermont Department of Health. https://www.healthvermont.gov/disease-control/tick-bite-illnesses/babesiosis
Vermont Department of Health. (2025m, June 5). Tick Bite Illnesses | Vermont Department of Health. Vermont Department of Health. Vermont Department of Health. https://www.healthvermont.gov/disease-control/tick-bite-illnesses#dashboard
Vermont Department of Health. (2025n, August 21). Mercury in Fish | Vermont Department of Health. https://www.healthvermont.gov/environment/recreational-water/mercury-fish
Vermont Department of Health. (2025o, September 8). West Nile Virus | Vermont Department of Health. Vermont Department of Health. Vermont Department of Health. https://www.healthvermont.gov/disease-control/mosquito-borne-diseases/west-nile-virus
Vermont Department of Health. (2025q, October 3). Coliform Bacteria in Drinking Water | Vermont Department of Health. https://www.healthvermont.gov/environment/drinking-water/coliform-bacteria-drinking-water
Vermont Department of Health. (2025r, October 6). Prevent Mosquito Bites | Vermont Department of Health. Vermont Department of Health. Vermont Department of Health. https://www.healthvermont.gov/disease-control/mosquito-borne-diseases/prevent-mosquito-bites
Vermont Department of Health. (2025s, October 16). Mosquito-borne Virus Surveillance in Vermont. Vermont Department of Health. Vermont Department of Health. https://experience.arcgis.com/experience/ac541a89a490435aa7beb80ec8e54bca/
Vermont Department of Health. (2025t, October 16). Mosquitoes in Vermont | Vermont Department of Health. Vermont Department of Health. Vermont Department of Health. https://www.healthvermont.gov/disease-control/mosquito-borne-diseases/mosquitoes-vermont
Vermont Department of Health. (2025u, December 3). Hot Weather. Healthvermont.Gov. https://www.healthvermont.gov/environment/climate-health/hot-weather
Vermont Department of Health. (2026a, January 8). Common Foodborne and Diarrheal Illnesses | Vermont Department of Health. https://www.healthvermont.gov/disease-control/foodborne-diarrheal-illnesses/common-foodborne-and-diarrheal-illnesses
Vermont Department of Health. (2026b, February 19). Cyanobacteria (Blue-Green Algae) Tracker | Vermont Department of Health. Vermont Department of Health. Vermont Department of Health. https://www.healthvermont.gov/environment/tracking/cyanobacteria-blue-green-algae-tracker
Vermont Department of Health. (2026c, February 23). How to Test Your Drinking Water | Vermont Department of Health. https://www.healthvermont.gov/environment/drinking-water/how-test-your-drinking-water
Vermont Department of Health. (2026d, February 27). Drinking Water | Vermont Department of Health. https://www.healthvermont.gov/environment/tracking/drinking-water#maps
Vermont Department of Health. (2026e, March 13). Tick Activity in Vermont | Vermont Department of Health. Vermont Department of Health. https://www.healthvermont.gov/disease-control/tick-bite-illnesses/tick-activity-vermont
Vermont Department of Health. (2026f, April 7). Climate and Health. https://www.healthvermont.gov/environment/tracking/climate-and-health
Vermont Department of Health, & Vermont Agency of Agriculture, Food & Markets. (2025, September 9). First Human Case of Jamestown Canyon Virus Confirmed in Vermont | Vermont Department of Health. Vermont Department of Health. https://www.healthvermont.gov/media/current-news-releases/first-human-case-jamestown-canyon-virus-confirmed-vermont
Vermont Department of Public Service. (2022). 2022 Vermont Comprehensive Energy Plan. State of Vermont. https://publicservice.vermont.gov/sites/dps/files/documents/2022VermontComprehensiveEnergyPlan_0.pdf
Vermont Disaster Recovery. (2025). Recovery. Rebuilding. Resilience. Reflection on the Vermont Storms of 2023 and 2024. https://map.vermont.gov/2025-flood-anniversary?_gl=1*h9bplz*_ga*Njc2NTk3MjU5LjE3NDYwMTUxNTI.*_ga_V9WQH77KLW*czE3NTM0NjIwNzQkbzI…
Vermont Emergency Management. (2023). 211 Flood Damage Report [Dataset]. https://vermont211.org/
Vermont Environmental Justice Law, 2022 Vt. Acts & Resolves No. 154 (2022). https://legislature.vermont.gov/Documents/2022/Docs/ACTS/ACT154/ACT154%20As%20Enacted.pdf
Vermont Fish & Wildlife Department. (2025). Ice Fishing Basics. https://www.vtfishandwildlife.com/vermonts-ice-fishing-opportunities/ice-fishing-basics
Vermont State Parks. (2026). Who We Are | Vermont State Parks. Vermont State Parks. https://www.vtstateparks.com/aboutus
Vermont Urban & Community Forestry Program. (2026). Community Canopy Program | Vermont Urban & Community Forestry Program. https://vtcommunityforestry.org/municipal-assistance/community-canopy-program
Vital Strategies. (2026). Inclusive Language in Health Guide. https://www.vitalstrategies.org/inclusive-language-in-health-guide/
VT 211. (2024, February 16). SOS - Starting Over Strong—Help For Those Affected By July Flooding. https://vermont211.org/news-and-events/resources-for-vermonters-affected-by-july-flooding
VTOutages. (2025). VTOutages. https://vtoutages.org/
Walker, E. S., Noonan, C. W., Semmens, E. O., Ware, D., Smith, P., Boyer, B. B., Erdei, E., Hopkins, S. E., Lewis, J., Belcourt, A., & Ward, T. J. (2021). Indoor fine particulate matter and demographic, household, and wood stove characteristics among rural US homes heated with wood fuel. Indoor Air, 31(4), 1109–1124. https://doi.org/10.1111/ina.12808
Walsh, S. J., O’Leary, A., Bergin, C., Lee, S., Varley, Á., & Lynch, M. (2024). Primary healthcare’s carbon footprint and sustainable strategies to mitigate its contribution: A scoping review. BMC Health Services Research, 24(1), 1630. https://doi.org/10.1186/s12913-024-12068-8
Ward, M., Jones, R., Brender, J., de Kok, T., Weyer, P., Nolan, B., Villanueva, C., & van Breda, S. (2018). Drinking Water Nitrate and Human Health: An Updated Review. INTERNATIONAL JOURNAL OF ENVIRONMENTAL RESEARCH AND PUBLIC HEALTH, 15(7). (WOS:000445543500264). https://doi.org/10.3390/ijerph15071557
Water, Sanitation, Hygiene, and Health WHO Team. (2021). Toxic cyanobacteria in water—Second edition (p. 859). World Health Organization. https://www.who.int/publications/m/item/toxic-cyanobacteria-in-water---second-edition
Watson, K. B., Ricketts, T., Galford, G., Polasky, S., & O’Niel-Dunne, J. (2016). Quantifying flood mitigation services: The economic value of Otter Creek wetlands and floodplains to Middlebury, VT. Ecological Economics, 130, 16–24. https://doi.org/10.1016/j.ecolecon.2016.05.015
Weather Underground. (2023). South Burlington, VT Weather History—February 2023. Weather Underground. https://www.wunderground.com/history/monthly/us/vt/south-burlington/KBTV/date/2023-2
Westerling, A. L., Hidalgo, H. G., Cayan, D. R., & Swetnam, T. W. (2006). Warming and Earlier Spring Increase Western U.S. Forest Wildfire Activity. Science, 313(5789), 940–943. https://doi.org/10.1126/science.1128834
White, D. J., Talarico, J., Chang, H.-G., Birkhead, G. S., Heimberger, T., & Morse, D. L. (1998). Human Babesiosis in New York State: Review of 139 Hospitalized Cases and Analysis of Prognostic Factors. Archives of Internal Medicine, 158(19), 2149–2154. https://doi.org/10.1001/archinte.158.19.2149
Worfolk, J. B. (2000). Heat Waves: Their Impact on the Health of Elders. Geriatric Nursing, 21(2), 70–77. https://doi.org/10.1067/mgn.2000.107131
World Bank. (2026). What is Food Security? There are Four Dimensions [Text/HTML]. World Bank. https://www.worldbank.org/en/topic/agriculture/brief/food-security-update/what-is-food-security
Wu, Y., Wen, B., Gasevic, D., Patz, J. A., Haines, A., Ebi, K. L., Murray, V., Li, S., & Guo, Y. (2024). Climate Change, Floods, and Human Health. New England Journal of Medicine, 391(20), 1949–1958. https://doi.org/10.1056/NEJMsr2402457
Yardley, J., Sigal, R. J., & Kenny, G. P. (2011). Heat health planning: The importance of social and community factors. Global Environmental Change, Special Issue on The Politics and Policy of Carbon Capture and Storage, 21(2), 670–679. https://doi.org/10.1016/j.gloenvcha.2010.11.010
Zhang, Y., & Shindell, D. T. (2021). Costs from labor losses due to extreme heat in the USA attributable to climate change. Climatic Change, 164(3), 35. https://doi.org/10.1007/s10584-021-03014-2
Zhang, Y., Tingting, Y., Huang, W., Yu, P., Chen, G., Xu, R., Song, J., Guo, Y., & Li, S. (2024). Health Impacts of Wildfire Smoke on Children and Adolescents: A Systematic Review and Meta-analysis. Current Environmental Health Reports, 11(1), 46–60. https://doi.org/10.1007/s40572-023-00420-9
Zou, F., Sharma, L., Pekgün, P., & Ahire, S. (2025). Reducing Food Waste in U.S. Food Banks: The Role of Distribution Strategies. Production and Operations Management, 34(11). https://journals-sagepub-com.ezproxy.uvm.edu/doi/10.1177%2F10591478251345133