Authors
Luke H. Briccetti
Lily Maenza
About
Recommended citation for chapter
Briccetti, L.H., Maenza, L., 2026, Infrastructure. In Galford, G.L., Balerna, J.A., Turner, H., Sardonis, A., Peplinski, H. (Eds), The Vermont Climate Assessment 2025. Burlington, Vermont: Climate Measurements Center of Excellence, Gund Institute for Environment at the University of Vermont. DOI: 10.5281/zenodo.20272849. Accessed online at https://vtclimate.org.
Author Contributor Roles Taxonomy (CRediT) statement
Luke Briccetti: Conceptualization, methodology, data curation and visualization, mapping, writing, editing, and supervision; Lily Maenza: Conceptualization, methodology, writing, and editing.
Acknowledgements
We thank Cyril Brunner, Keith Cubbon, Mike Dacey, Elizabeth Doran, Matt Dugan, Sam Lash, Chad McGann, Cheryl Morse, Hannah Turner, Marlena Valenta, and Beverley Wemple whose thoughtful review and contributions helped refine and strengthen this chapter.
Downloads
Please use the following accessible downloads for your own needs.To find downloads of other chapters in VCA 2025, please go to Downloads.
- Infrastructure (high resolution PDF)
- Infrastructure (low resolution PDF)
- Infrastructure brief (PDF)
- Infrastructure slidedeck (PPTX)
- alt-text is attached to each figure.
- alt-text is attached to each figure.
7.0 Executive summary
Climate change is impacting Vermont’s infrastructure, including transportation (roads and rail), buildings, utilities (electricity, water, wastewater, and fuel), and dams. Both increasing temperatures and extreme events (e.g., flooding) have—and will continue to—impact these sectors. All Vermonters use at least a subset of the state’s infrastructure: driving on public roads, crossing public bridges, or using power and other utilities. Therefore, damage to infrastructure from climate change is highly visible and impactful to people’s daily lives. These climate impacts are not distributed evenly across the state. Climate risks to infrastructure are greatest in Rutland County and the Northeast Kingdom, and lowest in Chittenden County. In response, Vermont has recently enacted numerous regulatory and incentive-based climate policy changes.
This chapter is most relevant for the following groups: municipalities (see road damage, building damage, water system damage); regional planners (see all topics); public utilities, state officials and policymakers (see flood damage broadly, impacts to dams); and private landowners and land managers (see privately owned roads, dams, and buildings).
The most significant climate impacts on Vermont’s infrastructure include:
- Culverts are at risk from more frequent flooding and freeze-thaw cycles. Nine municipalities have 25% or more of their culverts listed in poor condition, mostly in mountainous, remote, or financially disadvantaged areas. The proportion of road culverts in poor condition is highest in Rutland and Washington counties, and lowest in Chittenden County.
- Models show Vermont’s road surfaces will deteriorate more quickly compared to the national average due to increased heat and precipitation severity.
- Vermonters reported 9,234 instances of significant damage to their homes or businesses following flood events in July 2023 and 2024. The damage reported was greatest in Washington and Caledonia counties.
- Burying power distribution lines underground, also called undergrounding, reduces utility vulnerabilities to climate change. The state’s three largest utilities have undergrounded most lines in Chittenden County, but the rest of Vermont remains vulnerable. A quote from a Vermont Electric Cooperative (VEC) representative illustrates this issue: “We are lucky if we improve 10–12 miles of line annually and have over 2,400 miles of distribution.”
- Aging wood power poles are at increased risk of decay from more frequent and severe precipitation. Municipalities in Lamoille and Essex counties are most at risk; the mean power pole age in this region is 40 years or older.
- Vermont has 34 electric substations and 41 wastewater treatment facilities located in (currently mapped) 100-year flood zones. During flooding in July 2023, 23 wastewater treatment plants were damaged; catastrophic damage to two of those plants (Johnson and Ludlow) resulted in tens of millions of dollars in repair costs and hundreds of thousands of gallons of untreated sewage entering waterways.
- Vermont has 69 high hazard dams and 190 dams that are greater than 100 years old, mostly located in Windham and Windsor counties. These dams are at greater risk of overtopping or reaching catastrophic failure during flood events.
There are many effective adaptation strategies to respond to these climate impacts including:
- Following road-stream crossing installation best management practices
- Downgrading underused roads to Class IV and replacing unnecessary bridges and culverts with fortified low-water crossings
- Using updated climate-change scenarios in pavement grading (i.e., planning ahead for climate impacts on road surfaces, as has been done in Maine)
- Experimenting with innovative strategies for reducing the impact of temperature swings on roadways—such as cold patch asphalt, “hot box” units, and geosynthetic wicking fabrics—and upscaling these strategies when financially feasible
- Supporting proactive, community-led efforts for flood mitigation, including pre-trained disaster preparedness volunteer corps and citizen monitoring of blocked culverts that pose a flood risk
- Incentivizing low-risk development, as encouraged by the 2024 Vermont Flood Safety Act
- Funding the Vermont Weatherization Assistance Program and investing in efficient new construction
- Funding distribution line undergrounding; AI prediction tools can help utilities prioritize lines for upgrades
- Removing aging and inactive dams, while remaining sensitive to cultural values
Addressing climate change impacts on infrastructure requires cross-boundary work that draws upon diverse sources of knowledge, resources, and firsthand perspectives to strengthen community adaptation and mitigation efforts. Infrastructure is a cross-cutting issue and additional relevant chapters in this report include, 4 Water Resources, 8 Energy, 9 Outdoor Recreation and Tourism, 10 Human Health, and 11 Community Development.
7.1 Key messages
- Outdated, undersized, or under-engineered road and rail stream crossings are vulnerable to severe flood events. Road surfaces are at-risk from intense rains, increasing temperature variability, and extreme heat.
- At least 10,000 buildings are located within the mapped 100-year floodplain, meaning there is a 1% chance that these buildings will experience flood damage each year. Many of these maps have not been updated to reflect increases in flood frequency and severity in a changing climate, indicating that this number may be an undercount. Buildings outside of floodplains may also be impacted by flash flooding or by erosion hazards from intense rains.
- Older buildings are particularly vulnerable to flooding and may be weakened by more variable temperatures and precipitation regimes. Weatherization can reduce these impacts.
- Frequent flood events increasingly endanger the power grid, as well as drinking water, wastewater, and fuel infrastructure. Of Vermont’s 334 electric substations, at least 34 (or 10.2%) are located in a flood zone. Wet snow, ice storms, and high wind periods pose additional threats to power grids.
- Vermont has over 1,000 known dams, of which nearly 50% are inactive. Severe floods can cause water to overtop both active and inactive dams, posing a threat to people and property downstream.
7.2 Background
Climate change driven increases in the frequency and severity of precipitation events, extreme heat, and temperature fluctuations impact infrastructure, including roads, rail, buildings, utilities, and dams. Damage to infrastructure from climate change is highly visible and impacts people’s everyday lives. For example, damage to transportation networks from floods, heat, or temperature-variability can lengthen commutes or block access to essential services, like hospitals, grocery stores, and pharmacies. Severe power grid damage from wind and ice can cause communities to lose power more often and for longer. Most dramatically, more frequent and severe floods can damage people’s homes and businesses, and therefore, their lives and livelihoods. Dam overtopping events (i.e., when a dam’s reservoir fills faster than water can be released, causing it to spill over the top of the dam) can exacerbate impacts in communities already experiencing flooding or erosion hazards.
Responding and adapting to these infrastructural challenges is uniquely difficult in Vermont. Most municipal budgets are dedicated to school funding and town highway maintenance, leaving little room for funding climate adaptation measures. As climate change causes severe precipitation events to rise, the cost of maintaining roads in a state where the majority (54.1%) are unpaved is only expected to increase (DeAndrea, 2024). Therefore, understanding and adapting to climate change impacts on infrastructure is critical for individual, community, and state-wide climate resilience.
This information will be particularly useful for infrastructure asset managers, policymakers, and planners at the state, regional, and municipal levels.
Although the chapter’s primary focus is on assessing the impacts of climate change on infrastructure, contributing factors and adaptation considerations are also included in many of the subsections. More detailed state-level strategic planning for climate change can be found throughout the Vermont Climate Action Plan (Vermont Climate Council, 2025b).
7.3 Damage to roads and rail
7.3.1 Road and rail crossing damage from extreme precipitation events
Impacts
In Vermont, climate change is expected to cause more frequent and severe flooding events (see Climate Change in Vermont 2.6.2). Stream crossing infrastructure is increasingly at risk, with outdated, undersized, and under-engineered bridges and culverts regularly failing in high-flow conditions (Galford et al., 2021; Figure 7-1). Severe flooding events can result in water ponding (i.e., pooling) above the inlet of a structure and potentially overtopping and washing out the road. It can also result in a culvert “blowing out” of the road and being pushed downstream, resulting in a road gap until the structure is replaced. Vermont Emergency Management (VEM) estimates that Tropical Storm Irene damaged 960 culverts in 2011 (Vermont Emergency Management, 2018). Recently, the July 2023 flood event damaged 826 culverts on public roads, leading to the temporary closure of over 300 miles of roadway throughout the state (Knapschaefer, 2023; Wright, 2024). These road closures can have a wide range of impacts, ranging from longer commutes to complete isolation from essential services (see Human Health 10.4.1 and Community Development 11.5).
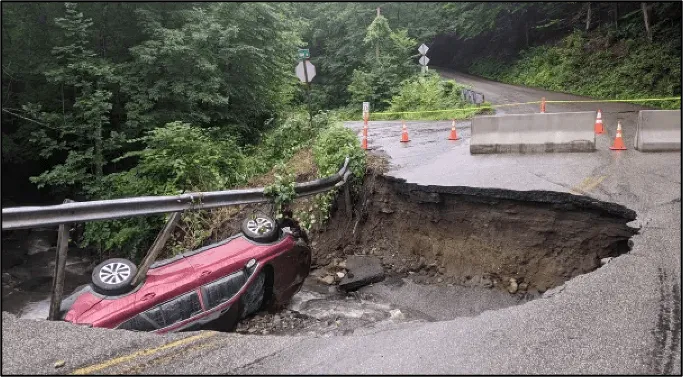
Source: Joshua Carnes, 2021
For bridges, the most common source of damage during flooding is bridge scour, where powerful floodwaters erode material around the pier or abutment of a bridge, causing the structure to crumble (Anderson, 2018). In Vermont, one study estimated 326 bridges were damaged by Tropical Storm Irene, with the majority of those (55.6%) experiencing scour damage (Anderson, 2018). The 2018 State Hazard Mitigation Plan has a higher estimate of bridge damage (480 bridges) from Irene (Vermont Emergency Management, 2018). The July 2023 flood event resulted in at least 30 bridges experiencing scour damage and requiring replacement, with 14 temporary bridge requests made by municipalities to the Vermont Agency of Transportation (VTRANS) (Wright, 2024). Flooding in December 2023 did not result in any temporary bridge requests, indicating low bridge scour damage from that flood hazard event (Wright, 2024). The highly localized late-July 2024 flooding destroyed 16 bridges within a few towns in the Northeast Kingdom (Goff & Banacos, 2024).
This type of extreme flooding is hazardous, preventing access to homes and working lands, and sometimes cutting off vulnerable groups from emergency services (Vermont Emergency Management, 2023b). There is also a significant economic impact: the July 2023 flood resulted in $157 million in spending for both emergency and permanent repairs by the Federal Highway Administration (Wright, 2024). Additionally, rail networks were damaged across the state, resulting in $70 million in repairs to 41% of Vermont’s rail network mileage, including 25 bridges and 32 culverts (Wright, 2024).
The December 2023 flood event caused at least $1.9 million in damage to public roads (McDonald & Wilson, 2024). The cost of repairs to public roads has historically been partially covered by the U.S. Federal Emergency Management Agency (FEMA) when a federal disaster declaration is made. After the December 2023 flooding, up to 75% of total damages were covered by the federal government (FEMA and the Federal Highway Administration) or the state (on state highways). For municipal roads, the remaining cost is absorbed by town budgets, which vary significantly depending on tax base, town size, and other expenses. Individual landowners are responsible for paying the full cost of repairs and replacements of private roads—including driveways, farm roads, or forest roads that are often required for access to homes and lands. Landowners have widely varying capacities to bear this cost. As of July 2025, Vermont has over $200 million of needed infrastructure repairs due to the 2023 flood event alone (Vermont Department of Housing and Community Development, 2025).
Even if a structure does not fail, outdated, undersized, or under-engineered structures can impede aquatic organism passage, cause erosion locally, and/or obstruct sediment transport at a reach-scale (a reach is a section of stream with consistent hydrologic conditions) following high streamflow events (Cocchiglia et al., 2012; Gillespie et al., 2014; Lehrter et al., 2024). Erosion of sediment at road-stream crossings and along road ditches and cross drains contributes to downstream phosphorus loading, which is especially relevant in the phosphorus-impaired Lake Champlain Basin (LCB) (Wemple et al., 2021). Increased erosion rates from severe storms further the fragmentation of aquatic habitat by increasing impassable drop heights between road crossing structures and streams (Lehrter et al., 2024). Put differently, the greater the distance between the road crossing and the stream, the more unlikely it is that aquatic organisms will be able to travel upstream. Currently, only 6% of road-stream crossings in the LCB provide full passage to aquatic organisms (Lake Champlain Basin Program, 2024). Without action to upgrade structures, increased erosion from regular high streamflow events will only worsen this problem.
Contributing Factors
Of Vermont’s 2,533 bridges, 59 (~2.3%) are listed as having substructures in poor condition (Vermont Association of Planning and Development Agencies, 2025), leaving these structures vulnerable to failure. At the time of the last Vermont Climate Assessment (2020), the ratio of bridges with substructures in poor condition was 2.25%, suggesting no trend in terms of bridge deterioration or rate of improvement (Vermont Association of Planning and Development Agencies, 2025).
As of late 2025, Vermont has 113,373 inventoried road culverts with over a tenth (14,506 or ~12.8%) listed as being in critical, urgent, or poor condition (Vermont Association of Planning and Development Agencies, 2025). Towns in Rutland and Washington counties have the highest proportion of structures in poor condition or worse (Figure 7-2). There are nine municipalities in Vermont that have 25% or more of their structures listed as being in poor condition or worse: Winhall, Newport City, Maidstone, Fair Haven, Hubbardton, Fayston, Eden, Sudbury, and Panton. Most of these municipalities are either mountainous, remote, or contain disadvantaged census tracts (i.e., areas that are above set thresholds for environmental or socioeconomic indicators).
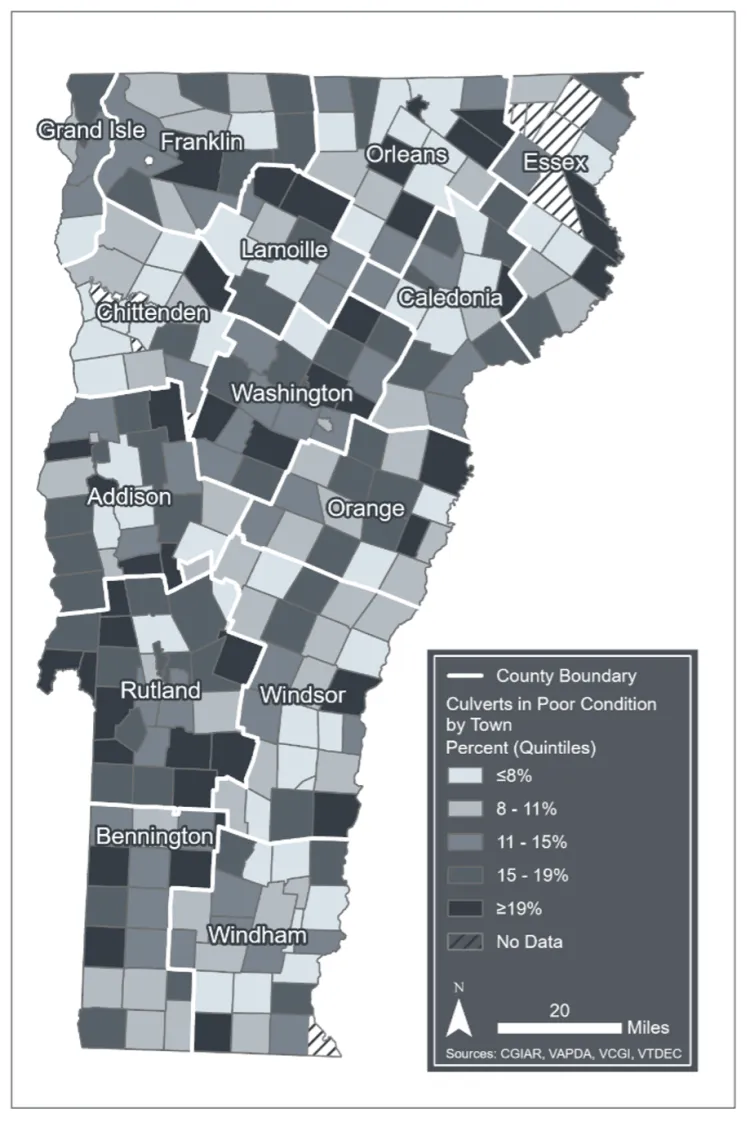
Source: The Vermont Association of Planning and Development Agencies (2025), VCGI (2025)
Note: Visualization by Hannah C. Turner
Many of these poor condition culverts are likely to be >50 years old, which is generally considered at the top end of the typical lifespan for a steel corrugated culvert (Gillespie et al., 2014). Data on culvert age is limited; as of October 2025, only 8.6% of structures within the Vermont Association of Planning and Development Agencies (VAPDA) culverts database had a listed installation year. This data gap will improve as newer structures continue to be installed statewide, but the gap highlights a current vulnerability for municipalities that may not know how to prioritize the replacement of structures without a more complete dataset.
Furthermore, of the state’s culverts and bridges spanning perennial streams (i.e., streams that contain water year-round), approximately 58.6% are significantly constricting the stream channel (i.e., spanning less than 50% of the stream channel), and 34.6% are listed as either “not providing aquatic organism passage” or “providing only very limited passage” (Vermont Agency of Natural Resources, 2023). Both of those attributes indicate undersized, non-climate resilient structures.
American Beavers (Castor canadensis) often construct dams at river chokepoints such as road culverts. Beavers provide broad, landscape-level benefits that make ecosystems more resilient to climate change, including water storage that reduces overall flood risk and buffers systems against drought risk (Thompson et al., 2021). However, beaver dams at road crossings may result in localized ponding and flooding, thereby impacting surrounding residents or business owners. Many residents perceive the bursting of beaver dams at road crossings or further upstream to be a cause of road damage during extreme weather events (Briccetti, unpublished data). However, the scientific literature is mixed, with some studies quantifying significant damage from beaver dam failures (Hillman, 1998; Reister, 2018), and other, more recent studies finding that beaver dam failure had little impact on peak discharge during a flood (Biron et al., 2025; Westbrook et al., 2020).
While current North American beaver populations are at 2–20% of pre-colonial densities (Scamardo et al., 2022), beaver populations are increasing. Vermont beaver populations increased by 120% between the mid-1980s and 1990s (Vermont Fish & Wildlife Department, 2025). The lack of beavers on the landscape before this time allowed for the installation of undersized culverts to become the norm, and undersized culverts are more likely to be the target of beaver dam building efforts (Burchsted et al., 2010; Wohl, 2005). As a result of these dynamics and the increasing frequency of flood events, beavers are often a target of human-wildlife conflict (Jonker et al., 2006; Yarmey & Hood, 2020). The following is an example response to beaver damage that reflects the complicated sentiments associated with beaver management decisions:
They [The beavers] filled that culvert several times... every morning [a neighbor] would come down there'd be water running down the road, and they'd pull out sticks and mud and stuff and get it flowing again, but by the time they got home in the afternoon it was, you know, flowing down the road again. So you can either trap them or you can shoot them. I took six beavers out of there... What I hate is just killing them and not using the hides or whatever. I hate just killing to kill, but – I did. (landowner in Lamoille County)
Adaptation Considerations
Installing newer structures (e.g., culverts, bridges) that are sized, aligned, and graded appropriately will reduce road-stream crossing infrastructure vulnerability. Collectively, these recommendations are referred to as Best Management Practices (BMPs). For sizing, Vermont BMPs generally call for the structure to be 1.2x the bankfull width of the stream channel, although this can vary depending on the stream’s natural flow regime (Vermont Fish & Wildlife Department, 2016; Figure 7-3). For alignment, a <45° stream inlet approach angle is recommended to reduce the risk of erosion at the bend (and associated road washouts during flood conditions) (Vermont Fish & Wildlife Department, 2016).
Removing structures altogether (e.g., when those structures are obsolete) is also an effective tactic for risk reduction. This tactic is common on private lands, especially on forest roads. Vermont’s “Logging Acceptable Management Practices” guidelines direct loggers to install various types of temporary crossings on logging trails, such as corduroy crossings, which consist of logs laid side-by-side perpendicular to the road, that are relatively straightforward to install and to remove in low flow areas (Vermont Department of Forests, Parks, and Recreation, 2019). While not effective in many situations, abandonment of some public roads—particularly Class IV roads, which are public roads not actively maintained by the town or state—and removal of their road crossings can reduce hazard risk and ecological consequences. There are, of course, trade-offs: Even when a road is not frequently used, closing it may result in the loss of culturally significant access routes, or an inequitable distribution of lost access. In certain situations, a palatable compromise on vulnerable roads might be following up on a culvert or bridge removal with the fortification of a low-water crossing for 4-wheel drive vehicles.
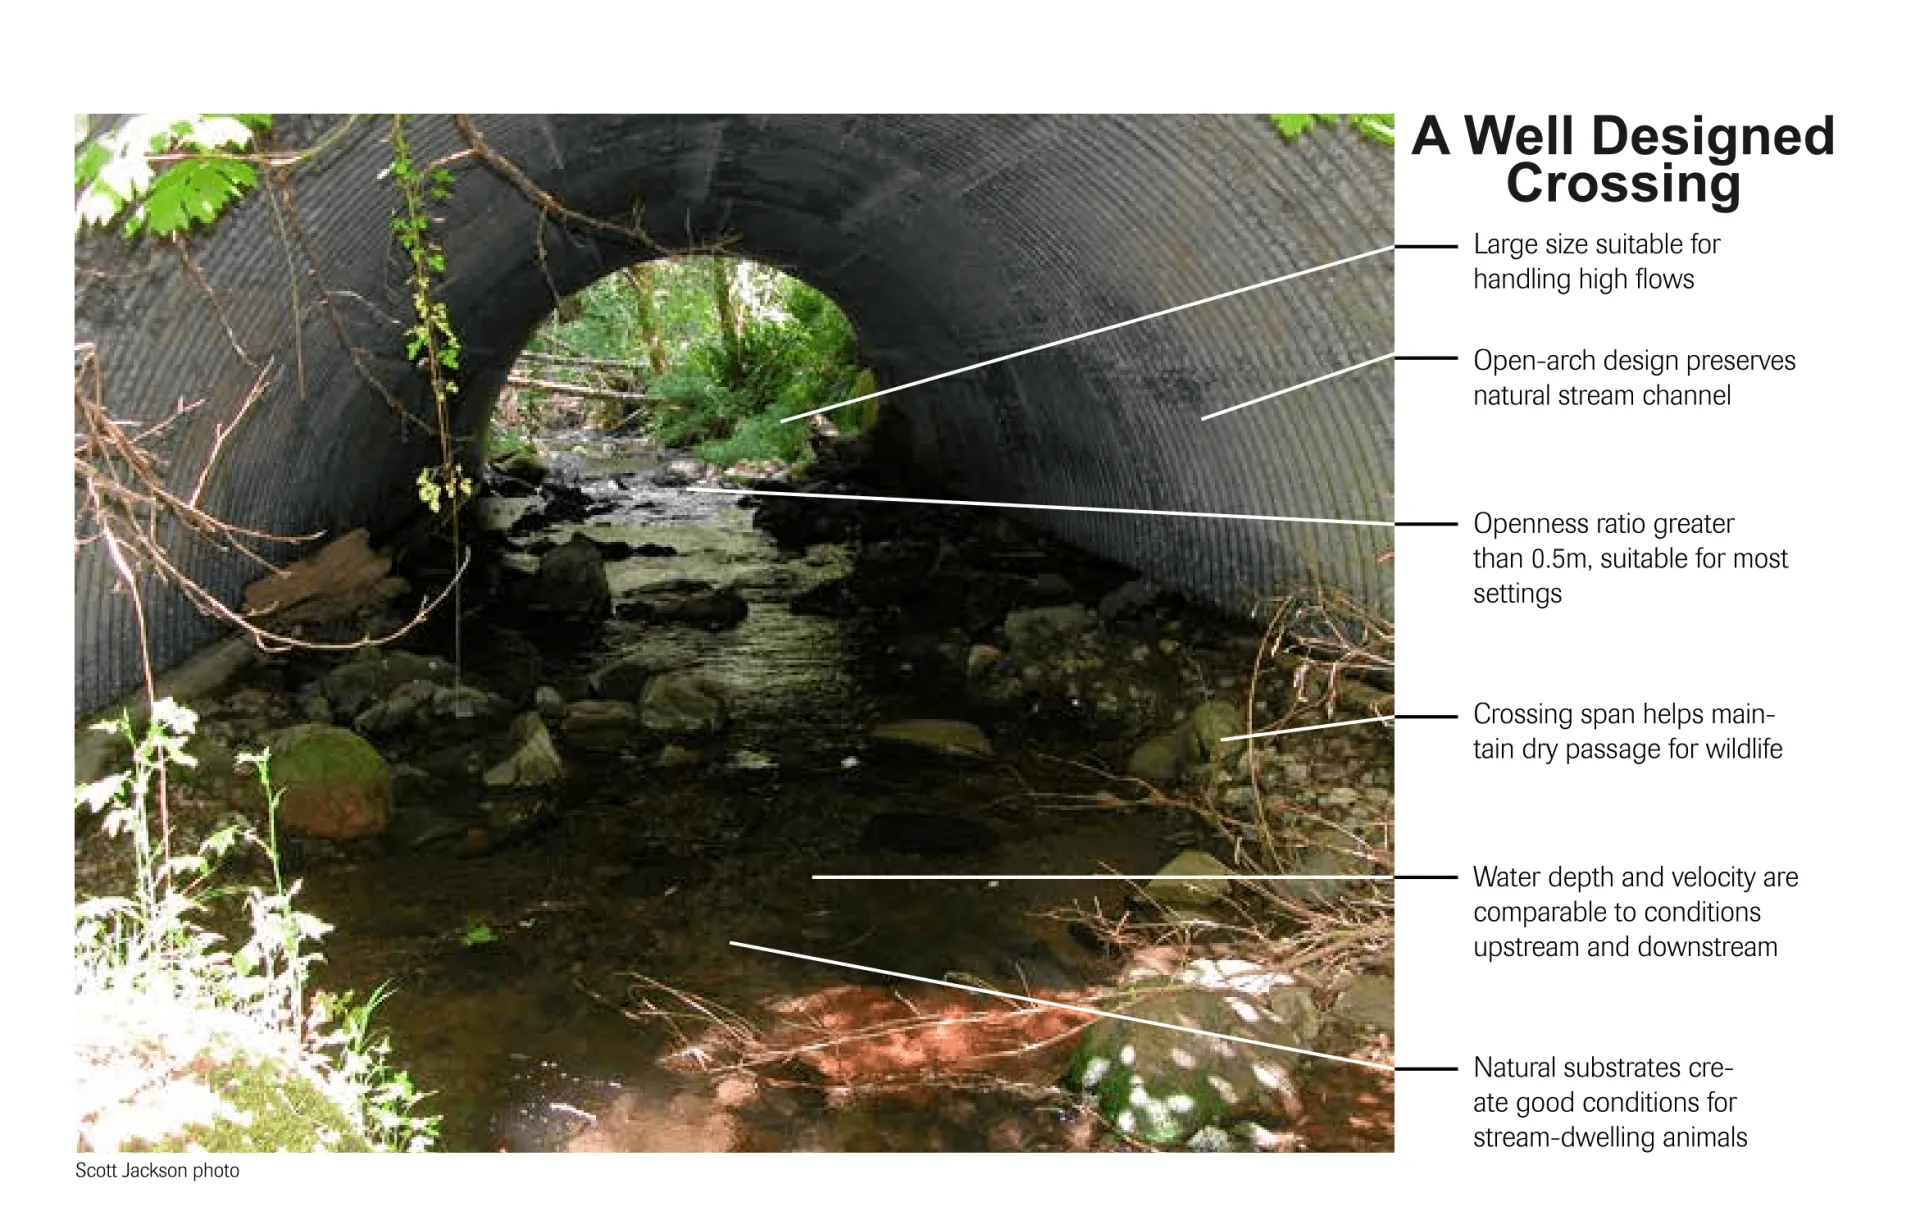
Source: Massachusetts Department of Fish and Game (2018)
The current version of the Vermont Stream Alteration Rule was enacted in 2017, and describes the parameters needed to receive a permit to replace or modify a stream crossing on a perennial stream. It contains provisions to protect aquatic life and build resilient infrastructure (Vermont Department of Environmental Conservation, 2017). Structures on perennial streams that were installed since this rule was established should constrict stream channels and prevent aquatic passage less. As mentioned above, approximately 58.6% of culverts and bridges spanning perennial streams are significantly constricting the stream channel, and 34.6% are listed as not providing aquatic organism passage (Vermont Agency of Natural Resources, 2023). In comparison, only 21.9% of structures listed in the VAPDA database as being installed since 2017 are constricting the stream channel, and only 15.9% of structures act as a passage barrier, although the numbers listed since 2017 are not just limited to perennial streams (VAPDA, 2025). These values indicate that regulatory changes to new structure acceptability have likely increased the infrastructure resilience of public roadways to climate change.
Prioritization of infrastructure repair and replacement is increasingly important. The cost of maintaining road infrastructure (including crossings) has increased due to climate-driven environmental factors (e.g., more severe rainfall events and frequent freeze-thaw cycles), regulations intended to reduce the impact of these factors (e.g., the Municipal Roads General Permit), and market pressures (e.g., escalating costs for materials, rising healthcare costs for municipal workers). As a result, strain on municipal budgets from highway department costs have increased, leading to either budgetary increases (i.e., cost passed on to taxpayers) or static budgets (i.e., paying the same for less road maintenance (K. Cubbon, personal communication, November 19, 2025). Vermont’s extensive, accessible structure and stream data is a useful baseline for prioritizing structure replacements. For example, Vermont’s Stream Geomorphic Assessment data has been shown to be useful for predicting bridge scour likelihood (Anderson, 2018). Conversations at the municipal, state, and federal level need to address the economic strain municipalities face from regularly needing to install larger, more expensive structures to bolster their resilience to increased flooding under climate change.
On private land, much less is known about structure resilience, although it can be inferred that the ability of a landowner to maintain or increase structure resilience is highly dependent on their financial capacity to do so. A case study of 56 structures on private roads in the LCB found that 59% (33/56) of crossing sites assessed were severely constricted, while 50% (28/56) of crossing sites were assessed to have severe barriers to aquatic organism passage (Briccetti, 2025). These results reflect the challenge posed by road crossing management to private landowners (e.g., infrastructure failure risk) and to ecosystems (e.g., sediment loading, impaired aquatic organism passage) in response to increasing extreme weather. As part of this study, a survey of 158 private road crossing owners revealed that landowners who actively manage their land (e.g., for timber, maple sugar, or other agriculture) feel more confident in their ability to manage a road crossing, should they need to (Briccetti, 2023). Targeted outreach towards landowners that passively manage their lands on the “how” of managing road-stream crossings could yield movement toward road crossing BMP adoption.
In general, strengthening and modernizing stream crossing infrastructure may require more institutional support and funding. Vermont has been proactive in providing support for project planning, with tools like VTRANS’ Transportation Resilience Planning Tool (Vermont Agency of Transportation, 2026) and aspects of Vermont’s Agency of Natural Resources (VTANR) Atlas (VTANR, 2024) assisting planners with prioritizing the replacement of vulnerable road-stream crossing. Vermont was set to receive $63 million annually from 2022–2026 through the federal Bipartisan Infrastructure Law (The White House, 2022), with much of that funding was directed towards resilient upgrades to road-stream crossing infrastructure. However, the on-the-ground impact of that investment remains to be seen, as does the future of federal investment in infrastructure amid a rapidly changing funding landscape.
7.3.2 Road erosion damage from extreme precipitation events
Impacts
Beyond road-stream crossings, erosion from roadside drainages and unpaved road surfaces are also an issue that is exacerbated by increased precipitation frequency and severity associated with climate change (see Climate Change in Vermont 2.5.2 and 2.6.2). One of the most visible impacts of increased erosion on the road surface is unpaved road rutting (i.e., depressions or grooves), which can increase road roughness and decrease accessibility, especially on high-slope road surfaces (Remmers et al., 2023; Wemple et al., 2017). Erosional damage can occur on the road surface, bed, and shoulder when roads located in river corridors are undermined during flooding (Wang et al., 2024). Incision of ditches is another common visible impact of erosion (Katz et al., 2014). Less visibly, erosion causes an increase in suspended sediment and sediment phosphorus contributions to surface waters and downstream water quality (Wemple, 2013; Wemple et al., 2021; see Water Resources 4.5). Estimates from 2013 indicate that erosion on the roadside or road surface of unpaved roads in Vermont accounts for 17% of the yearly suspended sediment and 28% of the phosphorus load contributed by upland drainages. An estimate from the Winooski River Watershed asserts that this erosion would account for 11% of the watershed’s total phosphorus load (Wemple, 2013). Additionally, while agriculturally-enriched sediments are often present in flatter areas, which usually result in less total erosion, these soils often have higher phosphorus concentrations (Perillo et al., 2019). Therefore, roadside erosion in agricultural, low-relief areas is also contributing to phosphorus loading issues in impaired watersheds.
Gully erosion—when concentrated runoff incises soils, forming a defined channel—is higher near roads, resulting in elevated sediment and phosphorus loading, as well as increased susceptibility to mass failures such as landslides or rockfalls (Figure 7-4; see Water Resources 4.5.4). These events have the potential to destroy road infrastructure, homes, and other buildings. Gully depth at road drainage outlets increases during times of high rainfall, especially in areas with slopes above 23% and with high percentages of surrounding impervious surfaces (Wemple, 2013; Wemple et al., 2021).
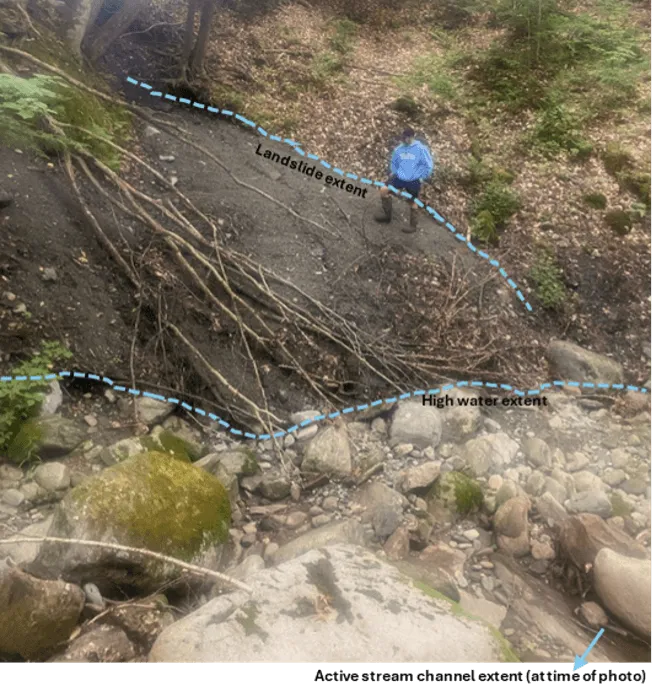
Source: Luke Briccetti (2021)
Adaptation Considerations
In response to growing concern about water quality following Tropical Storm Irene and worsening algae blooms, Vermont passed the Vermont Clean Water Act (Act 64) in 2015 (Vermont Clean Water Act, 2015). The Act sought to address multiple causes of nutrient pollution, including road erosion. As a result of this legislation, the Municipal Roads General Permit (MRGP) was drafted in 2017 (and amended in 2023) as a policy mechanism for addressing municipally owned road segments with high erosion levels (Vermont Department of Environmental Conservation, 2023). The Vermont Department of Environmental Conservation (VTDEC) developed a set of standards through the MRGP to be assessed at regular intervals by municipalities (or regional planning commissions assisting municipalities) through a Road Erosion Inventory (REI) procedure. The REI seeks to assess various factors that can facilitate erosion (e.g., steep slope, poor roadway crowning, culvert dimensions) and recommends erosion mitigation BMPs to reduce damage (e.g., roadside ditch fortification with stone at steep road segments, more pronounced crowning, or resized roadside ditch culverts). The MRGP mandates that 7.5% of road segments and 20% of road segments assessed to be “Very High Priority” are brought up to MRGP standards each year by municipalities, with the goal of having all roads in the state meet MRGP standards by 2036 (VTDEC, 2023). BMPs identified in the MRGP reduce erosion, including in stream gullies, where stabilizing road drainage outfalls with rock have been shown to reduce gully erosion rates (Wemple et al., 2021).
Since MRGP implementation in 2017, 12,839 road segments have been upgraded, with 65.9% of those segments funded using state grants, 24% funded by municipalities, and 10.1% funded using other sources (including federal dollars) (C. McGann, personal communication, Nov. 20, 2025). Based on these statistics, the state has clearly invested significant resources into climate-resilient road upgrades to fund these state-mandated changes. However, progress reports for each municipality show that current MRGP compliance varies significantly by municipality, with certain municipalities having already brought all roads up to MRGP standards, and others having made much less progress (VTANR, 2025). As of 2023, 19% of road segments in Vermont required future upgrades to meet MRGP compliance (Figure 7-5). Since the inception of the program, 26% of road segments have been documented as upgraded by VTDEC, which represents an undercount since municipalities do not always document all road work (C. McGann, personal communication, Nov. 20, 2025). It is important to note that some roads that previously met MRGP standards may have fallen out of compliance following the flood events in 2023 and 2024, since flood events can still damage roads that meet climate resilience standards. Overall, following road drainage best practices will result in roads that are more likely to receive compliant MRGP scores and consequently, withstand storm events.
While mandated road erosion mitigation upgrades are only in place on public roads, private road REIs are currently being designed in northwest Vermont as a mechanism for identifying voluntary road erosion mitigation projects (Northwest Regional Planning Commission, 2025; Box 7-1). Through grants provided by Vermont’s Clean Water Service Provider organizations, water quality organizations can currently work with private road owners to fund erosion mitigation projects; an operationalized private road REI would provide a mechanism by which to more efficiently identify and prioritize projects.
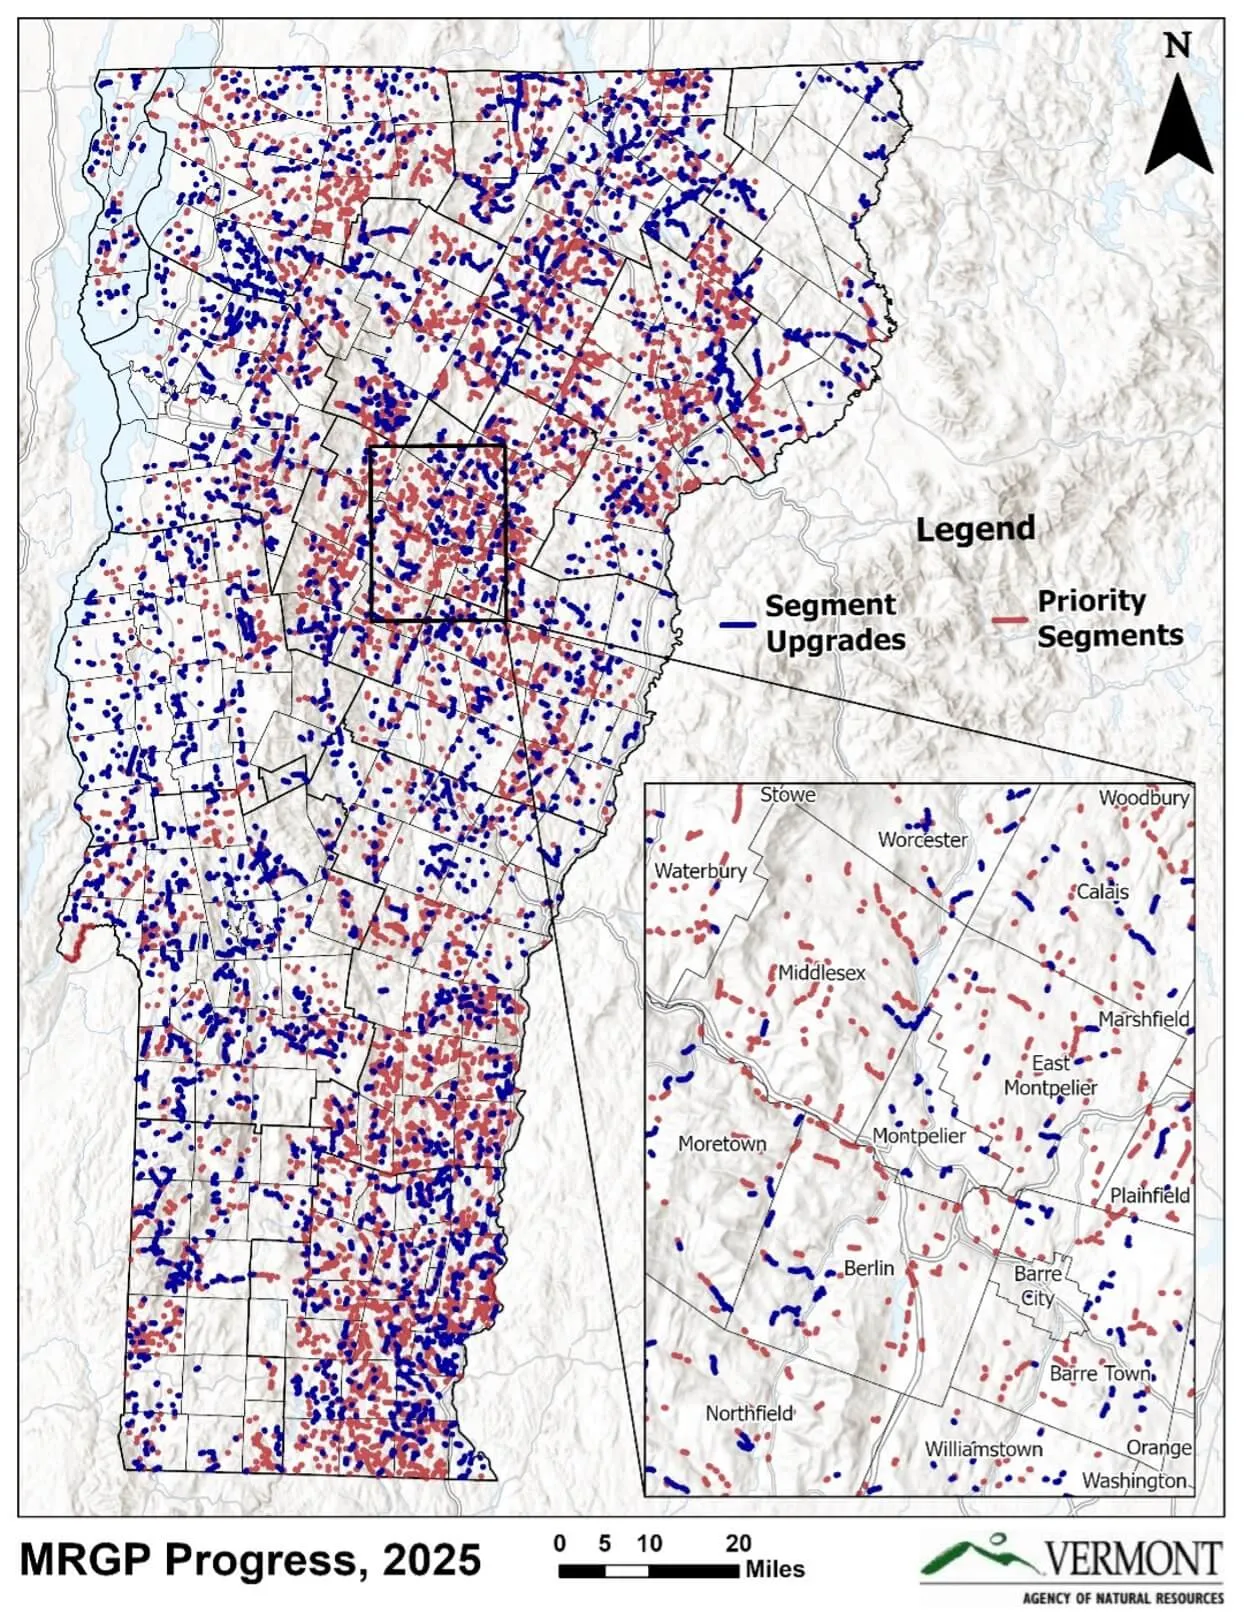
Source: Chad McGann, Municipal Roads Program Coordinator at VTDEC
Box 7-1: Applying the Road Erosion Inventory process to private roads
With funding from the Lake Champlain Basin Program, the Northwest Regional Planning Commission conducted a private REI in the Lake Carmi watershed in 2021 (Remmers, Pierce, and Yandow 2023). Lake Carmi is a relatively shallow, algae bloom-prone lake in Franklin County encircled by seasonal camps, almost entirely serviced by privately owned roads. The REI found that 27% of road segments in the watershed did not meet MRGP standards, with the most common issues being poor drainage off the road, insufficient crown, and poor drainage culverts. The REI results were then used to prioritize segments for updates, and the regional planning commission worked with private landowners to implement two erosion mitigation projects in the watershed. However, it was also clear from this project that MRGP standards are not uniformly applicable to private roads where areas inherently may be managed to look and function differently than on public roads. This pilot prompted work on creating a new REI protocol in Vermont that can be applied to private roads, which will hopefully result in baseline erosion data that can help planners prioritize and implement private road erosion reduction projects across Vermont.
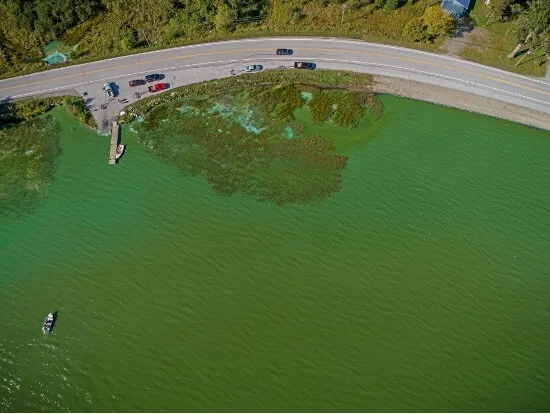
Source: County Courier
7.3.3 Road damage from extreme heat
Impacts
Extreme heat is another climate impact that is predicted to harm road infrastructure in Vermont, by reducing the structural stability of pavement (Gudipudi et al., 2017). Reduced structural stability can threaten both the structural and functional capacity of roadways by hastening wear and tear. Specifically, extreme temperatures can increase incidences of fatigue cracking (Figure 7-6a), rutting (Figure 7-6b), buckling of concrete (Figure 7-6c; Sias et al., 2025), and roughness (Figure 7-6d). Additionally, the impacts of heat on pavement can combine with impacts from other climate drivers to hasten road wear and tear (Sias et al., 2025). A 2014 study projected that the useful life span of pavement in New England decreased from 16 to 4 years, with an 100% increase in average maintenance costs due to all climate drivers combined (Daniel et al., 2014). Data on how temperature increases alone will impact Vermont are limited. A 2017 pavement stability study modelled that fatigue cracking from heat would increase by 6–8% in Vermont, and rutting from heat by 30–35% (Figure 7-7), which are both on the higher end of statewide increases nationally, but similar to other high latitude or altitude states (Gudipudi et al., 2017). It can be difficult to isolate which specific environmental drivers (e.g., heat, precipitation, freeze-thaw cycles) decrease pavement stability in a specific location, but pavement replacement and maintenance costs per municipality have increased in recent years throughout Vermont (K. Cubbon, personal communication, November 19, 2025).
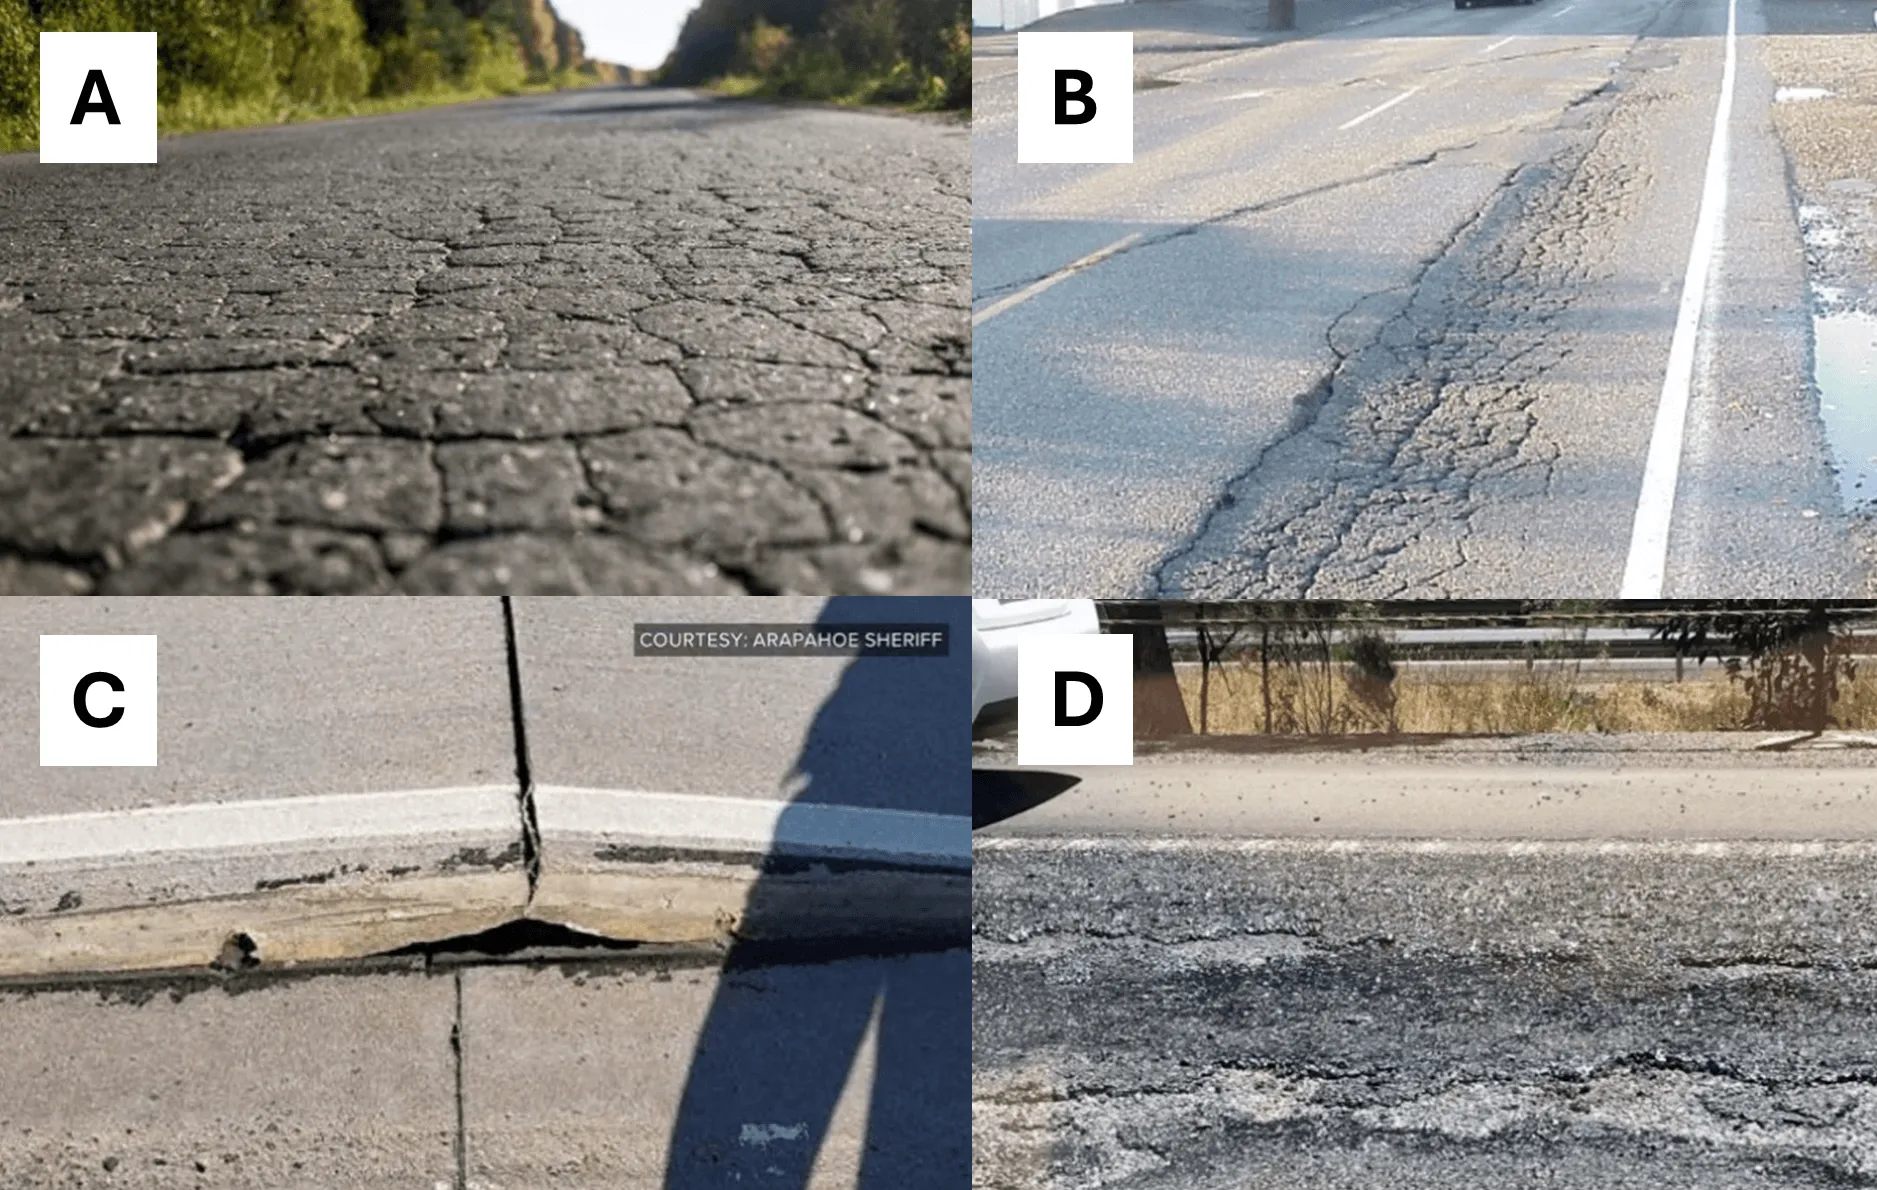
Source: (a) Alpha Paving (2020), (b) Pavement Interactive (2000), (c) Arapahoe Sheriff via 9News (2018), and (d) Steph Harris via ABC News (2018)
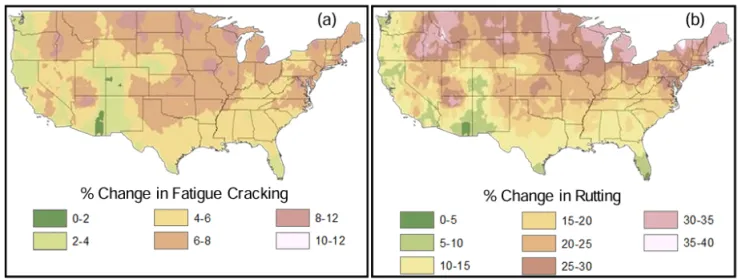
Source: Gudipudi et al. (2017)
Although dirt and gravel roads do not exhibit the structural stability impacts that occur on pavement, trafficked unpaved roads can produce airborne dust particles during high heat and low-precipitation time periods, which can reduce local air quality and affect human health (Chen et al., 2019; Midwest Research Institute, 1998; see Human Health 10.5).
Adaptation Considerations
In Vermont, pavement design has historically prioritized minimizing pavement structural stability risk from freeze-thaw cycles and excess precipitation (VTRANS, 2023). With greater high-heat days, Vermont roadways will experience heat-related stressors more often, in addition to the existing stressors that are typically prioritized. As such, correct asphalt grading, which requires matching pavement type and thickness to anticipated stress from traffic and natural stressors, is predicted to become more important throughout the United States, including in Vermont (Underwood et al., 2017). Correct asphalt grading requires sustained investment in engineering and construction, which raises costs. Therefore, due to their resource constraints, municipalities are likely to shoulder a disproportionate road maintenance cost as they adapt to increased heat.
Engineering roads using modelled temperature increases for different climate change scenarios can help ensure roads are resilient to increased heat stress. For example, a national modelling study found that Maine is predicted to have comparably low heat impacts due to the state using thicker pavements than needed for relatively low-traffic roads (Gudipudi et al., 2017). As Maine and Vermont are similar economically, topographically, and climatically, Maine’s paving strategies might have potential in Vermont. A willingness to adjust engineering assumptions to match modelled temperature increases is a key factor in successful road infrastructure climate adaptation, as opposed to adhering to the status quo.
For unpaved roads, adjusting road materials might be an effective strategy for reducing the impact of dust on the surrounding environment and community. However, replacing unpaved roads with pavement is unlikely to be economically feasible for smaller municipalities in many situations, exposes roads to other climate stressors described above, and glosses over the cultural significance of the dirt road network to many Vermonters (Fairfax, 2025). Instead, dust suppression materials—often calcium chloride—can be applied to unpaved roads. However, this adds to the chloride load in water bodies, which is already elevated due to winter road salt (e.g., sodium chloride) application (Franklin Regional Council of Governments, 2001; Vermont Senate Committee on Natural Resources and Energy, 2025). When applied correctly, calcium chloride used for dust suppression is more likely to remain on the road surface than winter de-icing materials, and thus is less likely to contaminate water bodies (Franklin Regional Council of Governments, 2001). The Vermont Local Technical Assistance Program—a state level program that provides technical assistance to municipal highway departments—provides trainings and assistance in dust suppression best practices (Vermont Senate Committee on Natural Resources and Energy, 2025). Expanding this program and creating funding pathways that allow program employees to work with private contractors could be a strategy for balancing dust suppression and water quality.
7.3.4 Road damage from temperature swings
Frozen periods in New England are anticipated to shorten by 10–20% between 2000–2029, from the 1970–1999 average of 9–13 weeks (Daniel et al., 2018), a change that Vermonters are already experiencing with 23.7 more freeze-free days/year within the last half decade (2020–2024) compared to the 1900s (See Climate Change in Vermont 2.4.4). Additionally, Vermont is experiencing greater winter temperature variability, with rising mean winter temperatures (VTRANS, 2023; see Climate Change in Vermont 2.4.3). This temperature variability increases the number of freeze-thaw cycles in the winter and in shoulder seasons (e.g., November–December, March–April), which threatens the structural capacity of roadways (Laurynas, 2022; see Climate Change in Vermont 2.4.3). Similar to extreme heat, temperature variability (especially increased freeze-thaw cycles) can lead to structural threats to roadways through transverse (thermal) cracking, which appears as cracks perpendicular to traffic (Graham & Fitch, 2007). Thaw cycles can weaken the bond between cement/asphalt and the subgrade below, leading to both transverse cracking and surface erosion (i.e., raveling; Raffaniello et al., 2022; Sias et al., 2025; Figure 7-8).
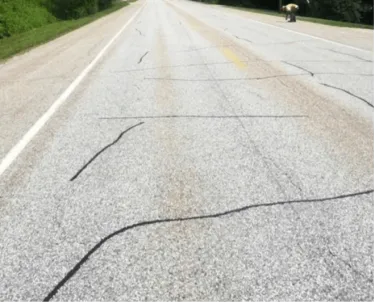
Source: Fitch & Tremblay (2015)
Warmer winters and thaw cycles cause snow and ice to melt, resulting in the formation of water beneath the road surface. During the spring thaw period, the road surface sits on a saturated layer of subgrade and is most at risk of damage from heavy traffic loading (Daniel et al., 2018). Then, rapid temperature drops create frost heaves when subsurface water freezes forming an ice lens, which expands, contracts, and lifts the road surface (Sias et al., 2025; Figure 7-9).
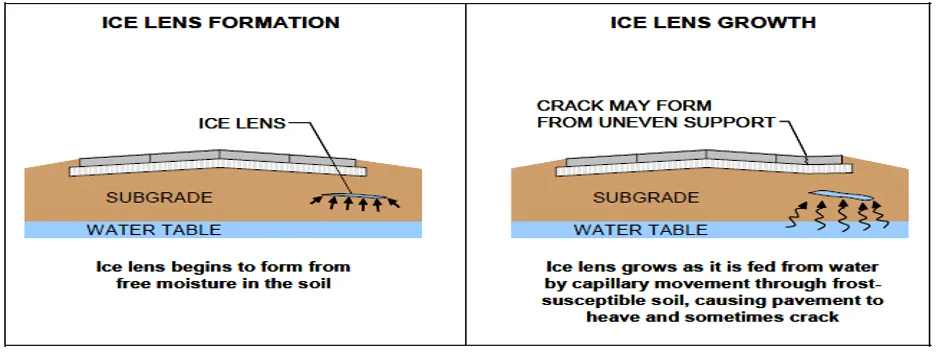
Source: Ahmad & Khawaja (2018)
Frost heaves impact the daily lives of Vermonters; as cracks form they can damage a vehicle’s tires and suspension system (Doyle, 2018). A VTRANS maintenance engineer shared, “Some frost heaves…are so substantial that if drivers pass over them, even obeying the speed limit, they can catch air” (McArdle, 2018). Unlike potholes, frost heaves impair the overall road structure, making it more difficult to repair (Doyle, 2018).
Adaptation Considerations
These climate-change-induced structural and functional threats suggest the need for efforts to harden and maintain roadways. Roads that are built on top of frost susceptible base soils, like silt and clay, will absorb more water than materials like granular sand or gravel (McArdle, 2018). Adaptation strategies to address the structural impacts of increased water beneath the road surface during freeze-thaw cycles include restricting traffic loads and using coarse grained soil as a capillary barrier above the groundwater table (Elshaer & Decarlo, 2021).
Current adaptation strategies being used across the state include the use of cold patch asphalt, which temporarily seals cracks and potholes, followed by the application of longer-lasting hot mix asphalt, applied during warmer months (Brown, 2019). Some municipalities—including Colchester, South Burlington, and Waterbury—are purchasing portable “hot box” units, which can streamline the maintenance process (Brown, 2019). Heating cold patch asphalt lengthens its effectiveness, minimizes labor, and eases application (Brown, 2019). The hot box unit can also create a hot mix from recycled asphalt year-round, which is a more durable solution (Brown, 2019). However, these units can cost between $20,000–30,000. The Montpelier public works director said the city had to rely on manual patching until funds were freed from their equipment budgets (Brown, 2019).
Additional innovation may be required for roadways to adapt to increasing freeze-thaw cycles and soil moisture. A case study in Hartland, Vermont demonstrated the effectiveness of using geosynthetic wicking fabrics to improve rutting resistance of the pavement on a gravel surface, low volume access road (Elshaer & Decarlo, 2021). The structural integrity of the road had been compromised so that a single vehicle pass would cause excessive roadway surface rutting during the spring thaw period. Geosynthetic wicking fabric served as an effective moisture barrier to prevent groundwater from rising into unbound roadway layers and to drain water out of the pavement structure.
7.4 Damage to buildings
7.4.1 Building damage from floods
Impacts
In Vermont, flood risk is often concentrated along rivers and streams, reflecting the state's historical city and town settlement patterns along these waterways (see Community Development 11.6.3). Development within these river corridors is increasingly vulnerable to fluvial (i.e., riverine) erosion and inundation, due to the natural meandering of rivers (State of Vermont Flood Ready, 2026). Locations damaged in the July 2023 flood are largely consistent with those that experienced damage during Tropical Storm Irene in 2011, highlighting patterns in flood risk and exposure in Vermont. The greatest damage was concentrated in Montpelier and Barre, while other towns along the Green Mountain crest and in the Northeast Kingdom also experienced damages, including but not limited to Ludlow, Londonderry, and Hardwick (Vermont Department of Housing and Community Development, 2025).
Roughly 10,000 structures in Vermont are located within the FEMA mapped floodplain zone (State of Vermont, 2026a). This is due to be updated, so the current number may be an undercount. As a specific example of what this means for communities, in Montpelier, 12% of the city’s buildings are located in Special Flood Hazard Areas (SFHAs), demonstrating the risk of dense historic floodplain development (VTANR, 2026). However, 40% of flood insurance claims nationally come from outside of the FEMA mapped floodplain, demonstrating that floods are not restricted to mapped vulnerable locations (FEMA, 2022).
Vermont’s housing affordability shortage introduces an additional challenge for climate adaptation, as low-income homeowners may struggle to afford repairs or to find accessible housing outside floodplains and river corridors (FEMA, 2022; see Community Development 11.3.2). Manufactured housing communities are more vulnerable to flooding damage as many are built on land with poor drainage, lack proper elevating and anchoring of homes, and were constructed prior to current land use regulations that analyze site hazards (Baker et al., 2014; see Community Development 11.3.1).
The July 2023, December 2023, and July 2024 flooding events caused large-scale infrastructure damage. Both catastrophic fluvial inundations (i.e., from the overflowing of rivers), and pluvial flooding (i.e., from heavy precipitation and snowmelt) have increased in Vermont, as evidenced by these recent flooding events (see Climate Change in Vermont 2.5.2 and 2.5.3). These extreme precipitation events lead to widespread erosion damage, especially in mountainous settings (Mingle, 2025), which can cause large-scale infrastructure damage, such as destabilized building foundations (Field Geology Services, 2007).
The flooding of July 2023 resulted in a federal emergency declaration, numerous mudslides and landslides which stranded residents and destroyed homes, and caused at least $600 million in estimated damages (Banacos, 2023; Soares et al., 2025; Vermont Agency of Administration, 2023). Following the December 2023 floods, Gov. Phill Scott reported dozens of flooded basements in homes across several towns, the evacuation of 30–50 homes in Moretown Village, and the flooding of 12 manufactured homes in Brattleboro (Scott, 2024; Figure 7-10). In July 2024, 4–8 inches (101–203mm) of torrential rainfall led to rapid flash flooding in Orleans, Caledonia, and Essex counties and destroyed at least 42 homes (Goff & Banacos, 2024).
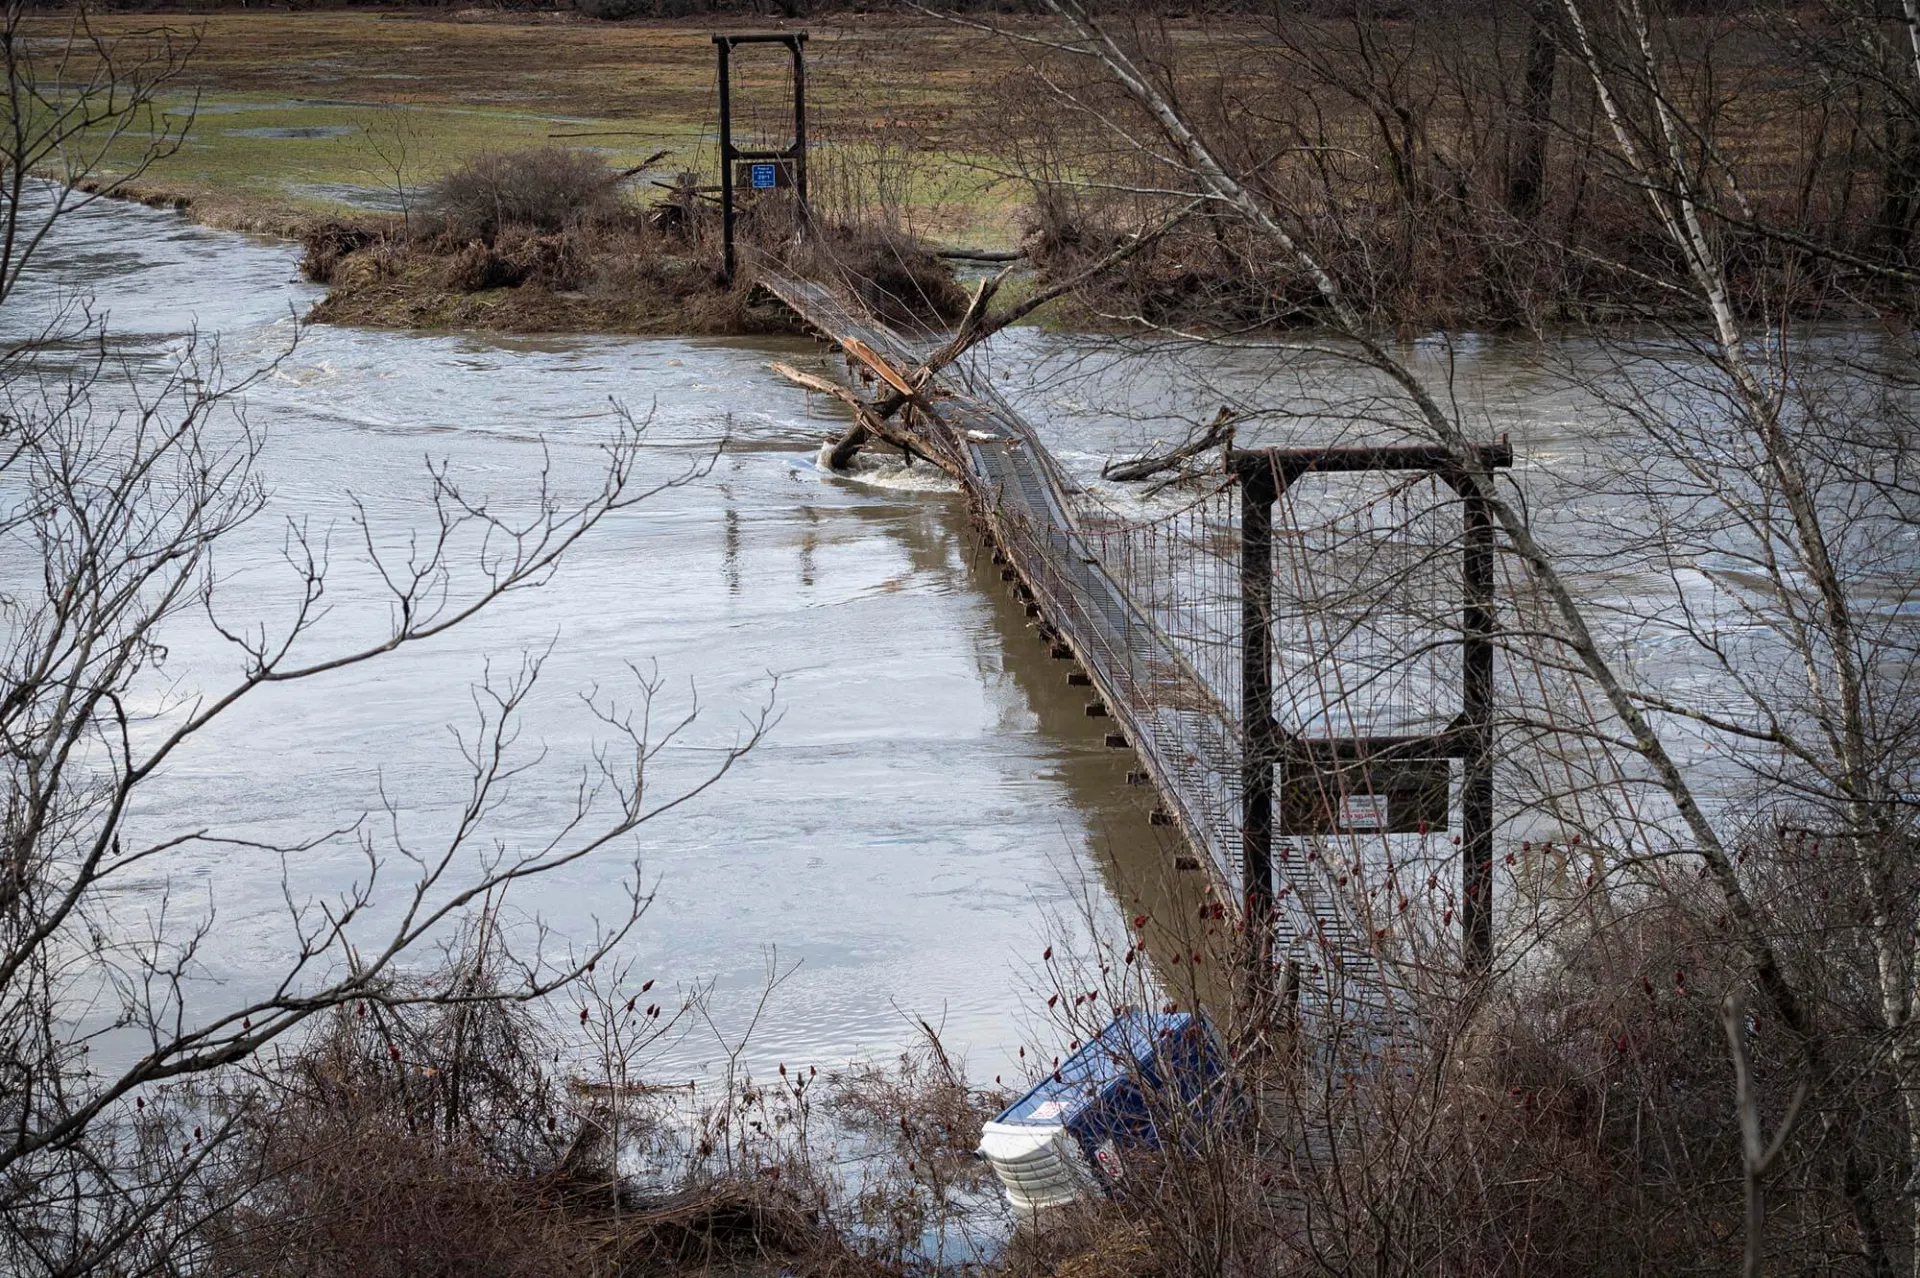
Source: Glen Russell/VTDigger (2023)
Vermonters and Vermont businesses self-reported significant flood damage to their homes in recent years via the 211 human services helpline, with 9,234 total reports between July 2023 and October 2024 (Vermont Emergency Management, 2023a; Figure 7-11). Across the three flooding events, structural damage reports were highest in Washington County. Most reports (5,026) occurred following the July 2023 flooding, with significant self-reported damage reports (2,898) following the two major flood events in July 2024. Relatively few damage reports were registered during the December 2023 floods (109 total between homes and businesses), but it is important to note that the rain-on-snow flood events that can occur during “shoulder seasons” remain a significant concern to developed areas in the floodplain.
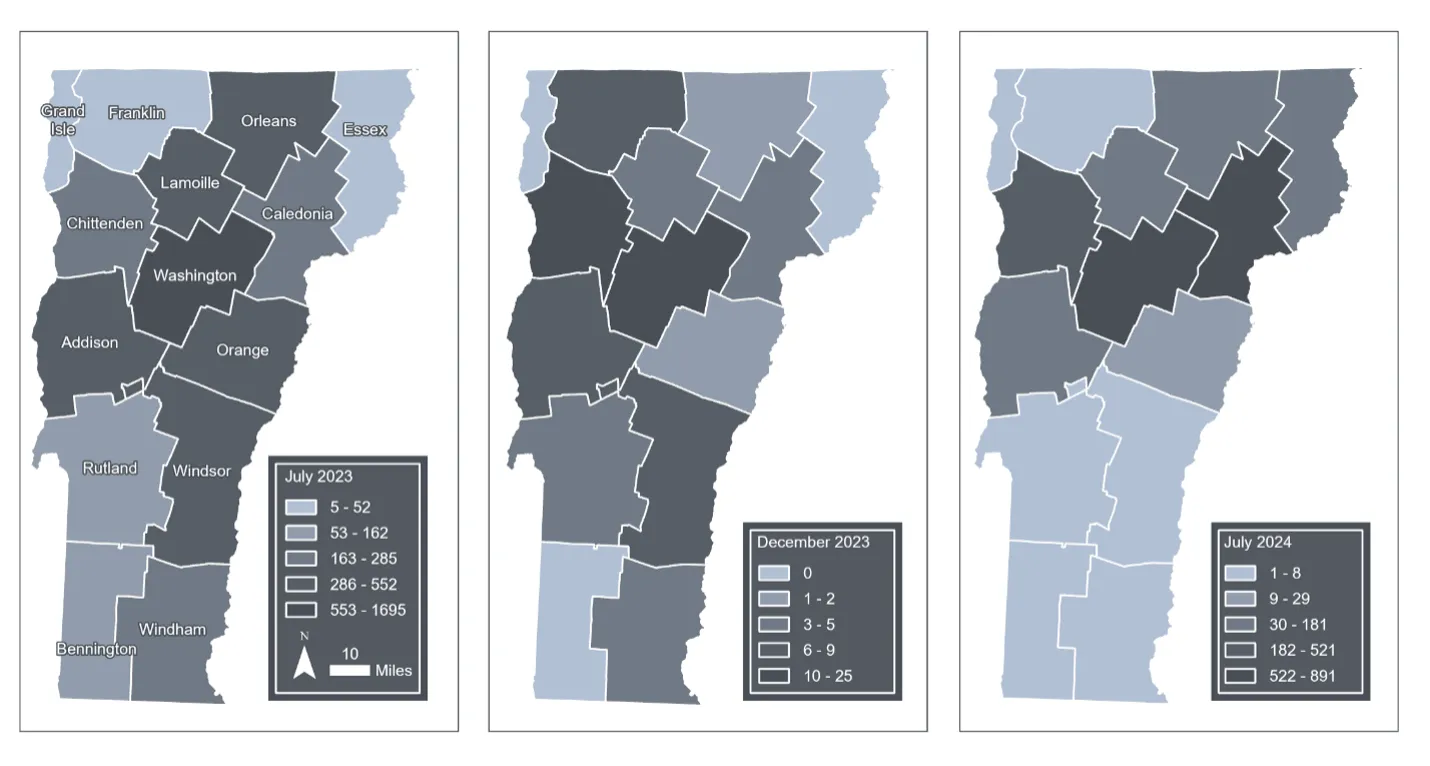
Source: Vermont Emergency Management (2023a)
Note: Data compiled by Jessica A. Balerna and visualized by Hannah C. Turner
In terms of specific structural damage, structure walls and roofs are most often impacted due to hydrostatic pressure, erosion, and moisture saturation (FEMA, 2014a). In Washington County—where communities in the Winooski River floodplain were severely flooded in July 2023—self-reports of damage were particularly high, with 439 reports related to structure foundations and 829 reports regarding structure walls/roofs (Vermont Emergency Management, 2023a; Figure 7-12). The structural impacts recorded because of the July 2023 flooding spanned foundation damage to structures in Washington, Windsor and Lamoille counties, and basement damage to structures in Washington, Addison, Windsor, and Orange counties. The most notable impacts of December 2023 pluvial flooding took place in the Winooski River Basin, and self-reports of residential properties in Chittenden County note 21 flooded basements, 14 homes with wall/roof damage and seven homes with foundation damage. July 2024 flooding damage spanned structures largely in Caledonia (156 reports of foundation damage, 200 reports of wall/roof damage) and Washington counties (134 reports of foundation damage, 143 reports of wall/roof damage).
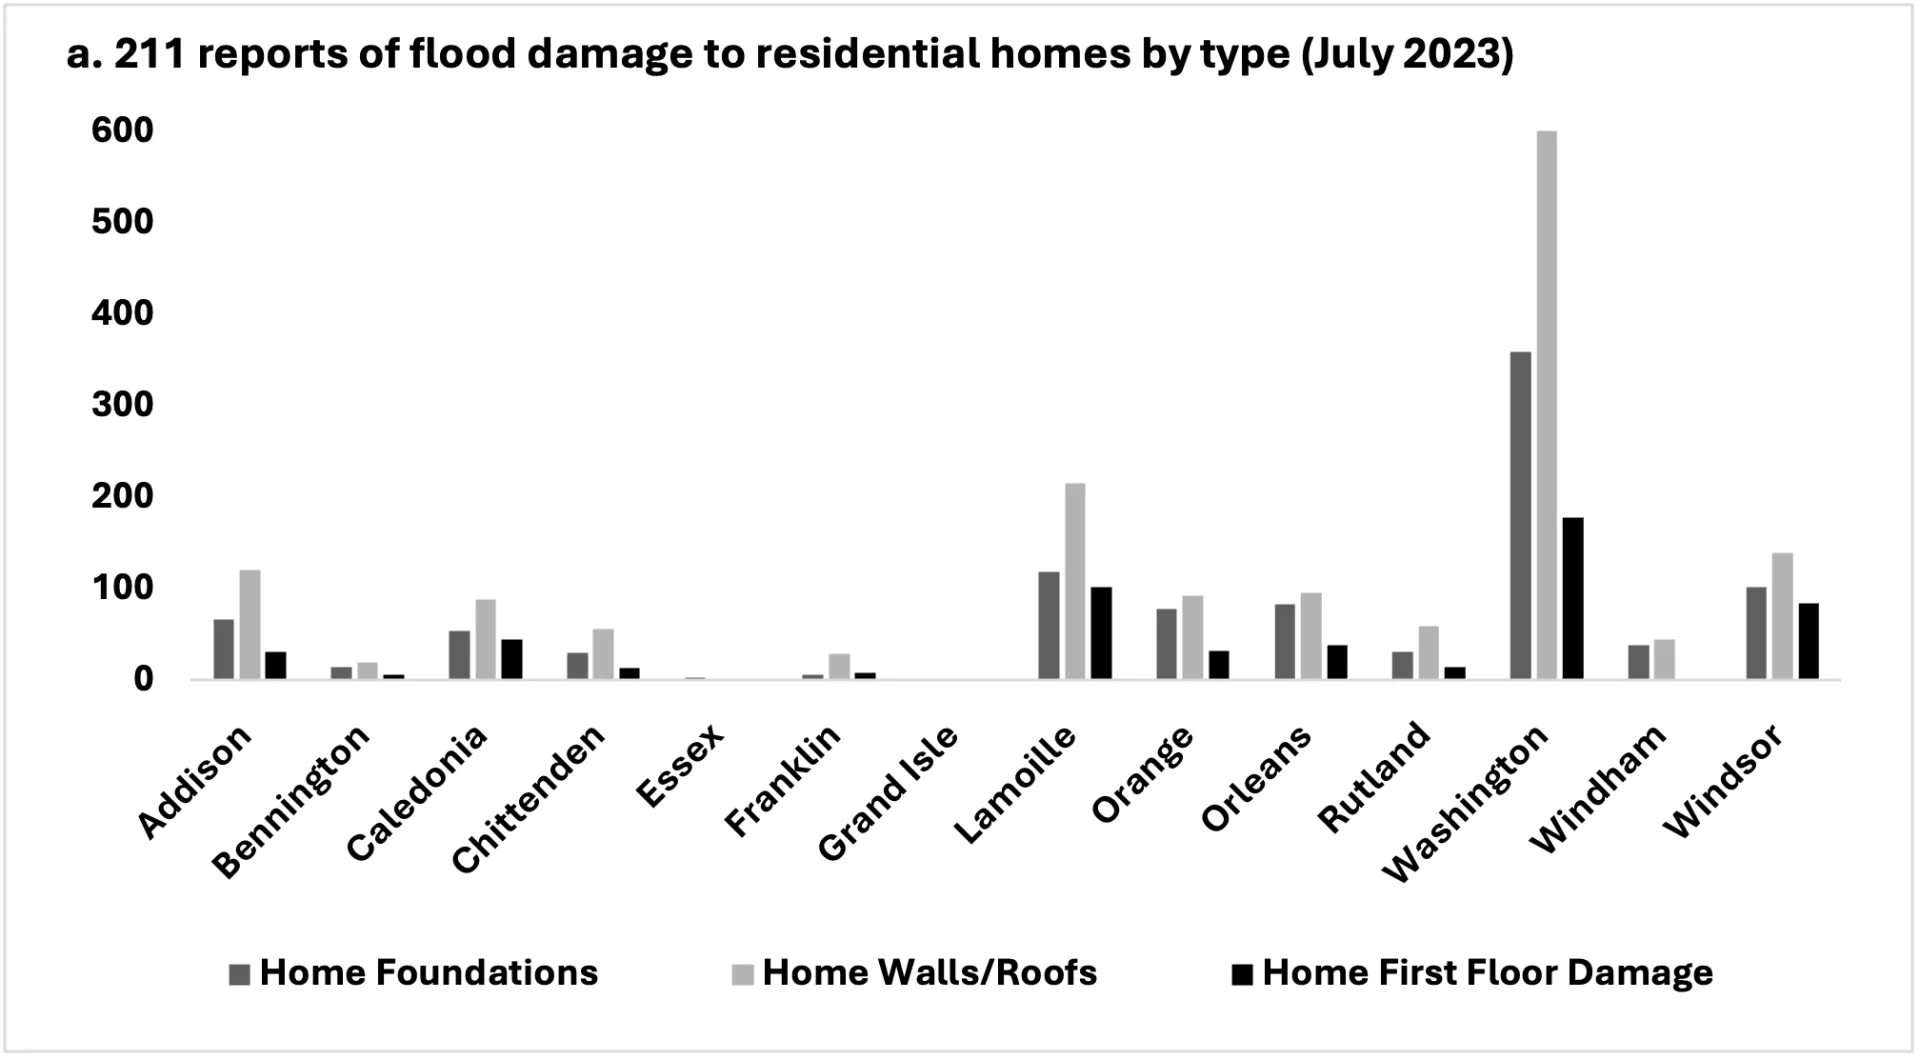
Source: Vermont Emergency Management (2023a)
Note: Data compiled by Jessica A. Balerna
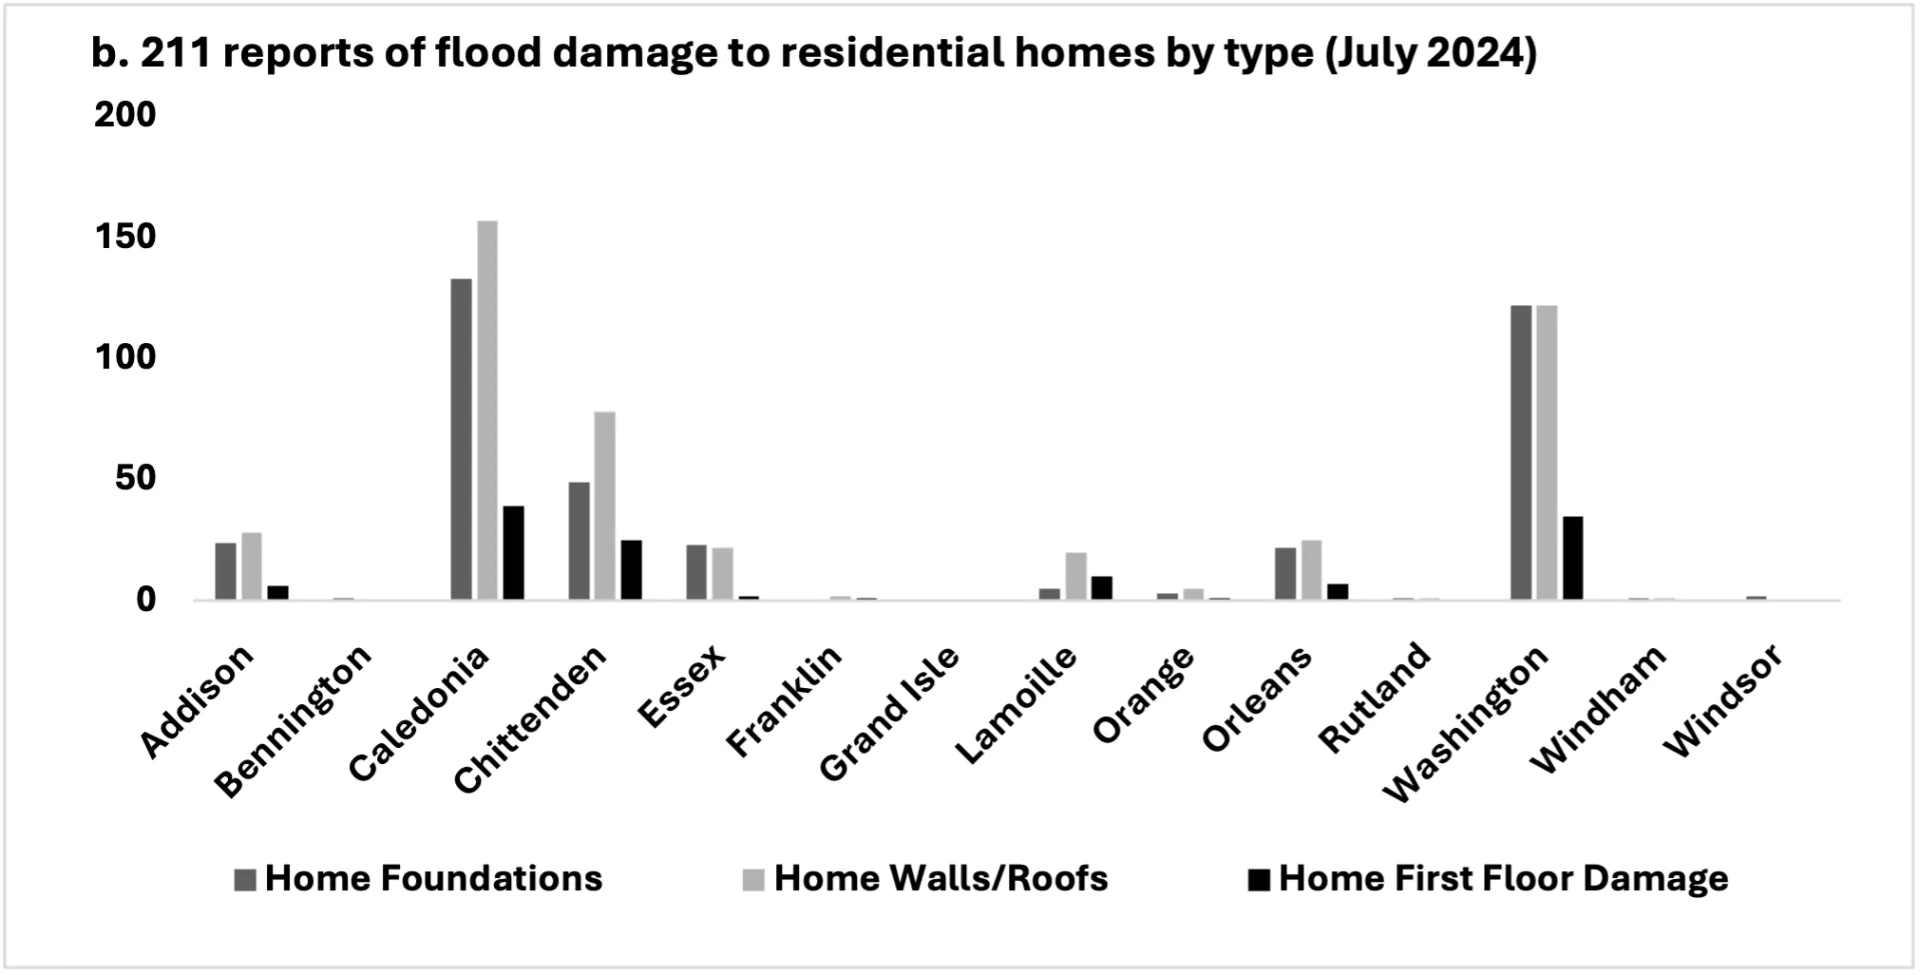
Source: Vermont Emergency Management (2023a)
Note: Data compiled by Jessica A. Balerna
Residential nonstructural flood damage costs include emergency temporary and long-term lodging for those displaced, as well as the costs of cleanup from property damage (Rhodes, 2023; see Community Development 11.3.2). A July 2025 report estimated that Vermont still has over $100 million in unmet housing need as a result of damage from the summer 2023 flood event alone (Vermont Department of Housing and Community Development, 2025). The projected increase in fluvial flood risk in Vermont is estimated to total $2.13 billion in property damage over the next 100 years (Gourevitch et al., 2022). Climate change is expected to result in an increase of the cost of these damages to $5.29 billion (Gourevitch et al., 2022).
Adaptation Considerations
Addressing infrastructural inequities and weaknesses across Vermont requires hazard mitigation and pre-disaster planning at the household, community and state levels (see Community Development 11.6).
The Vermont Emergency Management Hazard Mitigation Assistance Program funds structural elevation, mitigation reconstruction, and floodproofing of nonresidential and municipal buildings (Vermont Emergency Management, 2023b). Structural elevation has been pursued as an adaptation strategy in municipalities hardest hit by the July 2023 flooding, supported by the 2024 Community Resilience and Disaster Mitigation Grant Program (Smith, 2024). Funding recipients for residential structure elevations were chosen in Barre, Montpelier, Hardwick, Cambridge, and Ludlow (Smith, 2024). These awards cover up to $300,000 per structure, ensuring that the lowest floor and all attendant utilities are elevated at a minimum of 2’ (60.96 cm) above the base flood elevation (Smith, 2024). The fund was intended to prioritize elevation projects for homeowners with greater economic need and to prevent repetitive loss in low income and marginalized communities (VEM, 2026).
Funding elevation projects will build flood resiliency and lower damage costs in communities hardest hit by continuous flooding events.
‘One Montpelier woman lives in a flood-damaged 1870s farmhouse with her two children. After the flood they had nowhere to go. They have been living with no floors, no walls. She's been cooking on a grill that entire time,’ city councilperson Lauren Hierl said. ‘The woman has spent at least $40,000 toward the work of drying out and demolding the house,’ she said. ‘She has added insulation and subfloors and no longer has a bathroom on the first floor. If a buyout happens, the bank owns the home so she and her children will be homeless.’ (Rathke, 2024).
Mitigation along these lines can reduce risk to individual buildings and communities; however, considering that more than 3,000 reports were made to 211 for structural damage in 2023 and 2024 (Figure 7-12), the pace of mitigation must increase to make a statewide impact.
Flood proofing may reduce the costs associated with flood recovery but does not eliminate the threat of flood damage. Even when floodwaters are not moving, they exert hydrostatic pressure on buildings, which increases with water depth, while floodwater saturated soil produces a buoyancy force on basement floors (Figure 7-13). Standard wood frame and masonry constructed walls are not built to withstand this added pressure, causing walls to be pushed in or out (Federal Emergency Management Agency, 2014). Wet floodproofing, when lower levels of non-residential structures are allowed to flood, attempts to counteract and equalize this pressure (American Society Civil of Engineers & FEMA, 2022). This floodproofing technique suggests the elevation of mechanical equipment, integration of flood damage resistant materials, anchoring of the structure, and use of flood openings (American Society of Civil Engineers & FEMA, 2022).
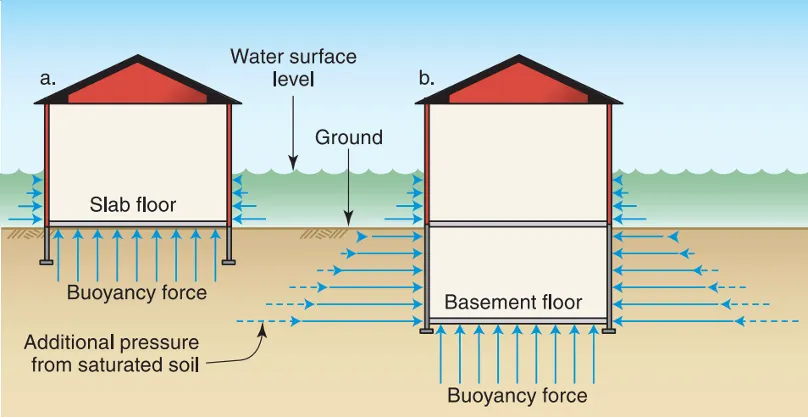
Source: Federal Emergency Management Agency (2014)
Towns across Vermont have implemented innovative community-level projects to empower and connect residents to direct flood mitigation action. To supplement volunteer work, Waterbury, Vermont has hired a part-time Natural Disaster Preparedness and Response Coordinator to increase the town's flood response rate and overall planning efficiency. Waterbury has also established a Natural Disaster Preparedness Committee Volunteer Corps to be trained in team leadership, administration, communications, property assessment, inventory, mucking, and transportation (M. Dugan, personal communication, December 11, 2025). In response to July 2024 flooding, the Black River Action Team’s “Cavendish Culvert Crawlers” initiative was created to assess damaged and blocked culverts to support town staff in culvert and ditch maintenance (Okemo Valley TV, 2025). As part of a partnership between Dartmouth College, Black River Action Team, Cavendish Connects, and Black River Valley Resources, student volunteers created a culvert monitoring citizens science app for volunteers to survey culverts in Cavendish (Okemo Valley TV, 2025). Community-level mitigation and response projects will be increasingly important in building local flood resilience and can be modeled similarly in towns across the state.
Furthermore, incentivizing low-risk development will also promote more resilient building infrastructure. The Vermont Flood Safety Act of 2024 regulates new development in river corridors to reduce future flood damage (State of Vermont, 2026b). The act provides VTANR with the authority to regulate development in river corridors within river watersheds two square miles or greater, and the VTDEC will begin requiring development permits in river corridors in 2028 (State of Vermont, 2026b). Additionally, the Flood Hazard Area and River Corridor Rule recognizes that historic floodplain encroachments and flood mitigation approaches have sustained Vermont’s flood vulnerability, thus the rule aims to comply with National Flood Insurance Program criteria by discouraging encroachment in undeveloped flood hazard areas and river corridors (Vermont Watershed Management Division, 2014).
Flood risk disclosure provisions outlined in Act 52 require that the buyer of a property must be informed of flood risks associated with their property; these went into effect in September 2025 (State of Vermont, 2026c). Understanding past and potential risk means that property owners can act to protect and adapt their homes accordingly by purchasing flood insurance and floodproofing. Ultimately, a combination of development regulations, structural adaptation, and hazard mitigation planning will be required to reduce building damage from flooding.
7.4.2 Warmer winters and temperature swings damage buildings
Impacts
Increasingly variable temperatures and warmer winters exacerbate strains on Vermont’s older buildings. Certain building materials are more vulnerable to temperature variability and increased winter precipitation. For example, brick and ceramic building components experience frost damage from freeze-thaw cycles, while stone is prone to weathering and erosion from high precipitation (Phillipson et al., 2016). Both metal and wood experience deterioration (corrosion and biological deterioration, respectively) from precipitation and temperature changes (Phillipson et al., 2016). Older buildings require proper maintenance to preserve the natural thermal mass of masonry that can regulate internal temperatures. Proper maintenance includes preventing the absorption of water during insulation, blocking unused fireplace openings, capping chimneys, and maintaining mortar joints (Preservation Trust of Vermont & Vermont State Historic Prevention Office, 2021). To mitigate building degradation, infrastructure must be designed to protect buildings against extreme weather events with improved drainage, insulation, and flood defense.
Vermont has some of the oldest housing stock in the country; an estimated 29% of homes in Vermont were built in 1939 or earlier (Van Hoesen & Letendre, 2013; Figure 7-14). Vermont’s oldest buildings lack newer energy efficiency building standards and were not designed or built to withstand a changing climate. Buildings from this era in the Northeast U.S. often experience efficiency issues due to balloon frame construction (exterior walls that lack insulation), leaky foundations, poorly sealed doors and windows, and insufficient attic insulation (Van Hoesen & Letendre, 2013). These inefficient building envelopes are more vulnerable to additional moisture and deterioration of building materials caused by increasing freeze-thaw cycles (Auld et al., 2007).
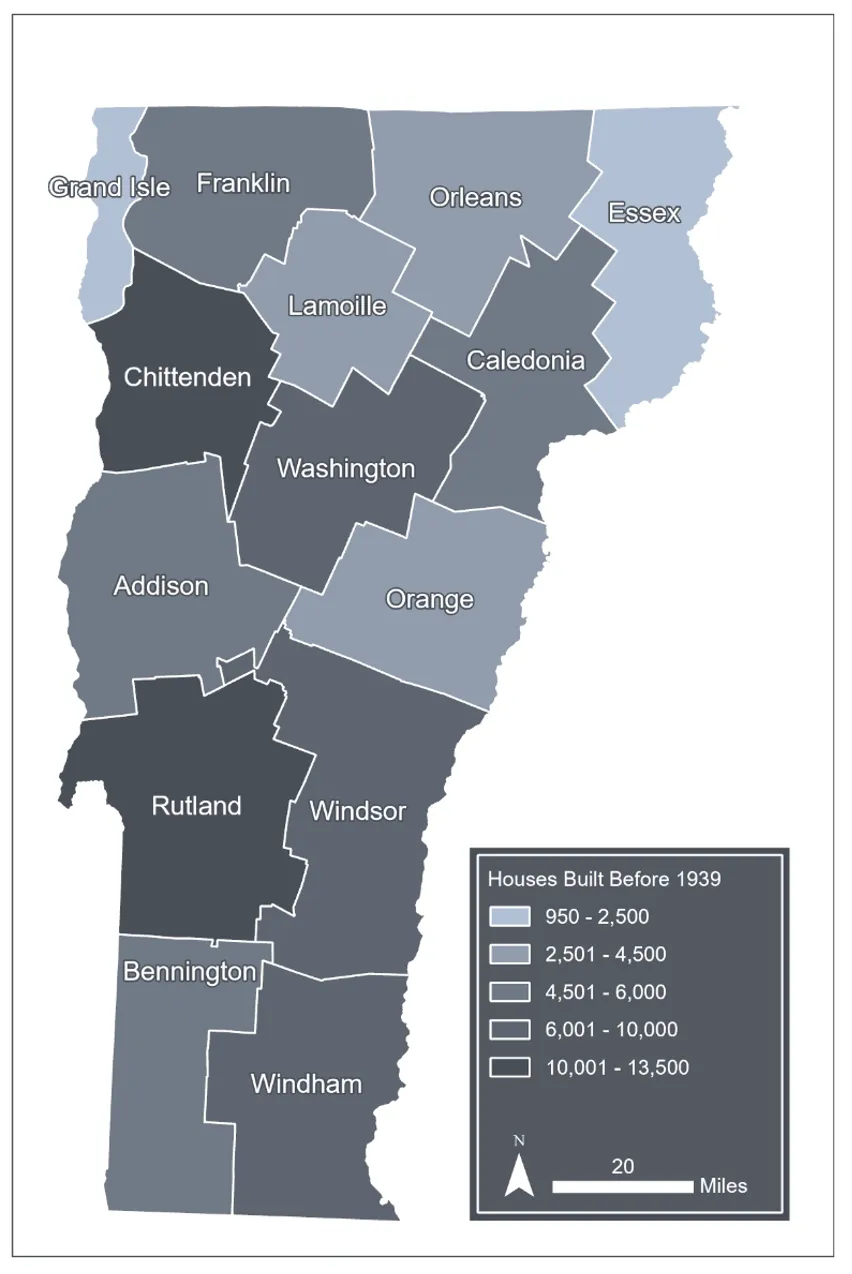
Source: Vermont Housing Finance Agency (2023)
Note: Data visualization by Hannah C. Turner
Adaptation Considerations
There are several existing programs designed to mitigate energy expenditures and strengthen resilience, but it will be critical that these programs prioritize adapting existing buildings and focus on weatherizing Vermont’s oldest buildings. Home weatherization for low- and moderate-income households is one of the recommendations in the Vermont Climate Action Plan (VCAP; Vermont Climate Council, 2025a). The plan states that current federal funding has the capacity to weatherize about 4,000 homes annually, with an average cost of $11,000 per home (Vermont Climate Council, 2025b). The Municipal Energy Resilience Program (Vermont Agency of Administration, 2025) is a state-level program intended to help municipalities improve community energy resilience. Vermont appropriated $45 million through the Municipal Building Energy Resilience Program (Act 172, 2022) to support free building energy resilience assessments, capacity-building mini-grants, and larger implementation grants for municipalities to promote energy resilience such as weatherization, fuel switching, and renewable energy generation. Notably, this program only applies to municipal buildings. Multifamily new construction might consider implementing the Efficiency Vermont High Performance standard, providing incentives to improve thermal envelopes, airtightness, water conservation, and efficient appliances, lighting, and equipment (Bushey, 2025). The Vermont Weatherization Assistance Program, offers free, whole-home energy improvements to eligible Vermonters; however, the program relies on a blend of funding sources and faces budgetary uncertainty when federal funding is in flux—as it was in Fiscal Year 2026 (Wilcox, 2025; see Energy 8.5). Moving forward, incremental weatherization will require bridging a foreseeable federal funding gap at the state level, requiring further discussion about this as a priority.
7.5 Damage to utilities
7.5.1 Power Grid
Impacts
Extreme weather events pose increasing challenges to power grids in Vermont. Most (80%) of U.S. power outages stem from extreme weather events (American Society of Civil Engineers , 2025). In Vermont, power outages and other damage to utilities are becoming more severe due to the increased intensity of wet snow, winds, and ice storm events (C. Brunner, personal communication, Nov. 19, 2025). Between 2008–2019, energy outages were highest during shoulder seasons (especially late fall/early winter) due to high winds that damaged utility poles and powerlines, and wet snow that caused tree branches to snap and damage powerlines (see Figure 6-12 in Galford et al., 2021). In the years since, this trend has persisted. Utilities continue to see a similar frequency of outage events during the late fall/early winter, combined with an increase in the severity of these events (C. Brunner, personal communication, Nov. 19, 2025). Beyond the short-term impact of outages, climate stressors can also be linked to decreased power grid infrastructure lifespans (Fant et al., 2020) due to damages to distribution/transmission lines from lightning strikes, wildfire damage, and greater risk from increased vegetation growth (Fant et al., 2020; FEMA, 2022; Lawrence Berkeley National Laboratory, 2024). Aboveground lines are particularly at risk. In Vermont, areas outside of Chittenden County or downtown centers tend to exclusively have aboveground transmission and distribution lines (Figure 7-15), posing both an equity and community resilience concern. Underground lines are more resilient and tend to be concentrated in Chittenden County, as well as dense downtown centers statewide.
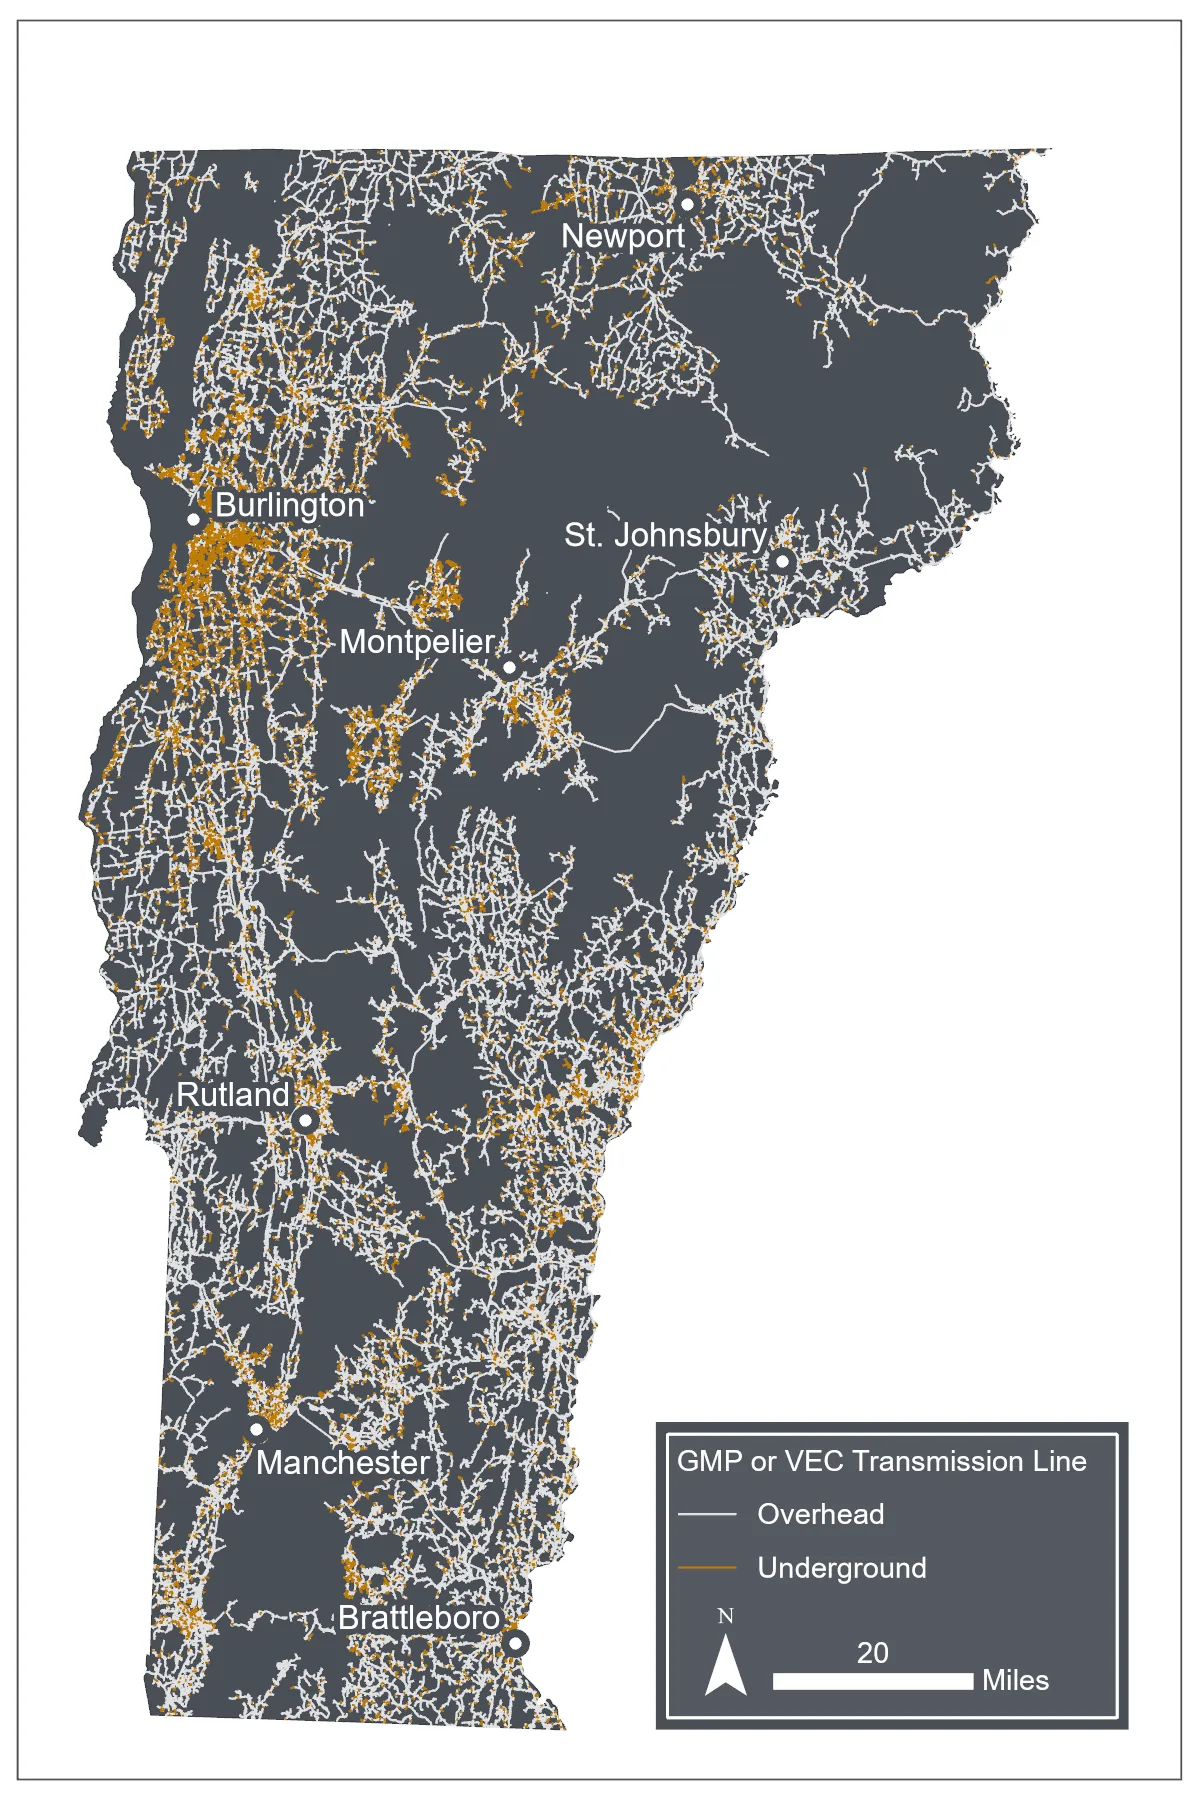
Sources: Green Mountain Power (2025), Vermont Electric Cooperative (2020)
Note: Data visualization by Hannah C. Turner
Wood poles used in the electric grid are also at risk of increased decay under climate change from more intense precipitation, warmer temperatures, and flooding (Merschman et al., 2020). Older poles are more at risk of failure (American Society of Civil Engineers, 2025). On average, poles in the northeast region of the state are older, while poles in Chittenden, Addison, and Orange counties have been installed more recently (Figure 7-16). The national “Infrastructure Report Card” on energy released by the American Society of Civil Engineers describes how wood power line poles under 60 feet (18.28 m) tall are “not required to be built to withstand severe storms.” Approximately 91% of Vermont’s land area is serviced by three utility providers: Green Mountain Power (GMP), VEC, and Washington Electric Cooperative (WEC), and at least 98.9% of poles managed by these three providers are under 60 feet tall (Vermont Center for Geographic Information, 2025).
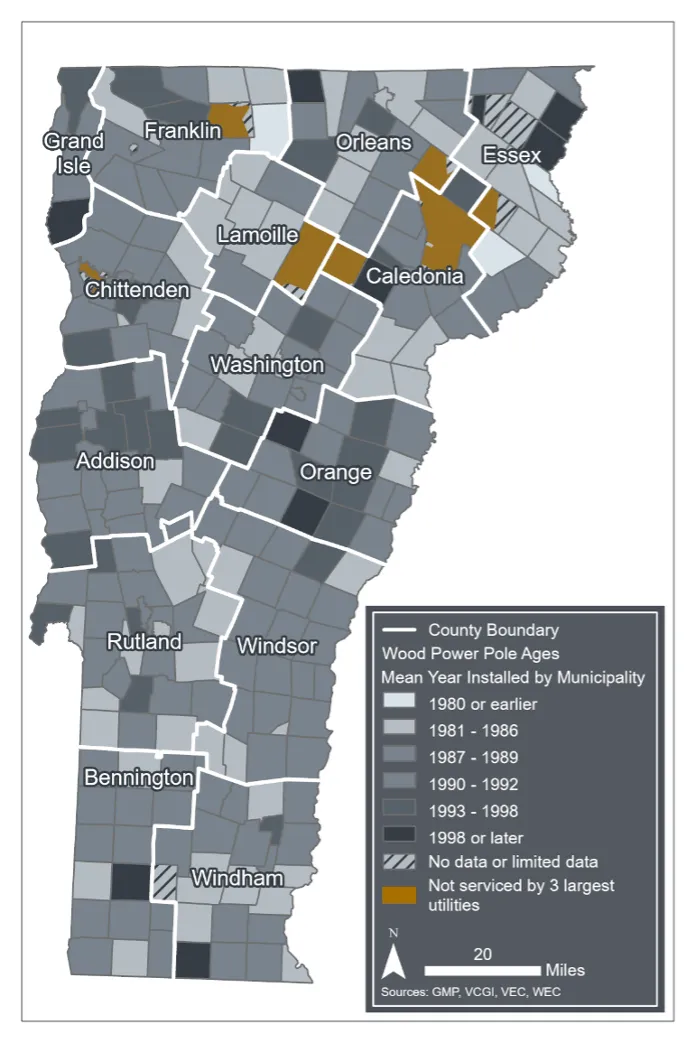
Sources: Green Mountain Power (2022), VCGI (2025b), Vermont Department of Public Service (2020), Vermont Electric Cooperative, (2020a)
Note: Data visualization by Luke Briccetti and Hannah C. Turner
Electric substations are at risk from increased floods (Fant et al., 2020). Substation damage can lead to power outages, fires, and—especially when a control house is impacted—costly repairs (FEMA, 2022). Of Vermont’s 334 substations, at least 34 (or 10.2%) are in a flood zone (Figure 7-17). This analysis is likely an undercount, as parts of the Connecticut River watershed lack any flood zone mapping.
Lastly, increased heat can also reduce peak electricity capacities for transmission lines, substation transformers, and distribution transformers (Bartos et al., 2016).
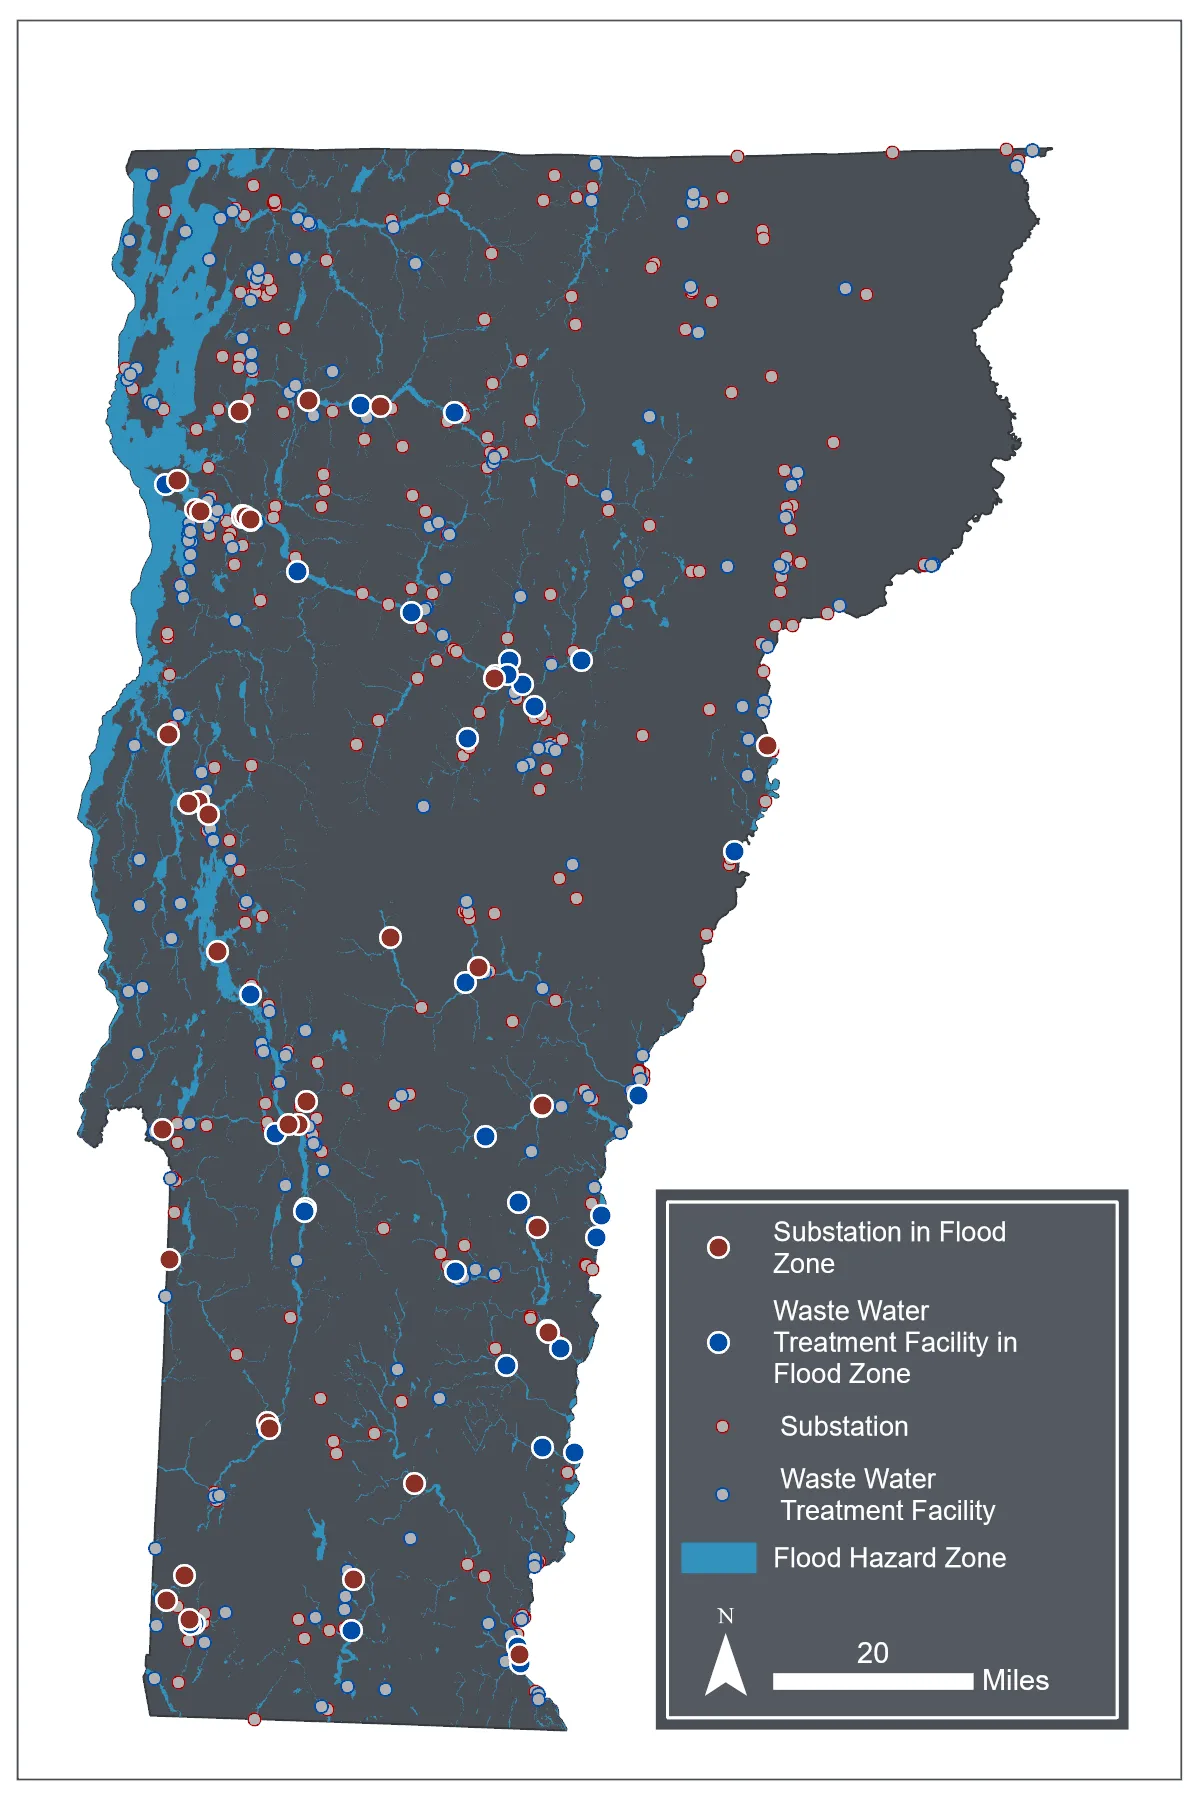
Source: Flood maps outside of the Lake Champlain watershed (Federal Emergency Management Agency, 2024); Flood maps within the Lake Champlain watershed (Vermont Center for Geographic Information, 2022); Substations (Vermont Department of Public Service, 2021); Wastewater facilities (Vermont Agency of Natural Resources, 2022)
Note: Data visualization by Hannah C. Turner
Adaptation Considerations
Adaptation measures are available at the household, community, and regional/state levels. For households, using renewable energy backup systems can act as a safeguard against prolonged utility outages. Backup systems include traditional woodstoves or microgrids (provided via backup batteries or solar energy). Both individual households and municipal buildings should invest in backup systems to provide the most resilience during emergencies (Galford et al., 2021). Utilities can bolster the resiliency of their grid by subsidizing battery backup systems. For example, GMP, the state’s largest utility provider, operates a program that allows homes vulnerable to power outages to lease backup batteries from the utility (GMP, 2023; Weiss-Tisman, 2025). This program helps homeowners to avoid the costly investment of purchasing the battery outright and allows GMP to meet resiliency challenges during peak demand when energy is most expensive to purchase.
Undergrounding lines can reduce power grid vulnerability to extreme weather events, especially in rural areas where repairs are likely to take longer and be costlier (Lawrence Berkeley National Laboratory, 2024; Wilson & Jarecki, 2023). Utilities have also sought to “harden” the aboveground grid by using more durable line types, relocating lines away from vegetation, and physically protecting vulnerable lines with coverings (Dumarevskaya & Parent, 2023; VEC, 2024). These strategies can be implemented by the state’s largest electrical utilities, but also by the 14 other utility providers in Vermont that operate within the bounds of denser villages and city centers (for example, the Burlington Electric Department). These processes require significant investment on the part of utilities, which have historically used federal programs, such as FEMA mitigation funding (VEC, 2023), to move undergrounding and hardening efforts forward.
Congress appropriated $10.5 billion in grid resilience and $1.0 billion for rural grid infrastructure resilience nationally as part of the Infrastructure Investment and Jobs Act in 2022. In Vermont, this funding was used by utilities for both line undergrounding and grid hardening (GMP, 2023; VEC, 2023). For example, VEC used much of this funding to proactively remove ash trees impacted by Emerald Ash Borer (Agrilus planipennis; C. Brunner, personal communication, Nov. 19, 2025). Emerald Ash Borer weakens ash trees and makes them more prone to blowing down during a severe storm (see Forests 3.7.1). Despite this increase in funding and efforts to improve lines, grid hardening and line undergrounding efforts are not keeping up with increases in storm severity. For example, a VEC representative wrote: “We are lucky if we improve 10–12 miles of line annually and have over 2,400 miles of distribution.” (C. Brunner, personal communication, November 19, 2025).
Box 7-2: Using artificial intelligence (AI) to predict grid vulnerability
Vermont Electric Cooperative (VEC), Vermont’s second-largest utility provider by service territory, recently became the first utility in the country to implement a machine learning tool that predicts grid vulnerability using artificial intelligence (Giles, 2025). The utility intends to use this software tool, Rhizome, to help them prioritize their limited resources for grid upgrades in the areas that are most vulnerable. VEC has found Rhizome to be particularly effective at predicting vulnerability to ice storms, and how the vulnerability of areas of the state to ice storms will change over time (C. Brunner, personal communication, Nov. 19, 2025). This initiative can serve as a pilot study for using similar prioritization tools by utility operators throughout the state, allowing utilities to better focus their investment strategies.
7.5.2 Fuel, wastewater, and drinking water distribution grid
Although Vermont has no natural gas processing or storage facilities, natural gas processed elsewhere is still part of Vermont’s infrastructure. Vermont Gas Systems (VGS) serves 56,000 consumers in Franklin, Chittenden, and Addison counties via a combined 981 miles of distribution and transmission pipelines (U.S. Department of Energy, 2021; U.S. Energy Information Administration, 2024; VGS, 2025). There is also one petroleum pipeline (the Portland-Montreal Pipeline) that travels 117 miles through the northeast portion of the state, which is only in use intermittently (GMP, 2023; Weiss-Tisman, 2025).
Fuel pipelines are generally comprised of pressure-resistant steel; however, exposure to pollutant-laden floodwaters can increase corrosion, especially at valves, which can increase the likelihood of gas leaks (Łaciak et al., 2020). These pipelines do travel through flood zones (Bartos et al., 2016; U.S. Energy Information Administration, 2025) although they are buried at least four feet (1.21 m) deep in most locations, and seven feet deep under streams (Polhamus, 2017). Therefore, they are generally not considered to be significantly at risk from flooding. However, there are some sections of the more recently constructed Addison County pipeline that are buried as shallow as three feet (.91 m) deep, which has resulted in community action and fines against VGS, despite the state Public Utility Commission ruling that the pipelines in these locations are largely safe (Polhamus 2017, Poux 2025). As of 2018, natural forces (including floods) had caused about $25,000 in economic damage to Vermont’s natural gas pipelines per year (U.S. Department of Energy, 2021).
Gas lines and appliances within flood-prone homes and businesses are at higher risk. Floods can damage gas valves, burners, and control systems (Bedrich, 2026; Fasel, 2025), which can result in costly repairs and gaps in heating coverage. Gaps in heating during a flood can be particularly harmful during rain-on-snow flooding—such as the December 2023 flood—when outside temperatures can be dangerously cold. Importantly, damage to gas lines and appliances can result in fires, explosions, or carbon monoxide poisoning, and is thus a danger for gas customers living in flood zones.
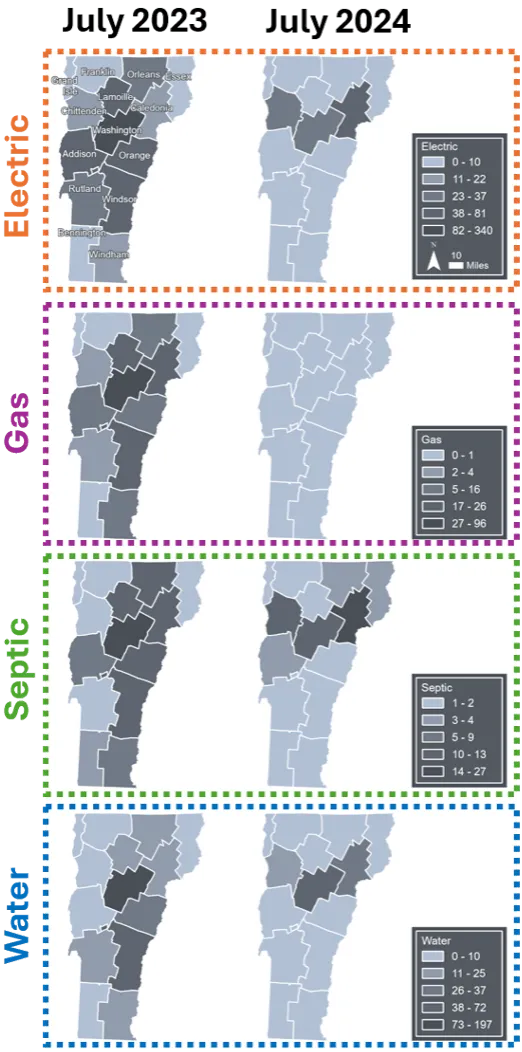
Much like natural gas lines, drinking and wastewater distribution systems are at risk from flooding where they enter homes and businesses. During the summer floods in 2023 and 2024, 537 Vermonters reported damage to their home water systems, including 237 people in Washington County (Vermont Emergency Management, 2023a; Figure 7-18). Water distribution systems are also comprised of strong materials (usually copper or steel) and are often buried, reducing the risk they face from climate stressors. However, 15.8% of wastewater and 11.5% of drinking water distribution line segments in Vermont are located in a 500-year flood zone (Figure 7-19). The villages of Pownal, Richford, Waterbury, Wilmington, and Woodstock/South Woodstock have the highest percentage of at-risk lines. Locations where distribution pipes are embedded in roads at undersized road-crossings are at particularly high risk, because these pipes can be in danger of pressure-driven blow-outs (see 7.3.1). There is currently no statewide database that can be used to identify water mains near at-risk culverts/bridges; however, damage to these distribution lines from both culvert blowouts and floodwaters has been reported in news articles and town meetings across the state. These include reports from St. Johnsbury (Waterhouse, 2024), Middlebury (Berlin et al., 2023), Barton, Plainfield (Barton Village, Inc., 2024), and Barnet (Krupp, 2024).
Of note is that about 40% of Vermonters get their drinking water from wells (Dieter & Linsey, 2017) and about 55% of Vermont wastewater disperses through on-site septic systems (Vermont Department of Public Health, 2024). There is less publicly available data for on-site septic systems and less risk from extreme weather events. Despite this lower risk, some septic damage was reported to 211 by Vermonters during the 2023-2024 floods (168 total reports; Vermont Emergency Management, 2023a; Figure 7-18).
Sources: Flood maps outside of the Lake Champlain watershed (Federal Emergency Management Agency, 2024); Flood maps within the Lake Champlain watershed (Vermont Center for Geographic Information, 2022); Wastewater distribution lines (Vermont Department of Environmental Conservation, 2025)
Note: Data visualization by Hannah C. Turner
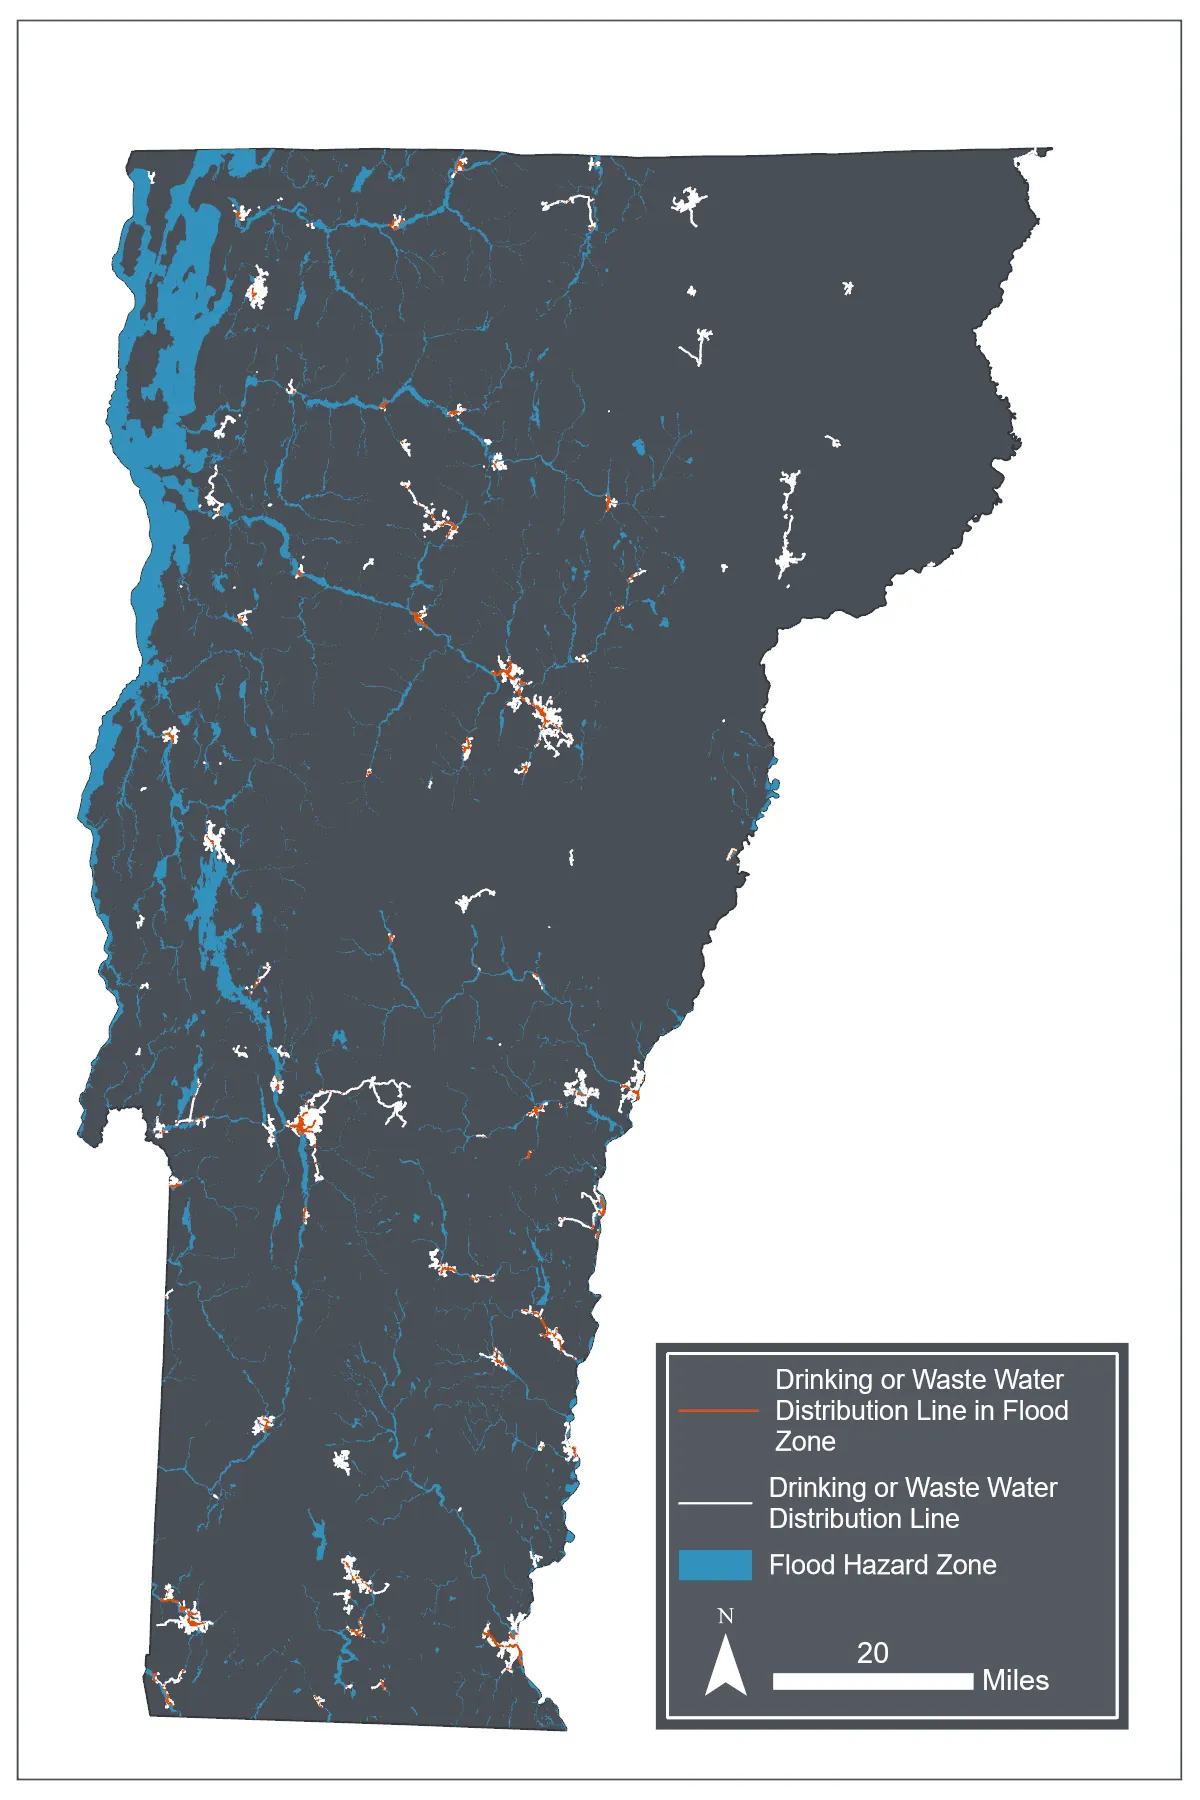
Sources: Flood maps outside of the Lake Champlain watershed (FEMA 2024); flood maps within the Lake Champlain watershed (VCGI 2022); wastewater distribution lines (VTDEC, 2025)
Note: Data visualization by Hannah C. Turner
Lastly, water treatment plants are at risk. These plants are often built in flood zones, since treated wastewater must be released into surface waters. Of Vermont’s 232 wastewater treatment facilities, at least 41 (or 17.7%) are located within currently mapped flood zones (Figure 7-17). During the July 2023 floods, 23 of those plants were damaged by flooding, including reported catastrophic damage to plants in Johnson and Ludlow (Lindholm, 2023; Naishadham et al., 2023). These two damaged plants alone resulted in tens of millions of dollars in repairs, and hundreds of thousands of gallons of untreated sewage entering state waterways (Lindholm, 2023; Naishadham et al., 2023; Figure 7-20).
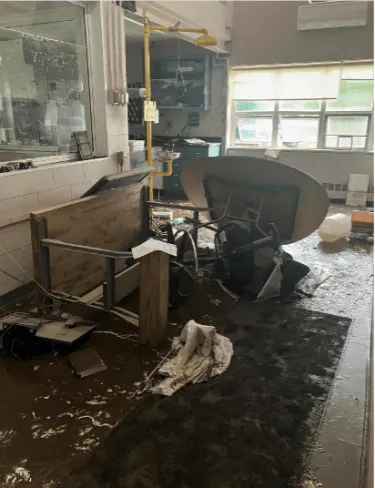
Source: VTANR (2023)
7.6 Dam overtopping risk
7.6.1 Impacts
Dam overtopping risk in Vermont has risen with increasing flood intensity. Following the July 2023 flooding in Vermont, five dams failed and 57 others overtopped (D’Auria, 2024). Dam overtopping can exacerbate the impacts of downstream flooding by causing floodwaters to arrive all at once rather than spread out over a normal flood pulse. Beyond increasing the magnitude of a flood, this can also put lives at greater risk due to the sudden nature of dam failure floods (FEMA, 2012).
As of October 2025, the U.S. Army Corps of Engineers rated 69 dams in Vermont as “high hazard”, meaning that if they were to fail or overtop, there would be significant danger to human lives (U.S. Army Corps of Engineers, 2025). Some dams that came close to overtopping in 2023 included dams which were built explicitly for flood control, such as the Wrightsville and Waterbury Reservoir dams; their failure would have caused catastrophic downstream damage to populated areas such as the village of Montpelier (Casey, 2024). High hazard dams are located across the state, with a higher concentration located in southern Vermont, particularly Windsor and Rutland counties (Figure 7-21).
Dams also fundamentally impact aquatic ecosystems. Most dams prevent aquatic organism passage, fragmenting aquatic species and disconnecting them from accessible habitat (Chan et al., 2025). Dams also impede sediment transport, which can both change the ecosystem upstream of the dam and increase erosion rates downstream, since less sediment travels from upstream to refill material that was removed during natural erosional processes downstream (The Nature Conservancy, 2023). As erosion rates are reflective of increased precipitation frequency and intensity (see 7.3.2 and Water Resources 4.5.4), impeded sediment transport from these dams has a greater impact on ecosystems as they are subject to various climate stressors.
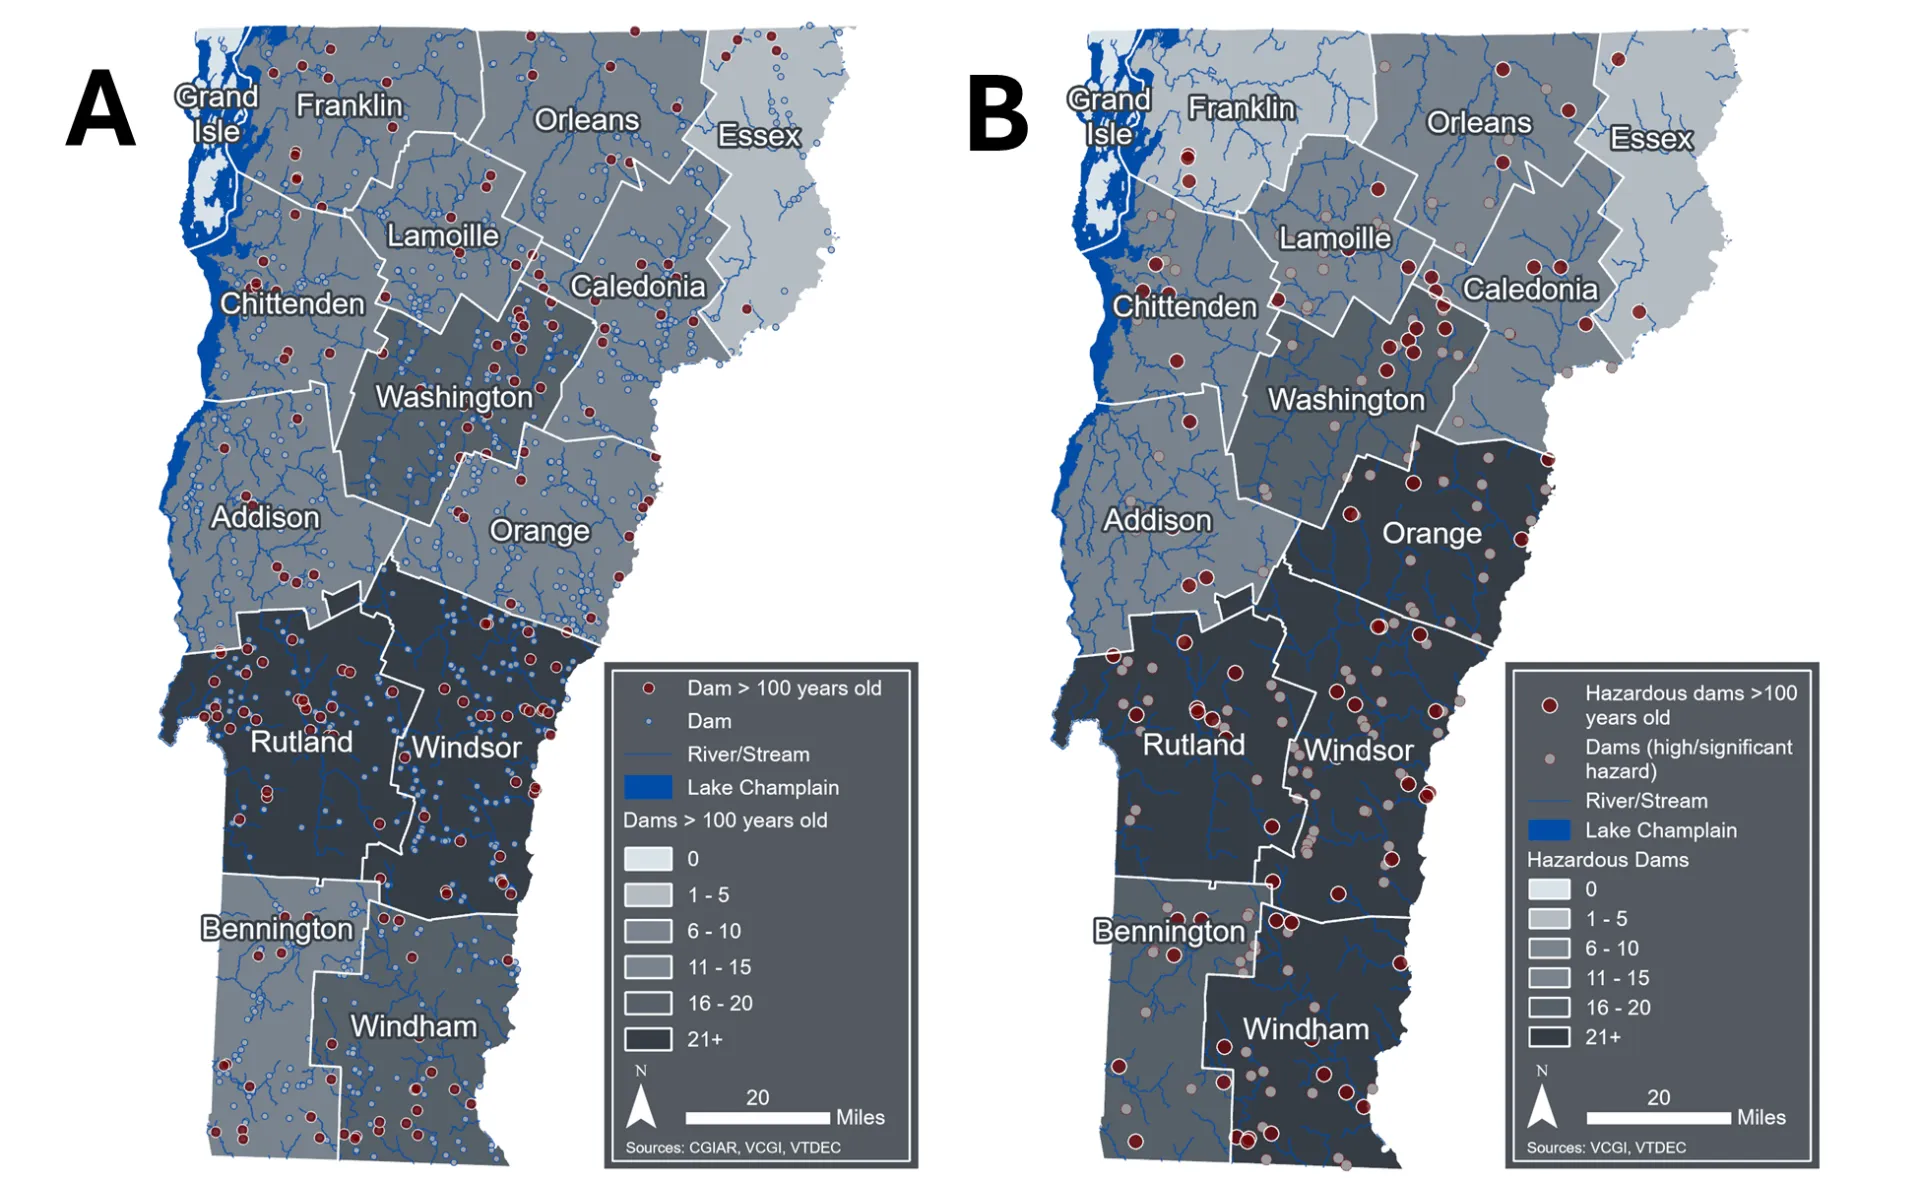
Sources: USGS (2023), VCGI (2025a), VTDEC (2022)
Note: Data visualization by Luke Briccetti and Hannah C. Turner
7.6.2 Contributing factors
Like most of New England, Vermont has a high number of older dams, originally meant for mills or textile manufacturing and constructed 100 or more years ago (VTANR, 2022). Vermont has, at minimum, 190 dams that were built 100 or more years ago, with a higher concentration in southern Vermont, particularly Rutland and Windsor counties (Figure 7-21). This number is likely an undercount as not all dams in Vermont have been inventoried, and of Vermont’s >1,000 inventoried dams, less than 50% have a listed year of construction (VTANR, 2022).
Additionally, many of Vermont’s dams are breached (e.g., partially failed; VTANR, 2022). These dams are often not maintained and therefore at an even higher risk of complete structural failure. Such dams also contribute to the impediment of sediment transport, but unlike maintained, in-use dams (e.g., those used for power generation, flood control, recreation), inactive dams exert this ecosystem-level impact for no discernible purpose. Of Vermont’s 1,084 known dams, 530 (or 48.89%) have no listed purpose (VTANR, 2022). Additionally, 174 of those dams are fully or partially breached, indicating that they are falling into disrepair.
7.6.3 Adaptation considerations
Dam removal is a key strategy for reducing the hazard risk and ecosystem-level impacts posed by dams, which is exacerbated by increased flood frequency and intensity under climate change. As of October 2025, Vermont has removed 80 dams, prioritizing inactive dams no longer serving a purpose. This is more than any other U.S. state per capita (Knapschaefer, 2025). These projects are complicated and expensive, often requiring many partners and funding sources (Free VT Rivers, 2025). Organizations have used FEMA disbursements following Tropical Storm Irene and the July 2023 flooding to complement existing funding sources to remove dams, reducing risk to properties downstream.
Two initiatives by the Vermont state legislature have significant implications for addressing hazardous dams: updates to the Dam Safety Rule (DSR; VTDEC, 2020) and the newly enacted Flood Safety Act (Flood Safety Act, 2024). Under the DSR, VTDEC has the discretion to inspect dams assessed to be above “minimal” hazard level at any time. The rule also mandated that the agency complete periodic dam inspections following an initial inspection (Table 7-1). The rule also asserts dam owner responsibility for further study or dam repair/removal, if the dam is determined to be unsafe.
Table 7-1 Dam inspection schedule in the DSR (2020)
Hazard Classification | Frequency |
|---|---|
High | 2 years |
Significant | 5 years |
Low | 10 years |
Minimal | None |
Note: The first inspection shall be performed when initiated or required by VTDEC and subsequent inspections shall be performed in compliance with the table above
The Flood Safety Act (2024) establishes new dam regulations. The bill expanded the state’s ability to compel dam owners to repair or remove dams for safety, while also enabling the state to regulate dams for water quality. Additionally, the act allows individual citizens to petition the state to initiate new inspections of dams on safety grounds, established a new fund for dam removal and repair grants, increased staffing in the dam safety department, and consolidated dam oversight into one department (VTDEC). Although the state is still in the implementation phase of some of these changes—for example, oversight consolidation is not required to be completed until 2028—the newly established fund for dam repairs and removals was allocated $3 million for dam mitigation projects in Vermont’s Fiscal Year 2024 budget (Vermont Legislature Joint Fiscal Office, 2024), but the implementation of these funds has yet to occur. These regulations have also increased institutional support from the state to deal with hazardous and aging dams; however, there is a capacity gap for some private and municipal landowners, who under these regulations have more responsibilities if their dams are deemed unsafe. It also remains to be seen whether increased staffing and funding to the dam safety program is enough to offset this gap.
Box 7-3: The cultural significance of dams – Swanton Village dam
Sociocultural attachment to active and inactive dams contributes to their presence and impacts in Vermont. For some, these dams provide recreation, aesthetic value, and/or represent a place’s cultural heritage (Fox et al., 2016; Guilfoos & Walsh, 2023; Magilligan et al., 2017; Parent et al., 2024). For others, dam removals may represent unwelcome government overreach (Fox et al., 2016; Magilligan et al., 2017). For example, the removal of the Swanton Village Dam on the Missisquoi River would have cascading positive impacts on fish passage and sediment transport, both of which are of increasing importance with a changing climate. Vermont Fish and Wildlife has supported removal of the Swanton Village Dam since at least 2008, as it would represent a significant habitat restoration opportunity and the dam has historically not been maintained to VTDEC standards (Davis, 2014). However, the dam has been protected by the village due to its historical and aesthetic value (Dobbs, 2016; Polhamus, 2016). The village explored using the dam for hydro power generation through two different developers, with the project finally being abandoned in March 2025 (McCallum, 2025). Environmental groups are willing to pay for the dam to be removed, but it remains unclear whether the village will allow removal to move forward despite being unable be use the dam for electricity generation. While momentum has accelerated for dam removals in recent years, it is also clear that these removals are currently a culturally complex process, which is a reality that project planners must contend with.
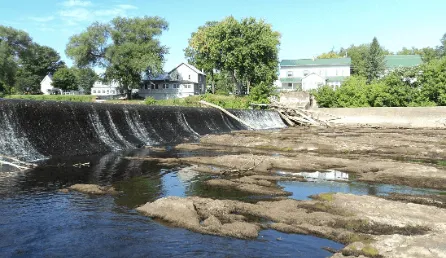
Source: Vermont Department of Fish & Wildlife (2015)
7.7 A note on transportation emissions
While Vermont’s total emissions contributions to global climate change are small, the state has some of the highest per capita emissions in the country. Reports on Vermont’s annual greenhouse gas (GHG) emissions (Climate Action Office, 2025), as well as goals to reduce emissions (Vermont Climate Council, 2025b) have both been produced in recent years and are the appropriate resources for readers interested in this topic.
The Vermont GHG Inventory evaluates emissions across a variety of sectors, including transportation networks and personal vehicle usage. Transportation is the largest source of GHG emissions in Vermont, making up 40.2% of the state's total as of 2022 (VTANR Climate Action Office, 2025; see Energy 8.3). This largely stems from personal vehicle usage; Vermont drivers have the highest average miles traveled per capita in the Northeast U.S. (Galford et al., 2021). On-road gas and diesel emissions make up 68% of total transportation emissions, with light-duty gasoline vehicles (e.g., cars, SUVs and small pickup trucks) being the largest contributor to this category (Table 7-2). Heavy-duty diesel vehicles are the second largest contributor to on-road emissions (e.g., trucks, tractors, and buses).
Table 7-2 Transportation emissions (MMTCO2e) for multiple sectors over time
Sector | 1990 | 2005 | 2010 | 2019 | 2020 | 2021 | 2022 |
|---|---|---|---|---|---|---|---|
Transportation/ mobile sources (MMTCO2e) | 3.48 | 4.33 | 3.67 | 3.50 | 3.02 | 3.24 | 3.22 |
Motor gasoline (onroad and nonroad; CO2) | 2.54 | 3.05 | 2.63 | 2.42 | 2.01 | 2.19 | 2.19 |
Diesel (onroad; CO2) | 0.41 | 0.70 | 0.63 | 0.65 | 0.61 | 0.66 | 0.64 |
Diesel (nonroad; CO2) | 0.31 | 0.33 | 0.25 | 0.30 | 0.29 | 0.26 | 0.26 |
Jet fuel and aviation gasoline (CO2) | 0.08 | 0.13 | 0.07 | 0.07 | 0.06 | 0.09 | 0.09 |
Other sources (CO2, CH4, N2O) | 0.14 | 0.13 | 0.09 | 0.06 | 0.05 | 0.05 | 0.04 |
Ethanol (biogenic CO2)* | 0.00 | 0.01 | 0.17 | 0.17 | 0.14 | 0.16 | 0.16 |
Biodiesel (biogenic CO2)* | 0.00 | 0.00 | 0.00 | 0.02 | 0.02 | 0.02 | 0.02 |
Source: Climate Action Office (2025)
Note: *Biogenic totals are not included in gross total estimates
The VCAP identifies vehicle GHG emissions reductions as a key priority recommendation (Vermont Climate Council, 2025a). Vehicle emissions reduction strategies include maintaining Vermont’s adoption of the Advanced Clean Cars II and Advanced Clean Trucks compliance requirements, which were paused following Executive Order 04-25, that aim to gradually increase sales of zero emission vehicles to 100% by 2035 (Alternative Fuels Data Center, 2026; Vermont Department of Environmental Conservation, 2026). Additional priority recommendations include defending states’ authority laid out in Section 177 of the Clean Air Act, ensuring consistent electric vehicle (EV) incentive funding for low- and moderate-income vehicle purchasers, and supporting investments for the equitable distribution of fast EV charging. The VCAP also aims to invest in public, multimodal transportation to reduce the need for single occupancy vehicles.
Vermont is actively working to address transportation emissions, from implementing personal vehicle incentives to investing in pedestrian/bicycle infrastructure and modernizing freight planning (Cambridge Systematics, Inc., 2023; Department of Transportation, 2021), but there are additional opportunities for infrastructure planning improvements. As the state aims to increase the rate of housing construction, supporting mixed use neighborhood zoning and reducing sprawl may help address housing mismatch and vehicle needs for commuting.
7.8 Traceable accounts
7.10 References
Ahmad, T., & Khawaja, H. (2018). Review of Low-Temperature Crack (LTC) Developments in Asphalt Pavements. International Journal of Multiphysics, 12, 169–187. https://www.themultiphysicsjournal.com/index.php/ijm/article/view/12-2-169/334
American Society of Civil Engineers. (2025). Report Card for America’s Infrastructure—Energy. https://infrastructurereportcard.org/cat-item/energy-infrastructure/
American Society of Civil Engineers, & Federal Emergency Management Agency. (2022). Wet Floodproofing Requirements and Limitations. In Flood Resistant Design and Construction. American Society of Civil Engineers. https://doi.org/10.1061/9780784413791
Anderson, I. (2018). Improving Detection And Prediction Of Bridge Scour Damage And Vulnerability Under Extreme Flood Events Using Geomorphic And Watershed Data [PhD Dissertation, University of Vermont]. https://scholarworks.uvm.edu/graddis/823
Auld, H., Klaassen, J., & Comer, N. (2007). Weathering of Building Infrastructure and the Changing Climate: Adaptation Options. 2006 IEEE EIC Climate Change Conference, 1–11. https://doi.org/10.1109/EICCCC.2006.277247
Baker, D., Hamshaw, S. D., & Hamshaw, K. A. (2014). Rapid Flood Exposure Assessment of Vermont Mobile Home Parks Following Tropical Storm Irene. Natural Hazards Review, 15(1), 27–37. https://doi.org/10.1061/(ASCE)NH.1527-6996.0000112
Banacos, P. (2023, August 5). The Great Vermont Flood of 10-11 July 2023: Preliminary Meteorological Summary. NOAA’s National Weather Service. Weather.Gov. https://www.weather.gov/btv/The-Great-Vermont-Flood-of-10-11-July-2023-Preliminary-Meteorological-Summary
Bartos, M., Chester, M., Johnson, N., Gorman, B., Eisenberg, D., Linkov, I., & Bates, M. (2016). Impacts of rising air temperatures on electric transmission ampacity and peak electricity load in the United States. Environmental Research Letters, 11(11), 114008. https://doi.org/10.1088/1748-9326/11/11/114008
Bedrich, K. (2026). After the Flood—Your Natural Gas Appliances. NaturalGasPlans. https://naturalgasplans.com/flood-natural-gas-appliances/
Berlin, C., Cotton, E., Crowley, P., & Guha, A. (2023, December 19). ‘Here we are, again’: Flooding reports from around Vermont. VTDigger. https://vtdigger.org/2023/12/19/here-we-are-again-flooding-reports-from-around-vermont/
Biron, P. M., Gauthier, J., Dubé, M., Buffin-Bélanger, T., & Boivin, M. (2025). Beaver dam failures: Reconciling science, perception and policy for sustainable river management in Quebec (Canada). Earth Surface Processes and Landforms, 50(14), e70199. https://doi.org/10.1002/esp.70199
Briccetti, L. (2023). Forests, Roads and Streams: Riparian Forest Management in the Lake Champlain Basin [M.S. Natural Resources & Ecology, SUNY Plattsburgh]. https://soar.suny.edu/entities/publication/e6184751-783b-4a0a-a85c-5b9f182f3b59
Briccetti, L. (2025). Assessing the Management and Impact of Private Road Crossings in the Lake Champlain Basin (Technical Report No. 108; p. 36). Lake Champlain Basin Program. https://www.lcbp.org/publications/assessing-the-management-and-impact-of-private-road-crossings-in-the-lake-champlain-basin/
Brown, T. (2019, May 25). Montpelier Looks at Ways to Ease Pothole Plague. The Bridge. https://thebridgevt.org/2019/05/montpelier-looks-at-ways-to-ease-pothole-plague/
Burchsted, D., Daniels, M., Thorson, R., & Vokoun, J. (2010). The River Discontinuum: Applying Beaver Modifications to Baseline Conditions for Restoration of Forested Headwaters. BioScience, 60(11), 908–922. https://doi.org/10.1525/bio.2010.60.11.7
Bushey, K. S. (2025, June). Multifamily Passive House Certification: A New Reach Standard for Vermont? Efficiency Vermont. https://www.efficiencyvermont.com/Media/Default/docs/white-papers/2024_multifamily_passive_house_certification_reach_standard_f…
Cambridge Systematics, Inc. (2023, November). Vermont Transportation Carbon Reduction Strategy. https://vtrans.vermont.gov/sites/aot/files/climate/VTrans%20Carbon%20Reduction%20Strategy%20Final.pdf
Chan, J. C. F., Lam, B. Y. K., Dudgeon, D., & Liew, J. H. (2025). Global consequences of dam-induced river fragmentation on diadromous migrants: A systematic review and meta-analysis. Biological Reviews, 100(5), 2020–2037. https://doi.org/10.1111/brv.70032
Chen, S., Zhang, X., Lin, J., Huang, J., Zhao, D., Yuan, T., Huang, K., Luo, Y., Jia, Z., Zang, Z., Qiu, Y., & Xie, L. (2019). Fugitive Road Dust PM2.5 Emissions and Their Potential Health Impacts. Environmental Science & Technology, 53(14), 8455–8465. https://doi.org/10.1021/acs.est.9b00666
Climate Action Office. (2025). Greenhouse Gas Inventory. https://climatechange.vermont.gov/climateactionoffice/greenhouse-gas-inventory
Cocchiglia, L., Purcell, P. J., & Kelly-Quinn, M. (2012). A Critical Review of the Effects of Motorway River-Crossing Construction on the Aquatic Environment. Freshwater Reviews, 5(2), 141–168. https://doi.org/10.1608/FRJ-5.2.489
Daniel, J. S., Jacobs, J. M., Douglas, E., Mallick, R. B., & Hayhoe, K. (2014). Impact of Climate Change on Pavement Performance: Preliminary Lessons Learned through the Infrastructure and Climate Network (ICNet). Climatic Effects on Pavement and Geotechnical Infrastructure, 1–9. https://doi.org/10.1061/9780784413326.001
Daniel, J. S., Jacobs, J. M., Miller, H., Stoner, A., Crowley, J., Khalkhali, M., & Thomas, A. (2018). Climate change: Potential impacts on frost–thaw conditions and seasonal load restriction timing for low-volume roadways. Road Materials and Pavement Design, 19(5), 1126–1146. https://doi.org/10.1080/14680629.2017.1302355
D’Auria, P. (2024, July 1). Last year’s flooding caused ‘close calls’ for Vermont dams. Officials are trying to make sure it doesn’t happen again. VTDigger. https://vtdigger.org/2024/07/01/last-years-flooding-caused-close-calls-for-vermont-dams-officials-are-trying-to-make-sure-it-do…
Davis, M. (2014, August 13). A Fish Story: The Battle to Remove Swanton Dam. Seven Days. https://www.sevendaysvt.com/news/a-fish-story-the-battle-to-remove-swanton-dam-2416813/
DeAndrea, P. (2024, May). Public Paved and Dirt Roads—Statewide Totals, Years 2006-2024. Vermont Agency of Transportation. https://vtransmaps.vermont.gov/Maps/Publications/Surface_Totals_2006_2024.pdf
Dieter, C., & Linsey, K. (2017). Estimated Use of Water in the United States County-Level Data for 2015 [Dataset]. U.S. Geological Survey. https://doi.org/10.5066/F7TB15V5
Dobbs, T. (2016, July 13). Swanton Plans Dam Renovation As Environmentalists Call For Demolition. Vermont Public. https://www.vermontpublic.org/vpr-news/2016-07-13/swanton-plans-dam-renovation-as-environmentalists-call-for-demolition
Doyle, J. (2018, February 25). Frost heaves are nature’s speed bumps. Foster’s Daily Democrat. https://www.fosters.com/story/news/2018/02/25/frost-heaves-are-natures-speed-bumps/14127709007/
Dumarevskaya, L., & Parent, J. R. (2023). Electric grid resilience: The effects of conductor coverings, enhanced tree trimming, and line characteristics on tree-related power outages. Electric Power Systems Research, 221, 109454. https://doi.org/10.1016/j.epsr.2023.109454
Elshaer, M., & Decarlo, C. (2021). Evaluating the Performance Benefits for Low-Volume Roadways Constructed with Geosynthetic Wicking Fabrics: A Case Study in Northern New England. In Advances in Transportation Geotechnics IV (Vol. 166, pp. 843–855). https://doi.org/10.1007/978-3-030-77238-3_64
Fairfax, M. (2025, August 4). When floods hit Vermont’s iconic dirt roads, runoff hits waterways. Vermont Public. https://www.vermontpublic.org/local-news/2025-08-04/when-floods-hit-vermonts-iconic-dirt-roads-runoff-hits-waterways
Fant, C., Boehlert, B., Strzepek, K., Larsen, P., White, A., Gulati, S., Li, Y., & Martinich, J. (2020). Climate change impacts and costs to U.S. electricity transmission and distribution infrastructure. Energy, 195, 116899. https://doi.org/10.1016/j.energy.2020.116899
Fasel, M. (2025). Flooded and Failing: What Happens to Plumbing, HVAC and Gas Systems? Building Safety Journal. https://www.iccsafe.org/building-safety-journal/bsj-technical/flooded-and-failing-what-happens-to-plumbing-hvac-and-gas-systems/
Federal Emergency Management Agency. (2012, April). Living with Dams: Know your Risks. Association of State Dam Safety Officials. https://damsafety.org/sites/default/files/ASDSO-LivingWithDams-Know%20Your%20Risk-NO%201_ASDSO-WEB.pdf
Federal Emergency Management Agency. (2014). Homeowner’s Guide to Retrofitting (3rd ed.). https://www.fema.gov/sites/default/files/2020-07/fema_homeowners-guide-to-retrofitting_guide.pdf
Federal Emergency Management Agency. (2022, March). 4.3: Electric Power Generation, Transmission and Distribution [Fact Sheet]. https://www.fema.gov/sites/default/files/documents/fema_p-2181-fact-sheet-4-3-electric-power.pdf
Federal Emergency Management Agency. (2024). FEMA Flood Map Service center: Search by Address [Dataset]. https://msc.fema.gov/portal/search
Field Geology Services. (2007). Fluvial Geomorphology Assessment of the Mad River Watershed, Vermont (p. 85). Central Vermont Regional Planning Commission. https://centralvtplanning.org/wp-content/uploads/2021/09/MadRiver_P1P2SGA_FGS.pdf
Fitch, J., & Tremblay, J., P. (2015). Cold In-Place Recycled Bituminous Pavement. https://resources.vtrans.vermont.gov/documents/archivedresearch/2015%20-%2004%20Cold%20In-Place%20Recycled%20Bituminous%20Pavem…
Flood Safety Act, 121 § 213 (2024). https://floodready.vermont.gov/flood-safety-act
Fox, C. A., Magilligan, F. J., & Sneddon, C. S. (2016). “You kill the dam, you are killing a part of me”: Dam removal and the environmental politics of river restoration. Geoforum, 70, 93–104. https://doi.org/10.1016/j.geoforum.2016.02.013
Franklin Regional Council of Governments. (2001, September). Answers to Frequently Asked Questions about Gravel Roads. https://frcog.org/wp-content/uploads/2014/04/Answers-to-Frequently-Asked-Questions-about-Gravel-Roads.pdf
Free VT Rivers. (2025). Recent Projects. Vermont Natural Resources Council. Free VT Rivers. https://freevermontrivers.org/projects/
Galford, G. L., Faulkner, J., Dupigny-Giroux, L.-A., Posner, S., & Edling, L. (Eds.). (2021). The Vermont Climate Assessment 2020 (No. 2; p. 524). Gund Institute of Environment, University of Vermont. https://site.uvm.edu/vtclimateassessment/files/2022/08/VCA-entire-8-3-22-web.pdf
Giles, A. (2025, March 19). Can AI predict where climate change will disrupt the power grid? This Vermont utility thinks so. Vermont Public. https://www.vermontpublic.org/local-news/2025-03-19/can-ai-predict-where-climate-change-disrupt-power-grid-vermont-utility-thin…
Gillespie, N., Unthank, A., Campbell, L., Anderson, P., Gubernick, R., Weinhold, M., Cenderelli, D., Austin, B., McKinley, D., Wells, S., Rowan, J., Orvis, C., Hudy, M., Bowden, A., Singler, A., Fretz, E., Levine, J., & Kirn, R. (2014). Flood Effects on Road–Stream Crossing Infrastructure: Economic and Ecological Benefits of Stream Simulation Designs. Fisheries, 39(2), 62–76. https://doi.org/10.1080/03632415.2013.874527
Goff, J., & Banacos, P. (2024, October 9). Extreme Nocturnal Rainfall and Flash Flooding in Vermont’s Northeast Kingdom: 30 July 2024. NOAA’s National Weather Service. Weather.Gov. https://www.weather.gov/btv/Extreme-Nocturnal-Rainfall-and-Flash-Flooding-in-Vermonts-Northeast-Kingdom-30-July-2024?utm_source…
Gourevitch, J. D., Diehl, R. M., Wemple, B. C., & Ricketts, T. H. (2022). Inequities in the distribution of flood risk under floodplain restoration and climate change scenarios. People and Nature, 4(2), 415–427. https://doi.org/10.1002/pan3.10290
Graham, C., & Fitch, J. (2007). Cold Recycled Bituminous Pavement. State of Vermont Agency of Transportation. https://resources.vtrans.vermont.gov/documents/archivedresearch/2007%20-%2002%20(OCR)%20Cold%20Recycled%20Bituminous%20Pavement…
Green Mountain Power. (2022). VT Green Mountain Power Pole Data [Dataset]. VT Center for Geographic Information. https://geodata.vermont.gov/datasets/VCGI::vt-green-mountain-power-pole-data/about
Green Mountain Power. (2023, October 10). Green Mountain Power Launches First in Nation 2030 Zero Outages Initiative. Green Mountain Power. https://greenmountainpower.com/news/green-mountain-power-launches-first-in-nation-2030-zero-outages-initiative/
Green Mountain Power. (2025). VT Green Mountain Power Line Data [Dataset]. VT Center for Geographic Information. https://geodata.vermont.gov/datasets/VCGI::vt-green-mountain-power-line-data-1/about
Gudipudi, P. P., Underwood, B. S., & Zalghout, A. (2017). Impact of climate change on pavement structural performance in the United States. Transportation Research Part D: Transport and Environment, 57, 172–184. https://doi.org/10.1016/j.trd.2017.09.022
Guilfoos, T., & Walsh, J. (2023). A hedonic study of New England dam removals. Ecological Economics, 203, 107624. https://doi.org/10.1016/j.ecolecon.2022.107624
Hillman, G. R. (1998). Flood wave attenuation by a wetland following a beaver dam failure on a second order boreal stream. Wetlands, 18(1), 21–34. https://doi.org/10.1007/BF03161439
Jonker, S. A., Muth, R. M., Organ, J. F., Zwick, R. R., & Siemer, W. F. (2006). Experiences with Beaver Damage and Attitudes of Massachusetts Residents Toward Beaver. Wildlife Society Bulletin, 34(4), 1009–1021. https://doi.org/10.2193/0091-7648(2006)34%5B1009:EWBDAA%5D2.0.CO;2
Katz, H. A., Daniels, J. M., & Ryan, S. (2014). Slope‐area thresholds of road‐induced gully erosion and consequent hillslope–channel interactions. Earth Surface Processes and Landforms, 39(3), 285–295. https://doi.org/10.1002/esp.3443
Knapschaefer, J. (2023, August 11). Vermont Contractors Tackle Flood-Damaged Infrastructure | Engineering News-Record. Engineering News-Record. https://www.enr.com/articles/56932-vermont-contractors-tackle-flood-damaged-infrastructure
Knapschaefer, J. (2025, October 16). Vermont Dam Removal Program Reclaims Floodplain. Engineering News-Record. https://www.enr.com/articles/61633-vermont-dam-removal-program-reclaims-floodplain
Krupp, L. (2024, July 16). Dozens of homes remain without water or under boil notice in Plainfield and Barnet. Vermont Public. https://www.vermontpublic.org/local-news/2024-07-16/dozens-remain-without-water-boil-notice-plainfield-barnet-flood
Łaciak, M., Włodek, T., Kozakiewicz, T., & Liszka, K. (2020). Impact of flood water on the technical condition of natural gas transmission pipeline valves. Journal of Loss Prevention in the Process Industries, 63, 103998. https://doi.org/10.1016/j.jlp.2019.103998
Lake Champlain Basin Program. (2024). 2024 Lake Champlain State of the Lake and Ecosystem Indicators Report (p. 40). https://www.lcbp.org/wp-content/uploads/2024/06/2024-State-of-the-Lake-Report.pdf
Laurynas, J. (2022). Investigation of the Influence of Subgrade’s Stabilization on the Decrease of Bearing Capacity of the Road Pavement Structure during the Spring Thaw Period. https://gs.elaba.lt/object/elaba:116673621/
Lawrence Berkeley National Laboratory. (2024). Undergrounding Transmission and Distribution Lines: Resilience Investment Guide. US Department of Energy - Grid Deployment Office. https://www.energy.gov/sites/default/files/2024-11/111524_Undergrounding_Transmission_and_Distribution_Lines.pdf
Lehrter, R. J., Rutherford, T. K., Dunham, J. B., Johnston, A. N., Wood, D. J. A., Haby, T. S., & Carter, S. K. (2024). Effects of culverts on habitat connectivity in streams—A science synthesis to inform National Environmental Policy Act analyses. In Scientific Investigations Report (Nos. 2023–5132). U.S. Geological Survey. https://doi.org/10.3133/sir20235132
Lindholm, J. (2023, July 14). Johnson’s wastewater facility completely destroyed. Vermont Public. https://www.vermontpublic.org/local-news/2023-07-14/johnsons-wastewater-facility-completely-destroyed
Magilligan, F. J., Sneddon, C. S., & Fox, C. A. (2017). The Social, Historical, and Institutional Contingencies of Dam Removal. Environmental Management, 59(6), 982–994. https://doi.org/10.1007/s00267-017-0835-2
Massachusetts Department of Fish and Game: Division of Ecological Restoration. (2018, May). Massachusetts Stream Crossings Handbook. Massachusetts Department of Fish and Game. https://www.mass.gov/files/documents/2018/08/23/Stream%20Crossings%20booklet%20Web.pdf
McArdle, P. (2015, March 15). Frost heaves aren’t too bad; yet. Rutland Herald. https://www.rutlandherald.com/news/frost-heaves-aren-146-t-too-bad-151-yet/article_1193cd20-ab34-5823-b84d-546972360d42.html
McCallum, K. (2025, December 17). Environmentalists Want to Remove Swanton Dam to Free the Fish. Seven Days. https://www.sevendaysvt.com/news/environment-news/environmentalists-want-to-remove-swanton-dam-to-free-the-fish/
McDonald, Z., & Wilson, N. (2024, March 4). President Biden declares Vermont’s December floods a major disaster, grants access to federal aid. Vermont Public. https://www.vermontpublic.org/local-news/2024-03-04/president-biden-declares-vermonts-december-floods-a-major-disaster-grants-a…
Merschman, E., Salman, A. M., Bastidas-Arteaga, E., & Li, Y. (2020). Assessment of the effectiveness of wood pole repair using FRP considering the impact of climate change on decay and hurricane risk. Advances in Climate Change Research, Special Issue on Climate Change for Coastal Areas: Risks, Adaptation and Acceptability, 11(4), 332–348. https://doi.org/10.1016/j.accre.2020.10.001
Midwest Research Institute (MRI). (1998). Emission Factor Documentation for AP-42 Section 13.2.2: Unpaved Roads—Final Report (MRI Project No. 4864). U. S. Environmental Protection Agency Office of Air Quality Planning and Standards. https://nepis.epa.gov/Exe/ZyPDF.cgi/P100RH7T.PDF?Dockey=P100RH7T.PDF
Mingle, J. (2025, January 28). In Vermont, a Push to Prevent Flooding or Get Out of the Way. Yale E360. https://e360.yale.edu/features/vermont-floods
Naishadham, S., Peterson, B., Fassett, C., & Press, A. (2023, August 10). Rising flood risks threaten many water and sewage treatment plants across the US. Vermont Public. https://www.vermontpublic.org/local-news/2023-08-10/ludlow-vermont-rising-flood-risks-threaten-many-water-and-sewage-treatment-…
Northwest Regional Planning Commission. (2025). Private Road Erosion Inventory Program. NRPC. https://www.nrpcvt.com/services-programs/transportation-planning/private-road-erosion-inventory-program/
Okemo Valley TV. (2025, April 24). Cavendish Culvert Crawlers [Video recording]. Okemo Valley TV. https://okemovalley.tv/cavendish-culvert-crawlers
Parent, J. R., Gold, A. J., Vogler, E., & Lowder, K. A. (2024). Guiding decisions on the future of dams: A GIS database characterizing ecological and social considerations of Dam decisions. Journal of Environmental Management, 351, 119683. https://doi.org/10.1016/j.jenvman.2023.119683
Perillo, V. L., Ross, D. S., Wemple, B. C., Balling, C., & Lemieux, L. E. (2019). Stream Corridor Soil Phosphorus Availability in a Forested–Agricultural Mixed Land Use Watershed. Journal of Environmental Quality, 48(3), 783–785. https://doi.org/10.2134/jeq2018.05.0186er
Phillipson, M. C., Emmanuel, R., & Baker, P. H. (2016). The durability of building materials under a changing climate. WIREs Climate Change, 7(4), 590–599. https://doi.org/10.1002/wcc.398
Polhamus, M. (2016, July 18). State frustrated with Swanton’s inaction on leaky dam. VTDigger. https://vtdigger.org/2016/07/18/state-frustrated-with-villages-inaction-on-leaky-dam/
Polhamus, M. (2017, July 14). State regulators investigate Vermont Gas pipeline burial depth. VTDigger. https://vtdigger.org/2017/07/14/state-regulators-investigate-vermont-gas-pipeline-burial-depth/
Preservation Trust of Vermont, & Vermont State Historic Prevention Office. (2021, May). Energy Conserving Features Inherent to Older Buildings [White Paper]. Vermont Agency of Commerce and Community Development. https://outside.vermont.gov/agency/ACCD/ACCD_Web_Docs/HP/Planning_For_Preservation/Energy_Conserving_Features.pdf?_gl=1*6urzht*…..
Raffaniello, A., Bauer, M., Safiuddin, M., & El-Hakim, M. (2022). Traffic and Climate Impacts on Rutting and Thermal Cracking in Flexible and Composite Pavements. Infrastructures, 7(8), 100. https://doi.org/10.3390/infrastructures7080100
Reister, C. (2018). Effects of Beaver Dam-Break Floods on Downstream Channels in King County, Washington [M.S. Applied Geosciences, University of Washington]. https://digital.lib.washington.edu/researchworks/items/614cf3d4-7d73-46f3-8aec-e73801868031/full
Remmers, B., Pierce, D., & Yandow, M. (2023). Identifying and Fixing Erosion Issues on Private and Park Roads in the Lake Carmi Watershed (Nos. 0346-002–001; p. 18). Lake Champlain Basin Program. https://neiwpcc.org/wp-content/uploads/2023/10/LS-2020-056-Erosion_Lake-Carmi-Watershed.pdf
Rhodes, C. (2023). Flood Damage Costs Beyond Buildings—A Lake Champlain Case Study (Fact Sheet) [Fact Sheet]. U.S. Geological Survey. https://doi.org/10.3133/fs20233034
Scamardo, J. E., Marshall, S., & Wohl, E. (2022). Estimating widespread beaver dam loss: Habitat decline and surface storage loss at a regional scale. Ecosphere, 13(3). https://doi.org/10.1002/ecs2.3962
Scott, P. (2024, February 14). Request For Major Disaster Declaration—Governor’s Request Cover Letter [Cover Letter]. https://governor.vermont.gov/sites/scott/files/documents/Disaster%20Request%20-%202.14.24.pdf
Sias, J. E., Dave, E. V., Underwood, B. S., Bowers, B. F., Harvey, J. T., Henning, T. F. P., Tighe, S. L., Jacobs, J. M., Pregnolato, M., Qiao, Y., Mecray, E., Golalipour, A., Chamorro, A., & Hendrick, P. (2025). Climate change impacts on roadways. Nature Reviews Earth & Environment, 6(9), 555–573. https://doi.org/10.1038/s43017-025-00711-9
Smith, S. A. (2024). Community Resilience and Disaster Mitigation Grant Program. https://legislature.vermont.gov/assets/Legislative-Reports/2024-Community-Resilience-and-Disaster-Mitigation-Grant-Program-Legi…
Soares, R., A. Balerna, J., Quainoo, R., C. Merrill, S., Ali-Khan, M., Shrum, T. R., & Koliba, C. J. (2025). “The Great Vermont Floods of 2023”: A Risk and Crisis Communication Assessment. Society & Natural Resources, 0(0), 1–23. https://doi.org/10.1080/08941920.2025.2553353
State of Vermont. (2026a). Community Reports | Flood Ready. https://floodready.vermont.gov/assessment/community_reports#Expanded
State of Vermont. (2026b). River Corridors—Frequently Asked Questions. State of Vermont Flood Ready. https://floodready.vermont.gov/RCFAQ
State of Vermont. (2026c). The Flood Safety Act. https://floodready.vermont.gov/flood-safety-act
State of Vermont. (2026d). Vermont Flood Disclosure Forms. https://floodready.vermont.gov/disclosure
The Nature Conservancy. (2023). How many dams are there in Vermont and who owns them? https://www.nature.org/content/dam/tnc/nature/en/documents/VermontDam.pdf
The Vermont Association of Planning and Development Agencies. (2025). Vermont Culvert and Bridge Inventory Status [Dataset]. https://vapda.maps.arcgis.com/apps/dashboards/867c764a9a324fd2a1bba98d2edc7e18
The White House. (2022, November). President Biden’s Bipartisan Infrastructure Law is Delivering in Vermont [Factsheet]. https://bidenwhitehouse.archives.gov/wp-content/uploads/2023/02/Vermont-Fact-Sheet-E3.pdf
Thompson, S., Vehkaoja, M., Pellikka, J., & Nummi, P. (2021). Ecosystem services provided by beavers Castor spp. Mammal Review, 51(1), 25–39. https://doi.org/10.1111/mam.12220
Underwood, B. S., Guido, Z., Gudipudi, P., & Feinberg, Y. (2017). Increased costs to US pavement infrastructure from future temperature rise. Nature Climate Change, 7(10), 704–707. https://doi.org/10.1038/nclimate3390
U.S. Army Corps of Engineers. (2025). National Inventory of Dams [Dataset]. https://nid.sec.usace.army.mil/nid/#/dams/search/sy=@stateKey:VT%20@hazardId:(4)&viewType=map&resultsType=dams&advanced=false&h…
U.S. Department of Energy. (2021, March). State of Vermont—Energy Sector Risk Profile. https://www.energy.gov/sites/default/files/2021-09/Vermont%20Energy%20Sector%20Risk%20Profile.pdf
U.S. Department of Energy. (2026). Zero Emission Vehicle (ZEV) Sales Requirements and Low Emission Vehicle Standards. Alternative Fuels Data Center. https://afdc.energy.gov/laws/6506
U.S. Energy Information Administration. (2024, December 19). State Profile and Energy Estimates—Profile Analysis. https://www.eia.gov/state/analysis.php?sid=VT
U.S. Energy Information Administration. (2025). Natural Gas Interstate and Intrastate Pipelines—Data [Dataset]. https://www.arcgis.com/home/item.html?id=9833ca6c8103490b8ad145a30f0522ee&sublayer=0#data
U.S. Geological Survey. (2023). Access National Hydrography Products [Dataset]. https://www.usgs.gov/national-hydrography/access-national-hydrography-products
USGCRP. (2023). Fifth National Climate Assessment (No. 5th). U.S. Global Change Research Program. https://nca5.climate.us/downloads/NCA5_2023_FullReport.pdf
Van Hoesen, J., & Letendre, S. (2013). Characterizing the Spatiotemporal Evolution of Building-Stock Age in Poultney, Vermont: A GIS-Based Approach to Improve Thermal Efficiency in Historical Buildings. Environment and Planning B: Urban Analytics and City Science, 40(4). https://journals.sagepub.com/doi/10.1068/b38085
Vermont Agency of Administration. (2023, October 23). Match estimate for the Summer 2023 Floods. https://legislature.vermont.gov/Documents/2024/WorkGroups/Senate%20Finance/July%20Floods/W~Doug%20Farnham~July%20Flood%20-%20Ma…
Vermont Agency of Administration. (2025). Municipal Energy Resilience Program. Agency of Administration - Buildings and General Services. https://bgs.vermont.gov/municipal-energy-resilience-program
Vermont Agency of Natural Resources. (2022). Waste Water Facilities [Dataset]. VT Center for Geographic Information. https://geodata.vermont.gov/datasets/VTANR::waste-water-facilities/about
Vermont Agency of Natural Resources. (2023). Stream Crossings. Vermont Open Geodata Portal. https://geodata.vermont.gov/datasets/VTANR::stream-crossings/about
Vermont Agency of Natural Resources. (2024). Vermont ANR - Natural Resources Atlas. https://anrmaps.vermont.gov/websites/anra5/
Vermont Agency of Natural Resources. (2025, August 1). MRGP Mobile Map—Overview. ArcGIS Online. https://www.arcgis.com/home/item.html?id=fe11c5ffd0d04eeca968115d84dacf90
Vermont Agency of Natural Resources. (2026). Expanded Community Report for Montpelier. https://anrweb.vermont.gov/DEC/FoFReports/SSRSReportViewer.aspx?RepName=ExpandedCommunityReport&Municipality=Montpelier
Vermont Agency of Transportation. (2021, December). Vermont Freight Plan. https://www.transportation.gov/sites/dot.gov/files/2023-12/VT_Freight_Plan_FINAL.pdf
Vermont Agency of Transportation. (2023, January 24). General Special Provisions—Version Number GSP-1817. https://outside.vermont.gov/agency/VTRANS/external/docs/construction/02ConstrServ/PreContract/2018SpecBook/2023-01-24%20-%20201…
Vermont Agency of Transportation. (2026). Transportation Resilience Planning Tool. https://roadfloodresilience.vermont.gov/?_gl=1*yvruxg*_ga*MTgwNDY5Mzc1LjE3NzAxNTE0MTc.*_ga_V9WQH77KLW*czE3NzE0NTA3MjUkbzUkZzEkd…
Vermont Center for Geographic Information. (2022). VT Data—Downloadable Topographically Defined Floodplains—Lake Champlain Basin (probHAND 2022) [Dataset]. https://geodata.vermont.gov/documents/f5a54fbd76114fbb99cf17a0a018ecf6/explore
Vermont Center for Geographic Information. (2025a). Telecommunications & Connectivity [Dataset]. https://geodata.vermont.gov/pages/d461884f23d94bb9a8540d8295afd623
Vermont Center for Geographic Information. (2025b). VT Data—County Boundaries [Dataset]. VT Center for Geographic Information. https://geodata.vermont.gov/?_gl=1*oz1uo3*_ga*MTIyMzY3Mjk3OS4xNzgyNzcwMTQw*_ga_V9WQH77KLW*czE3ODI3NzAxNDAkbzEkZzAkdDE3ODI3NzAxN…
Vermont Center for Geographic Information. (2025c). VT Data—Town Boundaries [Dataset]. VT Center for Geographic Information. https://geodata.vermont.gov/datasets/VCGI::vt-data-town-boundaries-1/about
Vermont Clean Water Act, H.35, Act 64 (2015).
Vermont Climate Council. (2025a). Climate Action Plan 2025 Recommended Priority Actions (p. 10). https://outside.vermont.gov/agency/anr/climatecouncil/Shared%20Documents/Vermont_Climate_Council/CAP2025_RecommendedPriorityAct…
Vermont Climate Council. (2025b). Vermont Climate Action Plan 2025. https://outside.vermont.gov/agency/anr/climatecouncil/Shared%20Documents/VermontClimateActionPlan2025.pdf?_gl=1*r9dtnm*_ga*MTM4…
Vermont Department of Environmental Conservation. (2017, March 10). Environmental Protection Rule—Vermont Stream Alteration Rule. State of Vermont. https://dec.vermont.gov/sites/dec/files/documents/wsmd_StreamAlterationRule_2017-03-10.pdf
Vermont Department of Environmental Conservation. (2020, August). Vermont Environmental Protection Rules—Vermont Dam Safety Rule. State of Vermont. https://dec.vermont.gov/water-investment/dam-safety/dam-safety-statute-and-rules
Vermont Department of Environmental Conservation. (2022). Dams [Dataset]. Vermont Center for Geographic Information. https://geodata.vermont.gov/datasets/VTANR::dams/about
Vermont Department of Environmental Conservation. (2023, January 26). General Permit 3-9040 for Stormwater Discharges from Municipal Roads. State of Vermont. https://dec.vermont.gov/watershed/stormwater/contacts/permit-information-applications-and-fees/municipal-roads-program
Vermont Department of Environmental Conservation. (2025). VT Water Infrastructure [Dataset]. VT Center for Geographic Information. https://geodata.vermont.gov/maps/01210da4457d42a1bbcc43f7e54cbad6
Vermont Department of Environmental Conservation. (2026). Advanced Clean Trucks. Vermont Department of Environmental Conservation. https://dec.vermont.gov/air-quality/mobile-sources/zero-emission-vehicles/ACT
Vermont Department of Forests, Parks, and Recreation. (2019). Vermont Water Quality: Acceptable Management Practices Manual for Logging Professionals. Vermont Agency of Natural Resources.
Vermont Department of Housing and Community Development. (2025, July 14). Vermont 2025 HUD - Community Development Block Grant Disaster Recovery (CDBG-DR) Action Plan [Action Plan]. Vermont Agency of Commerce and Community Development. https://outside.vermont.gov/agency/ACCD/ACCD_Web_Docs/CD/VCDP/CDBG-DR/Vermont%202025%20CDBG-DR%20Action-Plan%20Updated%20Submis…..
Vermont Department of Public Health. (2024). THO Manual: THO’s Role in Onsite Wastewater Systems. https://www.healthvermont.gov/sites/default/files/document/env-tho-manual-wastewater.pdf
Vermont Department of Public Service. (2020). VT Data—WEC Utility Poles [Dataset]. VT Center for Geographic Information. https://geodata.vermont.gov/datasets/vtpsd::vt-data-wec-utility-poles/about
Vermont Department of Public Service. (2021). VT Data—Electric Utility Substations [Dataset]. VT Center for Geographic Information. https://geodata.vermont.gov/datasets/vtpsd::vt-data-electric-utility-substations/about
Vermont Electric Cooperative. (2020a). VT Data—VEC Poles—Points [Dataset]. VT Center for Geographic Information. https://geodata.vermont.gov/datasets/VCGI::vt-data-vec-poles-points/about
Vermont Electric Cooperative. (2020b). VT Data—VEC Primary Overhead and Underground Distribution Lines [Dataset]. VT Center for Geographic Information. https://geodata.vermont.gov/maps/a1ff63f423c24d339f3e60f3fb2c403b
Vermont Electric Cooperative. (2023, February 8). Overhead, or Underground: The Ongoing Balancing Act. Vermont Electric Coop. https://vermontelectric.coop/latest-news/overhead-or-underground-the-ongoing-balancing-act-02-08-23
Vermont Electric Cooperative. (2024, January 30). VEC Reliability and Resiliency. Vermont Electric Coop. https://vermontelectric.coop/latest-news/vec-reliability-and-resiliency-01-30-24
Vermont Emergency Management. (2018, November 17). 2018 Vermont State Hazard Mitigation Plan. https://vem.vermont.gov/sites/demhs/files/Conference/EPC%202019_SHMP.pdf
Vermont Emergency Management. (2023a). 211 Flood Damage Report [Dataset]. https://vermont211.org/
Vermont Emergency Management. (2023b). 2023 State Hazard Mitigation Plan. https://vem.vermont.gov/plans/SHMP
Vermont Emergency Management. (2026). Flood Mitigation: Structures | Vermont Emergency Management. https://vem.vermont.gov/funding/mitigation/flood-mitigation-structures
Vermont Fish & Wildlife Department. (2016, July). Vermont Stream Crossings Handbook. Vermont Agency of Natural Resources. https://anr.vermont.gov/sites/anr/files/documents/AOP%20HANDBOOK.pdf
Vermont Fish & Wildlife Department. (2025). Beaver. VT Fish and Wildlife. https://www.vtfishandwildlife.com/learn-more/vermont-critters/mammals/beaver
Vermont floods raise concerns about future of state’s hundreds of aging dams. (2024, July 13). Vermont Public. https://www.vermontpublic.org/local-news/2024-07-13/vermont-floods-raise-concerns-about-future-of-states-hundreds-of-ageing-dams
Vermont Gas Systems. (2025). Who We Are. VGS. https://vgsvt.com/about/who-we-are/
Vermont Housing Finance Agency. (2023). Year structure built. Vermont Housing Finance Agency. Housingdata.Org. https://housingdata.org/profile/housing-stock/year-structure-built
Vermont Housing Finance Agency. (2024, June). Vermont Housing Needs Assessment 2025-2029 [Factsheet]. https://outside.vermont.gov/agency/ACCD/ACCD_Web_Docs/Housing/Housing-Needs-Assessment/2025-2029/2025-Factsheet-1-ExecSum.pdf?_…..
Vermont Legislature Joint Fiscal Office. (2024, May 7). Draft Appropriations. https://ljfo.vermont.gov/assets/Uploads/5d899e4a40/Document3.pdf
Vermont Senate Committee on Natural Resources and Energy. (2025, February 21). VTrans tells Senate Transportation bill’s dust‑suppression reporting would be heavy admin for little chloride [Meeting Recording]. https://citizenportal.ai/articles/6316587/VTrans-tells-Senate-Transportation-bills-dustsuppression-reporting-would-be-heavy-adm…
Vermont Watershed Management Division. (2014, October 24). Vermont Flood Hazard Area and River Corridor Rule [Rule]. Vermont Department of Environmental Conservation. https://dec.vermont.gov/sites/dec/files/documents/wsmd-fha-and-rc-rule-adopted-2014-10-24.pdf
Wang, R., Tang, H., & Zhou, F. (2024). Stability analysis of roadbed under flood scouring. Scientific Reports, 14(1), 4312. https://doi.org/10.1038/s41598-024-54765-8
Waterhouse, R. (2024, July 11). Water Main Break and Precautionary Boil Water Notice. Town of St. Johnsbury. https://www.stjvt.com/my-post850d0e82
Weiss-Tisman, H. (2025, June 2). Green Mountain Power seeks to install up to 1,200 storage batteries in remote homes. Vermont Public. https://www.vermontpublic.org/local-news/2025-06-02/green-mountain-power-seeks-install-storage-batteries-remote-homes
Wemple, B. C. (2013). Assessing the Effects of Unpaved Roads on Lake Champlain Water Quality (Technical Report No. 74; p. 69). Lake Champlain Basin Program. https://www.lcbp.org/wp-content/uploads/2017/09/LCBP_road-study_revised_24JUN2013.pdf
Wemple, B. C., Clark, G. E., Ross, D. S., & Rizzo, D. M. (2017). Identifying the spatial pattern and importance of hydro‐geomorphic drainage impairments on unpaved roads in the northeastern USA. Earth Surface Processes and Landforms, 42(11), 1652–1665. https://doi.org/10.1002/esp.4113
Wemple, B. C., Estabrook, E., Dewoolkar, M., & Hamshaw, S. (2021). Quantifying Gully Erosion and Potential for Sediment and Phosphorus Pollution Reductions Achieved by Erosion Remediation Projects on Vermont’s Roads (Technical Project Report Nos. 2021–02). Vermont Agency of Transportation. https://rosap.ntl.bts.gov/view/dot/60110
Westbrook, C. J., Ronnquist, A., & Bedard-Haughn, A. (2020). Hydrological functioning of a beaver dam sequence and regional dam persistence during an extreme rainstorm. Hydrological Processes, 34(18), 3726–3737. https://doi.org/10.1002/hyp.13828
Wilcox, G. (2025). The Vermont Weatherization Program Federal Funding Outlook. https://legislature.vermont.gov/Documents/2026/Workgroups/House%20Energy%20and%20Digital/Energy/Energy%20Updates%20October%2020…
Wilson, N., & Jarecki, J. (2023, October 31). Green Mountain Power plans to end outages by 2030. How realistic is that? Vermont Public. https://www.vermontpublic.org/local-news/2023-10-31/green-mountain-power-plans-to-end-outages-by-2030-how-realistic-is-that
Wohl, E. (2005). Compromised Rivers: Understanding Historical Human Impacts on Rivers in the Context of Restoration. Ecology and Society, 10(2). https://doi.org/10.5751/ES-01339-100202
Wright, A. (2024, January 3). Vermont Agency of Transportation Resiliency Work. In Joint Meeting of the House Transportation and House Environment and Energy Committees. https://legislature.vermont.gov/Documents/2024/WorkGroups/House%20Transportation/Flood%20Recovery,%20Funding,%20and%20Resilienc…
Yarmey, N., & Hood, G. (2020). Resident perceptions of human–beaver conflict in a rural landscape in Alberta, Canada. Human-Wildlife Interactions, 14(3), 476–486. https://doi.org/https://doi.org/10.26077/0c80-ab0a