Authors
Rubaina Anjum
Benjamin E.K. Ryan
Renata A. Lucchesi Kadri
Rodrigo Soares
About
Recommended citation for chapter
Anjum, R., Ryan, B., Kadri, R., Soares, R., 2026. Chapter 11: Community Development. In Galford, G.L., Balerna, J.A., Turner H.C., Sardonis, A., Peplinski, H. (Eds), The Vermont Climate Assessment 2025. Burlington, Vermont: Climate Measurements Center of Excellence, Gund Institute for Environment at the University of Vermont. DOI: 10.5281/zenodo.20272849. Accessed online at https://vtclimate.org.
Author Contributor Roles Taxonomy (CRediT) statement
Rubaina Anjum: Conceptualization, Methodology, Writing- Original draft preparation, Writing- Editing & Review, Visualization; Benjamin E.K. Ryan: Conceptualization, Methodology, Writing- Original draft preparation, Writing- Editing & Review, Visualization; Renata A. Lucchesi Kadri: Conceptualization, Methodology, Writing- Original draft preparation, Writing- Editing & Review, Visualization; Rodrigo Soares: Writing- Original draft preparation, Writing- Editing & Review.
Acknowledgements
We thank Lena Greenberg, Joan Haley, Matt Lawless, and Cheryl Morse, whose thoughtful reviews and contributions helped refine and strengthen this chapter. We are grateful for stakeholders Chris Campany, Kevin Chu, Meghan Cope, Johanna de Graffenreid, Stephanie A. Smith, Emma Spett, and Amanda Weinstein, whose insights and expertise added indispensable elements to the chapter. We thank J.A. Balerna for contributing Figure 11-2, and H.C. Turner for contributing Figures 11-1, 11-16, 11-17, 11-18, and 11-21. This chapter is only possible thanks to the vital feedback and support from the Vermont Climate Assessment team: G.L. Galford, J.A. Balerna, H. Peplinski, H.C. Turner, and L. Chen as well as community members of the University of Vermont and the Gund Institute for Environment.
Downloads
Please use the following accessible downloads for your own needs.To find downloads of other chapters in VCA 2025, please go to Downloads.
11.0 Executive summary
Effects of climate change in Vermont, such as extreme heat, drought, and flooding, have adverse impacts on individual and community well-being. Severe flooding in July 2023, termed “the Great Vermont Flood,” followed by severe flooding one year later, caused extensive damages to life and property, with preliminary estimates by the state exceeding $600 million. These impacts induced displacements within Vermont and damaged thousands of homes and businesses. Once considered a climate haven, these flooding events reveal that climate vulnerability and risks persist across the state. Some people are disproportionately vulnerable to climate impacts, particularly those who are unhoused, live below the poverty line, have a disability or chronic health condition, or live in manufactured housing communities.
Communities are well positioned to decrease vulnerabilities that stem from both environmental (e.g., climate change, flood-prone land use) and socioeconomic (e.g., housing affordability) stressors through the following actions:
- Integrative planning among municipalities, regional planning commissions, and state agencies that prioritizes flood mitigation and adaptation.
- Expansion of communication networks and improvement of early warning systems for at-risk populations.
- Support of community-led organizations, mutual aid groups, and long-term recovery groups to improve disaster response, recovery, and mitigation, especially considering reductions in resources from the Federal Emergency Management Agency (FEMA).
- Expansion of inter-state resources, development of pooled and shared resources between communities, and a focus on green infrastructure and nature-based solutions will benefit communities in the immediate and long terms.
- Protection of local businesses through programs like the Business Emergency Gap Assistance Program (BEGAP) to provide emergency funding and help more quickly revive local economies and communities following disaster events, like floods.
- Leverage state-led initiatives—whose main objectives are water quality improvements or biodiversity loss prevention—to simultaneously improve climate resilience in communities.
- Expansion of public transit and compact development offer pathways to reduce greenhouse gas emissions, and nurture more socially cohesive communities that are quintessential to Vermont’s identity.
Community development is a cross-cutting issue that is addressed in many chapters in this assessment. The health and well-being of individuals impact communities’ capacities to adapt and recover from climate change impacts (see 10 Human Health). Community development is largely limited in planning and growth by the capacity of existing infrastructure, like sewer and septic systems (see 7 Infrastructure). Investments in energy systems like the Municipal Energy Resilience Program that improve heating of homes and businesses through weatherization and efficiencies are central to affordability, as energy cost burdens are extremely high (see 8 Energy). Communities rely on water resources for drinking water and commercial needs (e.g., irrigation) and are impacted by declines in water quality, water supply, and overflowing of rivers during flood events (see 4 Water Resources). Vermont’s economy is highly dependent on outdoor recreation and tourism, which indicates a necessity to manage natural, social, and cultural resources that often overlap into the domains of community development (see 9 Outdoor Recreation and Tourism).
For Vermont to be a place of refuge from climate change and have this status lead to locally desired demographic and economic growth, the state needs proactive integrated planning and the development of financial, social, and natural resources that fosters inclusive, safe, and prosperous communities. Governing bodies and agencies should prioritize resources to address the needs of communities that are at higher risk from climate change due to factors like poverty, aging, disability, being unhoused, non-English speakers, and racial minorities.
11.1 Key messages
- Vermont’s aging population, rural poor, unhoused residents, manufactured housing communities, and racial and ethnic minorities face the greatest exposure to climate hazards. Marginalized groups have the fewest resources to adapt to climate impacts. Reducing climate vulnerability requires addressing the underlying structural inequalities in housing, income, and healthcare that determine who is most at risk.
- Early warning systems for climate impacts require improvement. Expanding support to vulnerable populations must be conducted at all stages of the disaster cycle and include building partnerships with community organizations, nonprofits, and local leaders. There is a need to improve the clarity, relevance, and accessibility of disaster communication.
- Vermont's small-business-dominated economy is heavily concentrated in climate-sensitive sectors including tourism, agriculture, and outdoor recreation. Repeated disasters can strain state and municipal budgets, decreasing fiscal stability. Integrating climate resilience planning into the private and public sectors is essential. Innovative policy measures are needed to finance climate action as well as increasing climate-friendly economic development.
- Vermont's historic land use patterns have contributed to its climate vulnerability. The concentration of development in floodplains, combined with car-dependent sprawl, exposes communities to intensifying hazards while driving roughly 70% of the state's greenhouse gas emissions. Directing growth to higher ground, restoring natural buffers, and expanding affordable housing in compact communities are essential in creating resilient communities that can function as climate havens.
- Stakeholders across sectors stressed the need to address climate change more proactively, which requires increasing capacity within government and through community-led efforts (e.g., long-term recovery groups).Vermont's emergency management system is fragmented and under-resourced, and federal disaster support is becoming less reliable. Emergency response relies heavily on part-time municipal officials, and federal disaster assistance. Building durable state and regional capacity, with community-led organizations formally integrated into emergency planning, is critical.
- Vermont's strong civic networks and community-led organizations are key to improving climate resilience. Strengthening social protection and investing in Vermont's civic infrastructure are essential to building equitable climate resilience. Structural measures are needed to address underlying inequalities. Examples include expanding affordable housing, strengthening worker protections, ensuring universal healthcare access, and building state-level safety net programs.
11.2 Background
11.2.1 Community development and climate change
Community development is the ongoing improvement of a group or community by pursuing collective and individual goals centered around human well-being (Shaffer et al., 2004). Goals may involve physical infrastructure, social infrastructure and institutions, economic development, human development, equity, and environmental governance. Human well-being is highly dependent on the ecological systems in and around communities.
Climate change poses a significant and complex challenge to the pursuit of community development, placing mounting pressure on communities and ecosystems—collectively termed socio-ecological systems. This includes slow-onset climate change, such as rising temperatures and changing precipitation patterns, as well as extreme events, like floods and droughts that can develop quickly.
In Vermont, the most notable climate impacts in recent memory have been from severe flooding events, which have occurred repeatedly in the last five years as well as during Tropical Storm Irene in 2011 (see Water Resources 4.4.1). In July 2023, extreme rainfall, combined with saturated soils and persistent weather patterns, ultimately resulted in historic flooding throughout the state, which the National Weather Services named the “Great Vermont Flood of 2023.” The physical damages from this flood were estimated at over $600 million (Vermont Agency of Administration, 2023). This does not capture indirect costs, such as the loss of revenue or wages from the flooding, or longer-term impacts, such as negative health effects or other reductions in quality of life in affected communities (see Human Health 10.4).
Vermont is at risk from other hazards, like drought, wind, and rising temperatures, which can affect the state’s agriculture sector, water supply, and physical infrastructure. The widespread 2025 drought led to many towns issuing water conservation notices, and people who rely on wells for drinking water saw them go dry (Oliver, 2025; see Water Resources 4.3.2). Addressing climate change is important from an equity standpoint, as its impacts are unevenly distributed and shaped by class, race, gender, and other socioeconomic factors (see 11.3).
Embedding climate risk in community development is essential. Doing so requires accounting for and protecting against the physical damage caused by climate impacts and integrating climate risk adaptation into institutions, governance, and planning. The inherent uncertainty associated with climate risk renders traditional planning frameworks unable to deal with climate impacts sufficiently. Planning under climate change requires identifying strategies that can cope with a wide range of climate futures.
11.2.2 Overview of Vermont’s communities
Vermont is home to approximately 645,000 people living in 252 cities and towns that are characterized by a combination of natural and working landscapes, concentrated village and urban centers, and dispersed rural households. The population is approximately 90% white and contains one of the highest proportions of seniors (age 55+) in the United States (U.S.). Nearly two-thirds of people live in rural areas, the highest proportion in the U.S. (U.S. Census Bureau, 2024d, 2020). The two most densely populated areas are Chittenden and Rutland counties with 26% and 10% of the population, respectively. Greater Burlington and Rutland City are the most densely populated areas within those counties (Figure 11-1). Population declined in the early to mid-2010s because of net out-migration, particularly of people earning below $100,000 as they moved out of the state (Campbell & Wexler, 2019). However, following the COVID-19 pandemic there was a sudden spike in in-migration, though the population seems to have stabilized or even shown a mild decline since then (see 11.3.2).
Vermont is known for its forested landscapes, which are primarily naturally regenerated agricultural land that was abandoned following the collapse of the wool industry in the late 19th century. Act 250, the state’s landmark land-use and development law, is widely credited with preserving these forests. Approximately 78% of the state is forested, with over 80% of that land privately-owned and managed. The law was passed in response to pressures from new housing development, particularly due to increasing tourism driven by the ski industry. While it is seen as preserving the scenic beauty of the landscapes, it has come under criticism for restricting development and thus contributing to Vermont’s housing shortage. Along with Act 250, individual town zoning regulations are criticized for exacerbating this shortage. Moreover, towns in Vermont were established along waterways and in floodplains because transportation, industry, and trade required being close to rivers. As climate change is projected to increase the frequency and intensity of flood events (see Climate Change in Vermont 2.6.2), communities living in these towns are at increased risk of damage to property and loss of life.
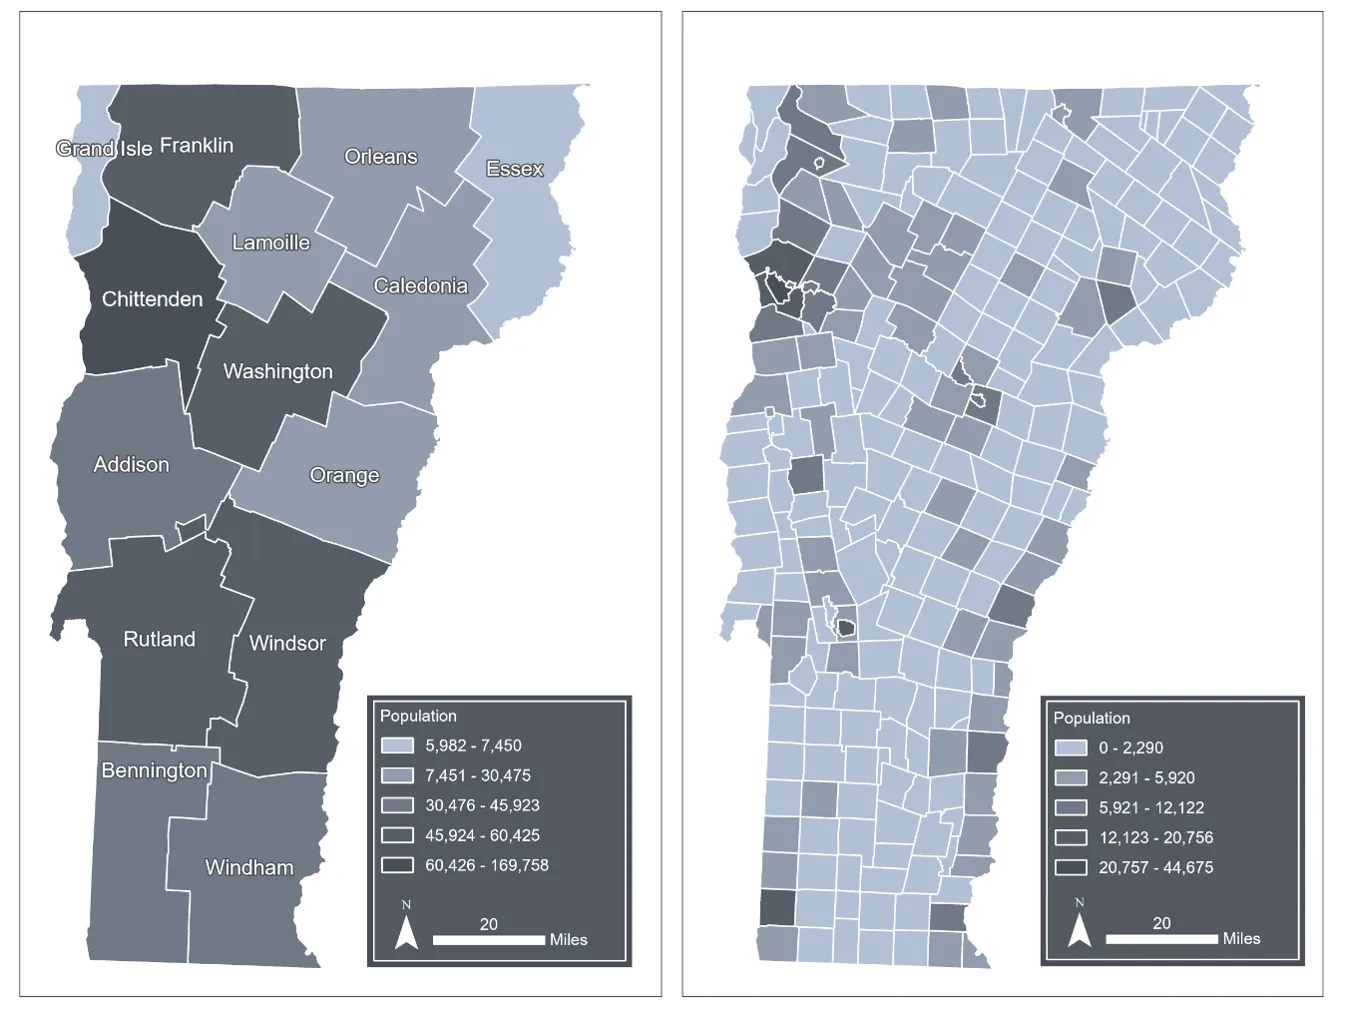
Source: U.S. Census Bureau (2024b)Note: Visualization by Hannah C. Turner
11.2.3 Vulnerability and resilience
Vulnerability and resilience are two related but distinct concepts that can inform frameworks for community development in the context of climate impacts. Both concepts are concerned with how communities, ecosystems, or social-ecological systems respond to stress and disturbance.
Vulnerability and the factors that shape vulnerability (i.e., exposure, susceptibility, and adaptive capacity) include both structural characteristics—such as age, race, health, income, type of dwelling unit, and employment—as well as “place inequalities,” which can include the level of urbanization, urban design, and economic vitality (Cutter et al., 2003, Figure 11-2). Adaptive capacity encompasses reactive measures (e.g., access to post-disaster aid, transportation, insurance, emergency services) as well as anticipatory actions (e.g., development of institutions, governance structures, knowledge) that can serve pre- and post-disaster needs.
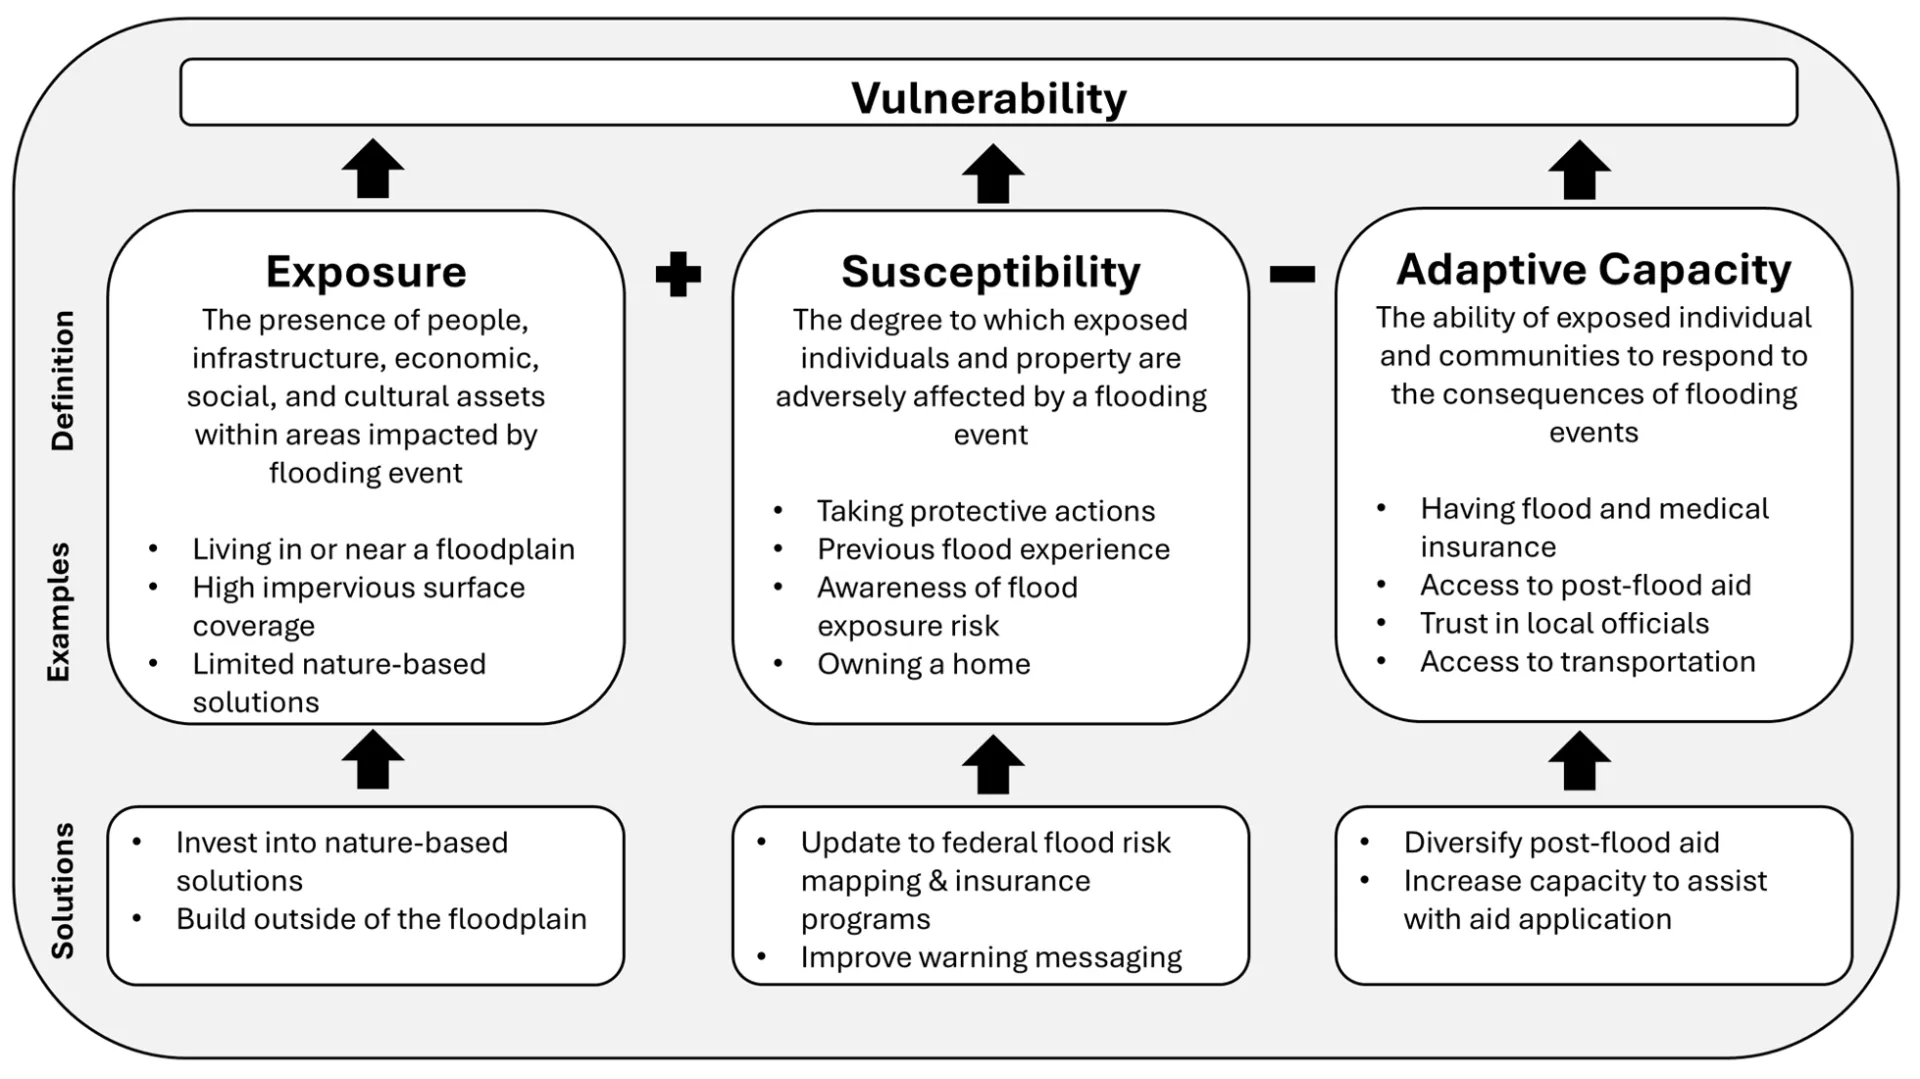
Source: Data visualization by authors and Jessica A. Balerna
Climate-resilient communities can absorb or withstand climate disturbances. However, creating climate-resilient communities requires identifying and understanding boundaries (e.g., watersheds, municipalities), tipping points (e.g., repeated flooding events that make homes uninhabitable), threshold effects (e.g., water retention capacity of wetlands/ floodplains) and cascading interactions (e.g., health impacts from a flood event increasing susceptibility to future hazards).
Vulnerability and resilience overlap when assessing a community’s adaptive capacity. In vulnerability frameworks, adaptive capacity is the factor that moderates the relationship between exposure and harm. Communities with greater adaptive capacity are less vulnerable even when they are more exposed to a hazard (Figure 11-2). In resilience frameworks, adaptive capacity allows systems to resist, reorganize, or transform when pushed past a threshold or tipping point. Reducing vulnerability and increasing resilience are complementary goals. Vulnerability is more about mapping risk while resilience is concerned with preserving the essential functions of a system. This chapter provides an overview of climate-related vulnerabilities in Vermont’s communities and discusses governance, policy, and community action for resilience.
11.3 Demography
11.3.1 Socioeconomic vulnerability
Physical location, age, income, wealth, race, and housing status are among a range of socioeconomic characteristics that can impact vulnerability to climate change. Nationally, Vermont ranks the second lowest in climate vulnerability because it is less exposed to certain climate impacts (e.g., wildfires) and not exposed to others at all (e.g., sea-level rise). However, some communities are at high risk from certain hazards based on their physical location (U.S. Climate Vulnerability Index, 2026). For example, all Vermont counties—except Orange and Essex—are ranked higher for flooding risk in the Climate Vulnerability Index than the national average. The Index further ranks most Vermont counties as highly vulnerable to extreme temperatures, which places the aging population, unhoused people, and those who work in agriculture or other outdoor jobs at higher risk (see Human Health 10.3). Moreover, some minority populations can be more vulnerable to certain climate impacts, making their identification critical.
Aging population
A key feature of Vermont’s demography is its aging population (Figure 11-3). Vermont has the second highest share of population over the age of 65 of any state (21.4%); the national average is 16.9% (U.S. Census Bureau, 2024a). From 2020–2024, the share of the population between the ages of 65–79 (15%) and above the age of 80 (14%) has increased in the state (U.S. Census Bureau, 2024b). At the same time, the working age population increased only modestly (1.2%), and the young adult population increased by about 7% percent (Table 11-1).
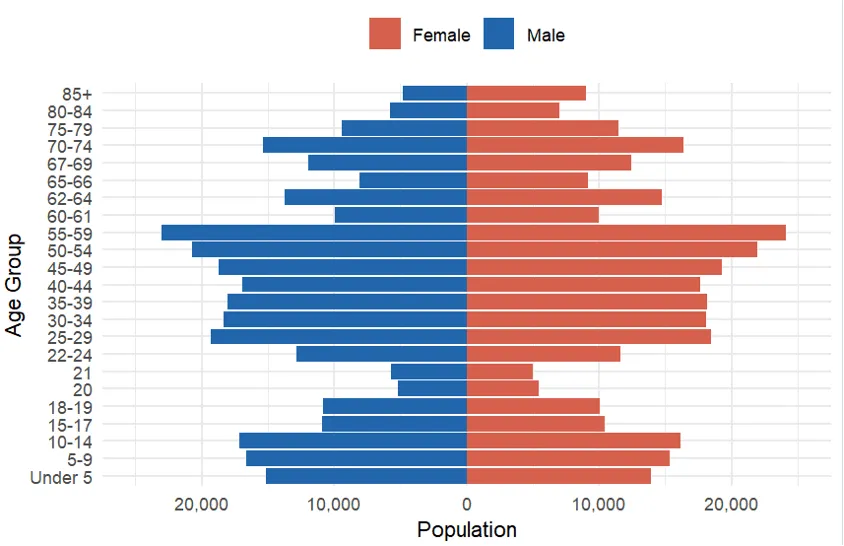
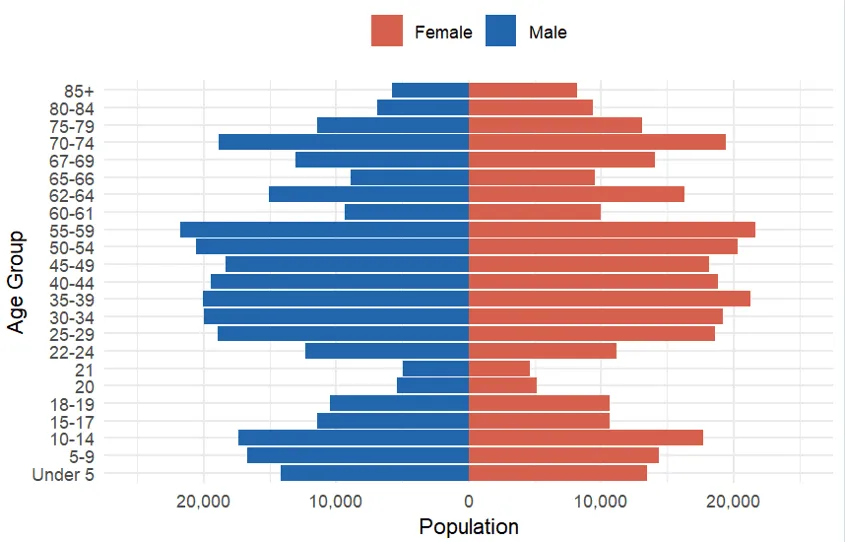
Source: U.S. Census Bureau (2024b)
Age group | 2020 | 2024 | Percentage change |
|---|---|---|---|
0-17 | 115,632 | 115,986 | +0.3% |
18-24 | 66,619 | 64,692 | -2.9% |
25-39 | 110,439 | 118,031 | +6.9% |
40-54 | 115,180 | 115,651 | +0.4% |
55-64 | 95,598 | 94,067 | -1.6% |
65-79 | 94,275 | 108,433 | +15.0% |
80+ | 26,597 | 30,246 | +13.7% |
Total | 624,340 | 647,106 | +4.5% |
Source: U.S. Census Bureau (2024b)
Older adults are more likely to experience serious health impacts from increasing incidences of heatwaves, wildfires, and vector-borne illnesses (see Human Health 10.2). They are more likely to face challenges with mobility and require assistance with daily activities. Just over half (51%) of Vermonters over the age of 80 live alone (Vermont Agency of Human Services & Department of Health, 2025). This social isolation can add difficulty in case of evacuation due to a climate-related extreme event (e.g., flood, wildfire). These vulnerabilities can be improved with measures that increase social cohesion (i.e., feelings of trust, support, and belonging among communities) as well as inclusive planning (see 11.6.5). The large proportion of older adults also creates a structural vulnerability that adds stress to existing systems; for example, a higher rate of emergency department visits could occur during a heatwave compared to a population that has a higher share of younger adults (see Human Health 10.3). This puts pressure on health systems’ capacity to deal with the increased demand and can lead to negative outcomes for patients beyond those seeking care due to heat impacts.
Children and adolescents form a vulnerable population in terms of health and face similar risks to the older adults including those from heat stress, asthma, allergies, and vector-borne illnesses as well as mental well-being (Otto et al., 2017; see Human Health Table 10-1). Climate-related extreme events can also cause disruptions in education when schools shut down. Children in poverty are at greater risk from climate impacts, compounded by a 200% increase in the number of children experiencing houselessness since 2020 (Lantieri et al., 2024).
Racial and ethnic minorities
While racial minorities make up only 9% of Vermont’s population, race and ethnicity can shape susceptibility to climate risk. Census tracts in the state with high racial diversity and limited English proficiency residents are also associated with vulnerability to higher heat (Ren et al., 2023). Studies in other states and nationwide show that mortality risk from rising temperatures is higher among Black, Hispanic/Latino/a, and Native American adults compared to white adults as well as among non-U.S. citizens compared to citizens (Berberian et al., 2022). Heat-related incidence of cardiovascular events, acute kidney injury, and asthma is also higher in black individuals compered to non-black individuals (Berberian et al., 2022). Lower incomes and poverty rates are a contributing factor that increases underlying risks in these populations. Further, farms in Vermont are reliant on Latino/a people for labor, increasing their risk of heat-related health issues as they work outdoors.
Black, Hispanic/Latino/a, and Native American populations in Vermont are more likely to experience houselessness, increasing their exposure to climate impacts (Lantieri et al., 2024); they are overrepresented in the houseless population compared to their share in the overall population of Vermont (Table 11-2), particularly for Black people.
Race/ Ethnicity | Vermont population | Percent of total population | Houseless population | Percent houseless population |
|---|---|---|---|---|
Asian | 10,824 | 1.7% | 36 | 1.0% |
Black | 8,000 | 1.2% | 266 | 7.7% |
Hispanic/Latino/a | 13,793 | 2.1% | 154 | 4.5% |
Native American | 1,336 | 0.2% | 83 | 2.4% |
Two or more races | 25,809 | 3.9% | 69 | 2.0% |
White | 594,131 | 90.9% | 2,835 | 82.3% |
Total | 653,893 | 3,443 |
Source: Lantieri et al. (2024)
Income and poverty
Low-income households and individuals are often disproportionately impacted by extreme events across the world, including within the U.S. (Avtar et al., 2023; Dang et al., 2026; Winsemius et al., 2018). People with low incomes are likely to be concentrated in areas physically at-risk from extreme weather, have homes less resistant to extreme weather, or be experiencing houselessness. With limited resources, they are less likely to be able to respond to a climate event and recover from it. Extreme events can increase future rates of poverty and exacerbate income inequality (Avtar et al., 2023; Hallegatte & Rozenberg, 2017). Repeated shocks can push people who are slightly above the threshold down into poverty.
In Vermont, the share of households below the federal poverty level is approximately 9%, substantially below the national rate of 12% (Public Assets Institute, 2025). The proportion of non-white households in poverty is much higher with Black, Native American, and Pacific Islanders being the highest (22%, 19%, and 18.5%, respectively). The federal poverty level can underestimate income-based vulnerability as the cost of living in Vermont is relatively high (Vermont Joint Fiscal Office, 2025). The Vermont Basic Needs Budget for a single person was about $50,000 in urban areas and $45,000 in rural areas (Vermont Joint Fiscal Office, 2025). About one-third of Vermont households earn less than $50,000 (Figure 11-4). Younger and older people are overrepresented in the groups that are making below $25,000 and between $26,000–50,000. The northeast and southern areas of the state have relatively higher rates of poverty than the rest of the state (Figure 11-5).
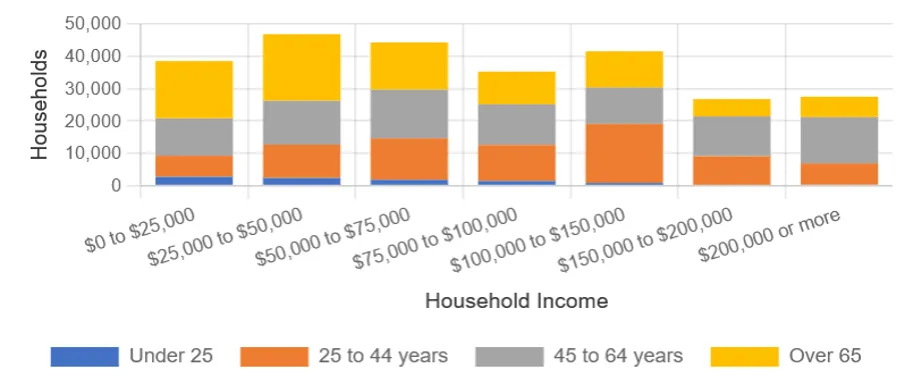
Source: U.S. Census Bureau (2023)
Note: Households can be of any size from one household member and higher
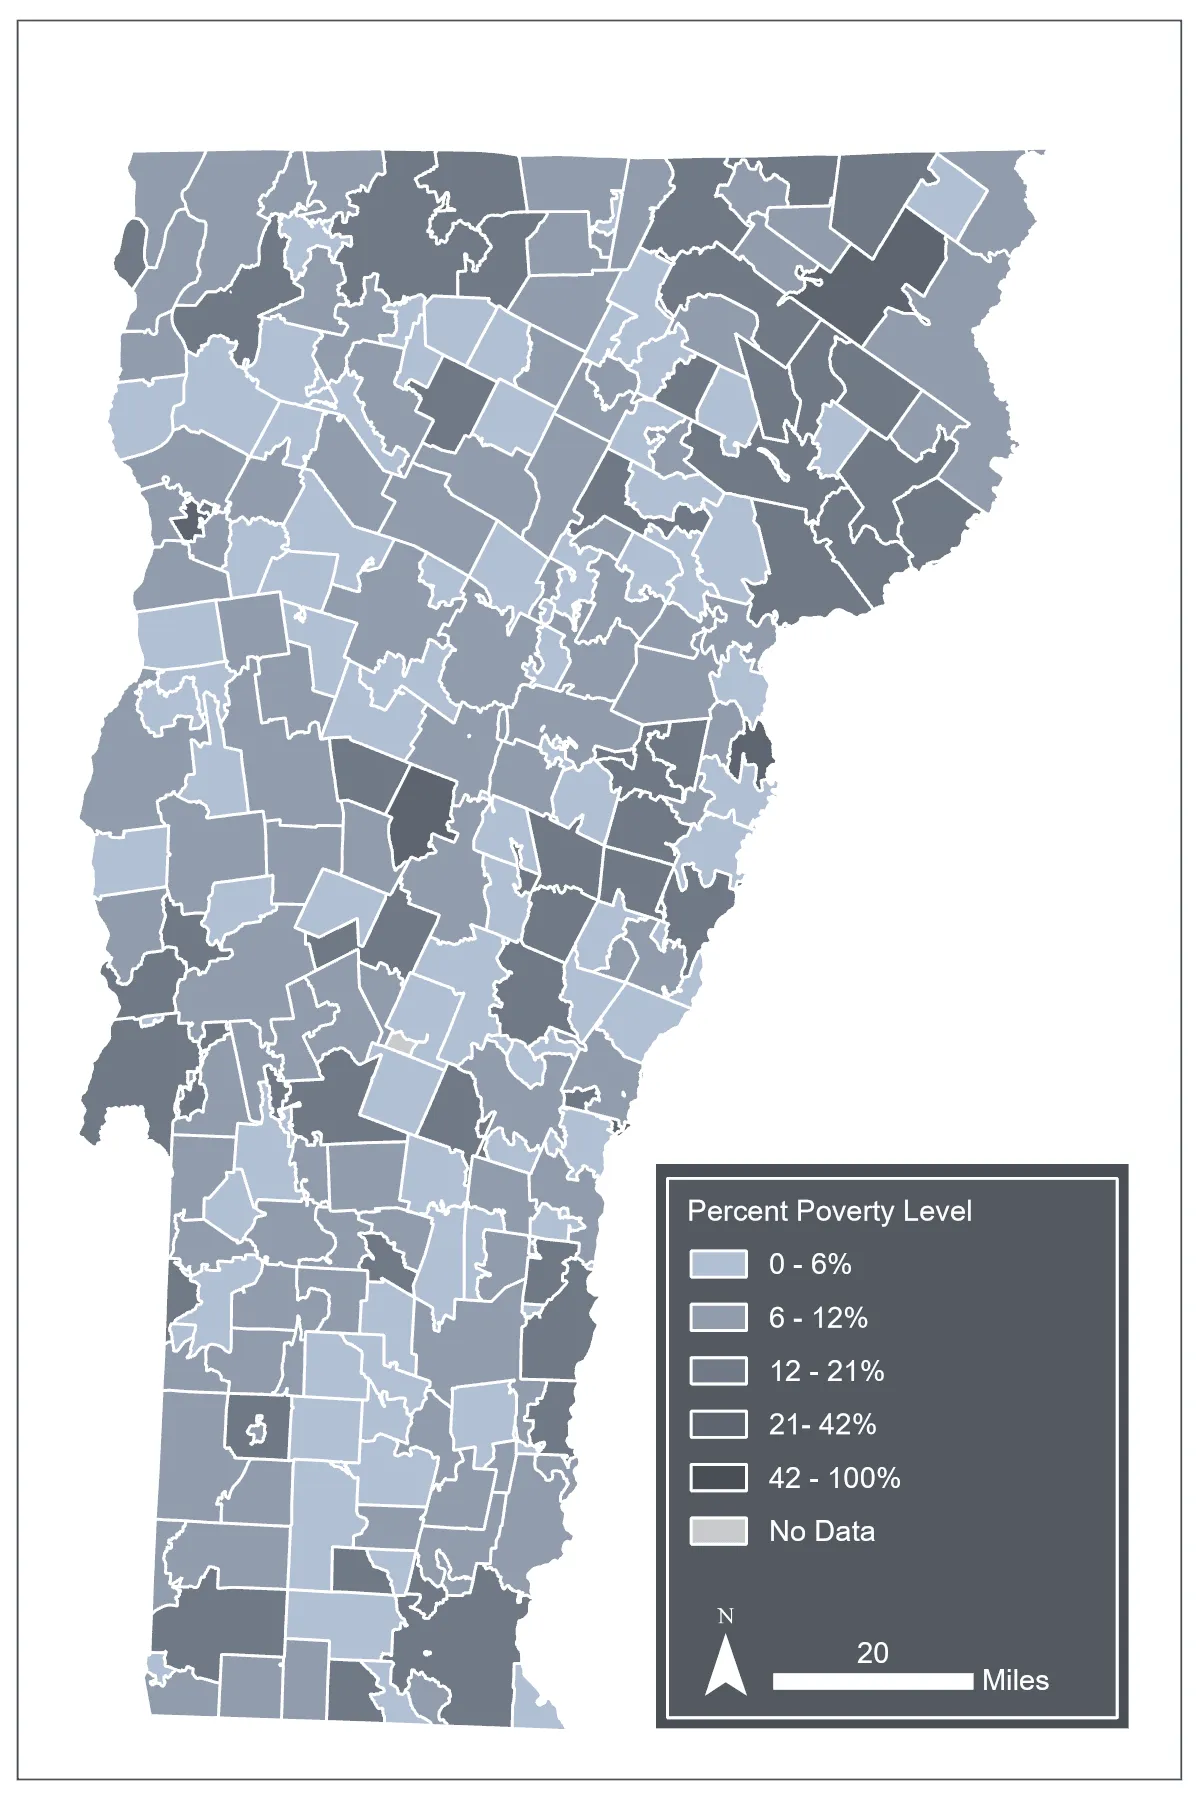
Source: U.S. Census Bureau (2024b)
Note: Data visualization by Hannah C. Turner
Housing
Housing and shelter are inextricably connected to climate vulnerability. Based on reports to the statewide help line called 211, the floods of July 2023 and July 2024 damaged at least 7,924 homes (roughly 2.3% of residential properties), adversely impacting thousands of households and individuals (Lantieri et al., 2024). This number is likely an undercount, as July 2023 reports (5,026) were significantly higher than July 2024 (2,898). While these numbers are reflective of the events themselves—July 2023 impacted a larger area of the state—many residents were impacted in both years and potentially failed to report damage the second time if they felt their needs were not met in July 2023. Across all counties impacted by the floods of July 2023 and July 2024, the majority of 211 reports for residential property damage were owned rather rented (Table 11-3).
County | July 2023 | July 2024 | ||
|---|---|---|---|---|
County | Own | Rent | Own | Rent |
Addison | 520 | 22 | 173 | 6 |
Bennington | 94 | 6 | 1 | 0 |
Caledonia | 263 | 15 | 803 | 59 |
Chittenden | 208 | 10 | 514 | 7 |
Essex | 8 | 1 | 109 | 5 |
Franklin | 46 | 2 | 7 | 1 |
Grand Isle | 4 | 0 | 1 | 0 |
Lamoille | 268 | 135 | 97 | 3 |
Orange | 366 | 30 | 26 | 3 |
Orleans | 361 | 25 | 179 | 2 |
Rutland | 143 | 17 | 4 | 0 |
Washington | 1,452 | 230 | 828 | 63 |
Windham | 188 | 3 | 2 | 0 |
Windsor | 518 | 22 | 4 | 0 |
All counties | 4,439 | 518 | 2,748 | 149 |
Source: Vermont Emergency Management (2023a)
Climate risk in manufactured housing communities
Manufactured housing communities, also known as mobile home parks, are a vital source of affordable housing in Vermont, serving over 7,000 households. These communities are disproportionately vulnerable to extreme weather events as they are often located within floodplains and house residents who are more susceptible to impacts and less able to respond or adapt. Populations in vulnerable housing situations, such as manufactured homes, are the most severely impacted by disasters (Baker et al., 2014; Tate et al., 2021; see Human Health 10.4.1).
For example, during Tropical Storm Irene (2011), mobile homes accounted for 15% of the homes damaged—with over 150 homes destroyed in park communities—despite comprising only 7% of Vermont's housing stock (Hamshaw & Baker, 2024). A third of all mobile home parks have some land in floodplains (Hamshaw & Baker, 2024), and 12–40% of the homes are in a “Special Flood Hazard Area” as designated by FEMA. Many manufactured housing communities were built before modern land-use regulations, so they were allowed to be sited in hazardous locations like floodplains, where land is typically cheaper than in other areas. The construction materials and layout make them more susceptible to storm damage from wind and water. Flood waters can move manufactured homes off their concrete slab.
During the July 2023 flooding event, 65 mobile homes were severely damaged or destroyed (Vermont Disaster Recovery, 2025). To assist homeowners, the state of Vermont created the Condemned Mobile Home Assistance Program, which provides support and funding to ensure any mobile homeowners impacted by flooding received the equivalent of the maximum FEMA assistance payment to be used to rehab, relocate, or sell their damaged homes (Vermont Disaster Recovery, 2025). A 2025 flood anniversary report (Vermont Disaster Recovery, 2025) notes,
The floods of 2023 and 2024 put a spotlight on both the challenges mobile home communities face and the opportunity they present. As a direct result, the State has made mobile home repair and improvement an important part of its strategy to increase the availability and affordability of quality housing in Vermont.
This strategy includes the creation of the Mobile Home Infill Program (MHIP), which improves vacant lots and installs affordable manufactured homes for purchase (Vermont State Housing Authority, 2026).
The residents of manufactured housing communities are more likely to have characteristics that increase their vulnerability to climate change impacts. Residents who own their homes typically lease the land and have a median income significantly lower than the state average. The median income for a manufactured housing community resident is $30,000 compared to the statewide median household income of $49,500. Lower incomes combined with lower access to resources can reduce preparedness and increase vulnerability to hazards. Residents are also characterized by a higher percentage of older adults, who may have pre-existing health or mobility concerns that can impede moving out of harm's way.
Emergency managers can take proactive steps to address these risks, such as identification of manufactured housing communities, hazard mapping, developing long-term partnerships with community residents and trusted organizations, and creating emergency plans. During response and recovery, officials should recognize the unique needs of manufactured housing community residents, who are neither conventional homeowners nor renters. For long-term resilience, emergency managers should advocate for resources to reduce social vulnerability, align with programs like weatherization, educate hazard mitigation planners, and consider strategic buyouts for the most at-risk parks, while always prioritizing resident input.
Unhoused populations
The population of 3,386 unhoused people in Vermont as of July 2025 are extremely vulnerable to climate change effects and hazards (Housing & Homelessness Alliance of Vermont et al., 2025). Climate change disproportionately impacts unhoused people due to exposure to the elements (e.g., heat stress) and extreme weather events (e.g., flooding), as well as social-economic marginalization (Bezgrebelna et al., 2021). Intensive precipitation events (e.g., hail or rain) pose great risk to unhoused populations, as their belongings and shelters (e.g., tents) are vulnerable to damage (Ramos, 2025; Vermont Emergency Management, 2023b).
In Vermont, Black and Native Americans are 8% and 2% of the unhoused population, while 1% and 0.2% of the total population, respectively (Table 11-2). This disproportion may be due to income disparities and structural barriers accessing secure and stable housing (rental and ownership) by people of color (Lantieri et al., 2024). Vermont’s home and rental vacancy rates are both well below the national average, putting upward pressure on the price of housing. The rental vacancy rate for Vermont has remained below 4% since 2020, well below the historical average (Figure 11-6). Low vacancy rates also contribute to the 200% increase in unhoused populations between 2020–2025 (Housing & Homelessness Alliance of Vermont et al., 2025; Lantieri et al., 2024).
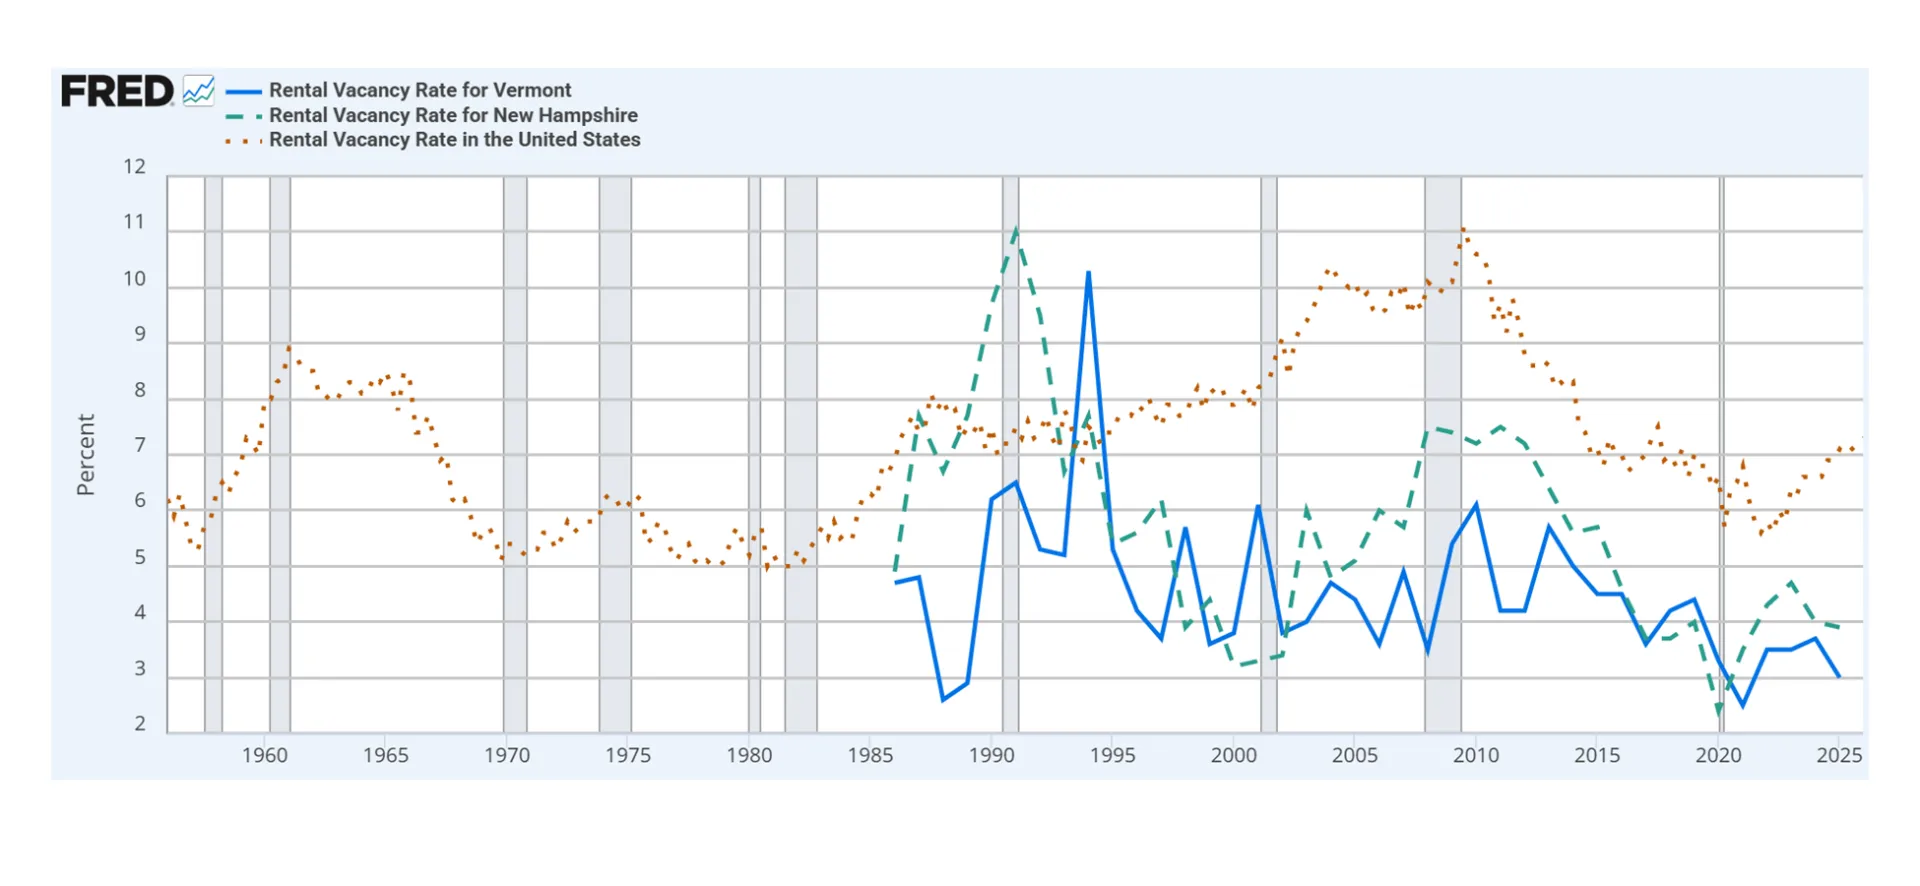
Source: Federal Reserve Bank of St. Louis (FRED, 2025)
People who are unhoused are often neither considered nor prioritized in climate adaptation planning, which increases their susceptibility and exposure to climate change impacts (Eisenhardt et al., 2024). To mitigate the impacts of extreme weather events on unhoused populations, communities should use tools like adaptive crisis management that provide inclusive shelter accommodations, shared warming and cooling spaces, employ coordinated, targeted communication strategies, and expand resources that enable these initiatives to continue (Trudeau et al., 2025). Investing in public infrastructure and planning for built/natural environments to be climate-resilient and inclusive are powerful ways to reduce climate impacts (Cronley et al., 2024). Access to safe, affordable and stable housing is the primary mechanism to reduce risk to climate impacts. Cronley et al. (2024) recommend initiatives that increase access to shade, public water, mixed-use daytime shelter, and the installation of storage lockers to increase capacity to maintain supplies and gear necessary for enduring extreme temperature and precipitation events (Cronley et al., 2024). Ultimately, increasing the availability of affordable housing is required statewide (Vermont Emergency Management, 2023b). Act 250 review requirements have been viewed as a barrier to building affordable housing, including manufactured homes. Some reform of Act 250 to enable more compact housing development in town and village centers could provide a path for affordable housing while maintaining protections for land conservation.
11.3.2 Human mobility, migration, and displacement
Climate change interacts with people's ability to migrate or move out of harm's way. Human movement can be abrupt and unplanned or deliberate and planned, and the capacity to move varies considerably across individuals and communities. These dynamics can be conceptualized through the interaction between vulnerability and mobility (Figure 11-7). Both the characteristics of individuals and populations—such as health status, socioeconomic status, and social networks—and the characteristics of the places people live—including biophysical, built, political-legal, and economic conditions—are important in determining vulnerability and mobility. Four categories emerge from these overlapping dimensions: 1) migration as adaptation (voluntary mobility due to low vulnerability but high mobility); 2) adaptation in place (voluntary immobility due to low vulnerability and low mobility); 3) displacement (involuntary mobility due to high vulnerability and high mobility); and 4) trapped populations (involuntary immobility due to high vulnerability and low mobility).
Attributing cause and effect for migration is complex, however, climate change can be a strong cause of migration due to impacts that alter economies, livelihoods, and undercut social capacities (Clark et al., 2025; International Organization for Migration, 2024). The International Organization for Migration (Sironi & Emmanuel, 2019) defines climate migration as:
The movement of a person or groups of persons who, predominantly for reasons of sudden or progressive change in the environment due to climate change, are obliged to leave their habitual place of residence, or choose to do so, either temporarily or permanently, within a State or across an international border.
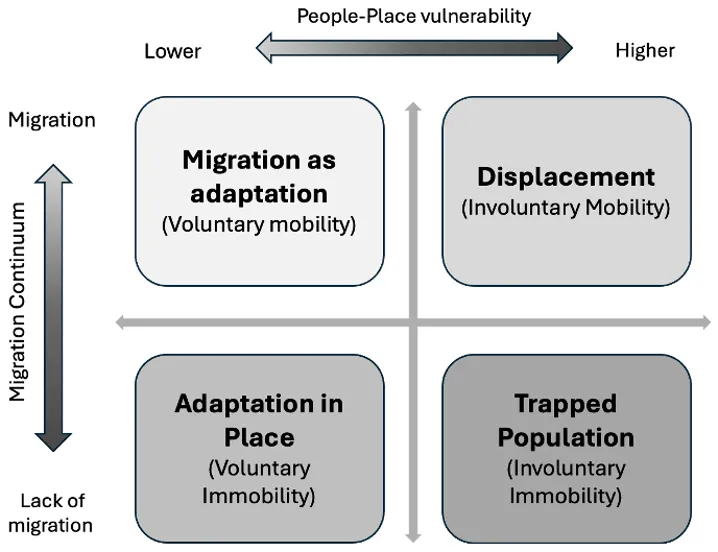
Source: Adapted from Hunter et al. (2021)
Climate change can erode livelihoods through the depreciation of environmental services (e.g., reduction in rainfall leading to lower crop yields), and therefore drive migration within regions (Feng et al., 2010; Silva Rodríguez De San Miguel et al., 2021). The distance of human movements is subject to a variety of geographic, economic, social, and political factors at the local, regional, and international scales (International Organization for Migration, 2024). Projections of future movements suggest that there may be substantial migration of people from countries with low gross domestic products (GDPs) emigrating to higher GDP countries in northern latitudes (Yang et al., 2025), though there is not universal consensus due to the innate complexity of vulnerability and uncertainty of human behavior (Benveniste et al., 2025) and the opposite may also be true within the U.S., that households in higher income brackets are more mobile particularly in response to a disaster (Clark et al., 2025).
In the U.S., internal movements and displacement of people due to natural disasters (largely intensive storms) has reached unprecedented levels; between 2015–2024, displacement due to disasters was on average seven times higher than displacements due to conflict or violence (Figure 11-8). In 2024, the U.S. experienced the highest number of internal movements of any nation due to natural disasters, with about 11 million people impacted (2025 Global Report on Internal Displacement (GRID), 2025). Within the U.S., people are generally moving away from areas experiencing extreme weather events and natural hazards (e.g., hurricanes, wildfires) related to climate change but migration is largely related to household income, suggesting households in lower income brackets are less able to migrate as a climate response (Clark et al., 2022a, 2025).
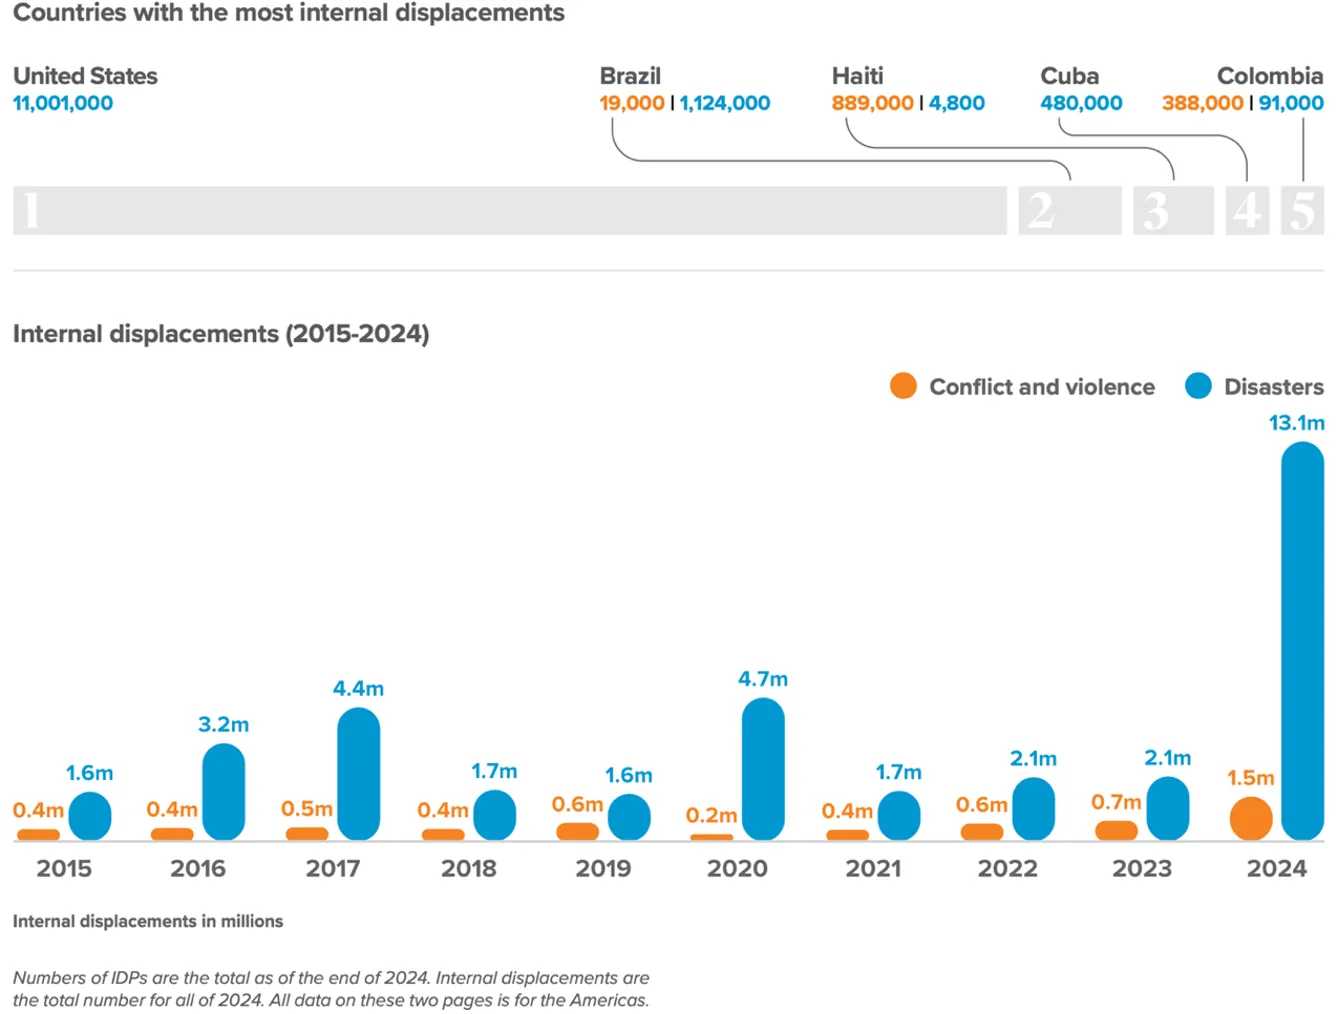
Source: Global Report on Internal Displacement (GRID, 2025)
Note: Numbers of IDPs are the total as of the end of 2024. Internal displacements are the total number for all of 2024. All data is for the Americas
Climate-induced displacement in Vermont
Accurately quantifying short-term displacement is challenging because it is difficult to account for people who may take refuge with community members rather than in places sponsored by governmental or non-governmental entities. During and after the July 2023 flood event in Vermont, the mosaic of housing assistance and emergency shelters included a FEMA Mass Care sheltering program as well as American Red Cross operated shelters in Barre, Johnson and Rutland counties. The initial need for shelter spiked around July 12, 2023, with almost 250 people sheltering at FEMA Mass Care. Need for shelter then declined rapidly and plateaued at around 50 people until July 22, 2023 (Kroll & Blondin, 2025; Figure 11-9). At least 314 households reported needing short-term shelter (Fountain & Duffort, 2023) following the July 2023 flooding event, even though far more households (estimated at 4,000 homes) were impacted (Fountain & Duffort, 2023).
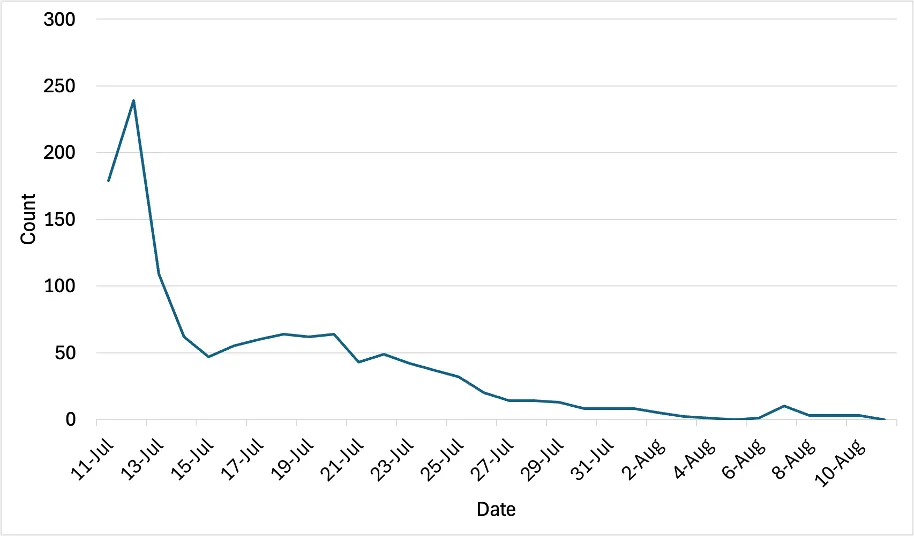
Source: Kroll & Blondin (2025)
Based on those that reported to Vermont 211 (Vermont Emergency Management, 2023a), there was clear need for shelter in the aftermath of the major flooding events of both July 2023 and July 2024 (Figure 11-10). In 2023, 329 people reported needing immediate shelter, mostly from Washington and Lamoille counties (157 and 79 individuals, respectively). In 2024, 84 people reported to 211 that they were in need of immediate shelter (Figure 11-10), with Caledonia and Washington counties most impacted (33 and 23 individuals reporting a need for immediate shelter in those two respective counties). In 2023, 6% of calls to Vermont 211 were for shelter, while in 2024 the average was 2.8%. This trend may indicate that short-term displacement was less extensive in 2024 or that fewer people relied on Vermont 211 in 2024.
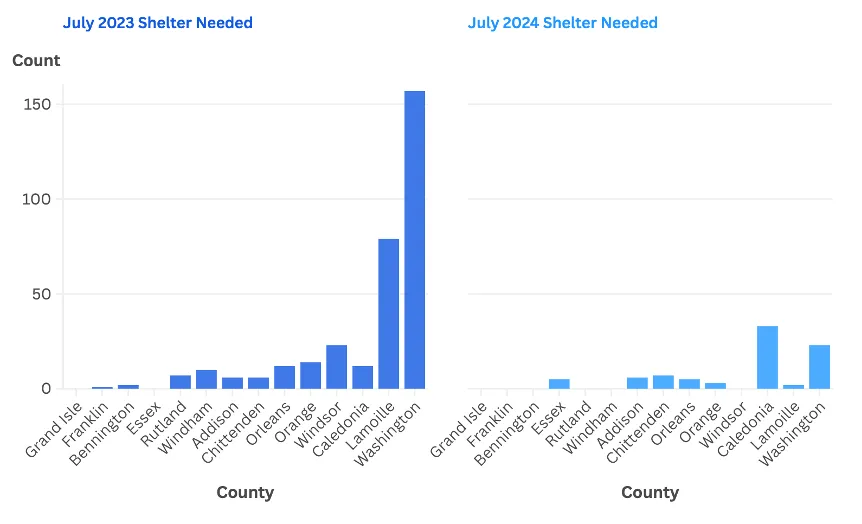
Source: Vermont Emergency Management (2023a)
Vermont 211 reports of uninhabitable homes are another indicator of potential displacement. Individuals that stated their home was uninhabitable did not always state that they needed shelter (i.e., they had another housing option, whether that be family, friends, etc.) Washington and Lamoille counties had the highest number of reports of an uninhabitable home in July 2023 with 364 and 183, respectively (Table 11-4). High reports of uninhabitable homes also came from the counties of Windsor (75), Caledonia (36), and Orange (31). After the July 2024 floods, the counties with the most reports of uninhabitable homes were Caledonia (93), Washington County (68), and Chittenden County (29).
FEMA Rental Assistance also indicates some degree of displacement due to flood impacts. In 2023, 1,234 owners and 383 renters applied for rental assistance (Kroll & Blondin, 2025). The most impacted and distressed area (Caledonia, Lamoille, Orleans, Rutland Washington, Windham and Windsor counties) totaled 1,122 owners and 358 renters with a sum of $3,840,182 in rental assistance dispersed. The 2023 flood displaced 0.19% of the total population of Vermont and required substantial resources to support short-term relocation to safe places (Kroll & Blondin, 2025)
County | July 2023 | July 2024 | All events |
|---|---|---|---|
Addison | 25 | 11 | 36 |
Bennington | 6 | 0 | 6 |
Caledonia | 36 | 93 | 129 |
Chittenden | 15 | 29 | 44 |
Essex | 2 | 8 | 10 |
Franklin | 1 | 0 | 1 |
Grand Isle | 0 | 0 | 0 |
Lamoille | 183 | 8 | 191 |
Orange | 31 | 4 | 35 |
Orleans | 20 | 13 | 33 |
Rutland | 16 | 1 | 17 |
Washington | 364 | 68 | 432 |
Windham | 17 | 0 | 17 |
Windsor | 75 | 0 | 75 |
All counties | 791 | 235 | 1,026 |
Source: Vermont Emergency Management (2023a)
After the July 2023 flooding, most counties had similar FEMA Rental Assistance payouts for both renters and owners of damaged properties (Figure 11-11). Windsor and Windham counties paid disproportionately higher payments for renters than owners, differing by 38% and 18%, respectively. Reasons for higher payments include housing availability, household composition, and differing requirements for housing (e.g., family size).
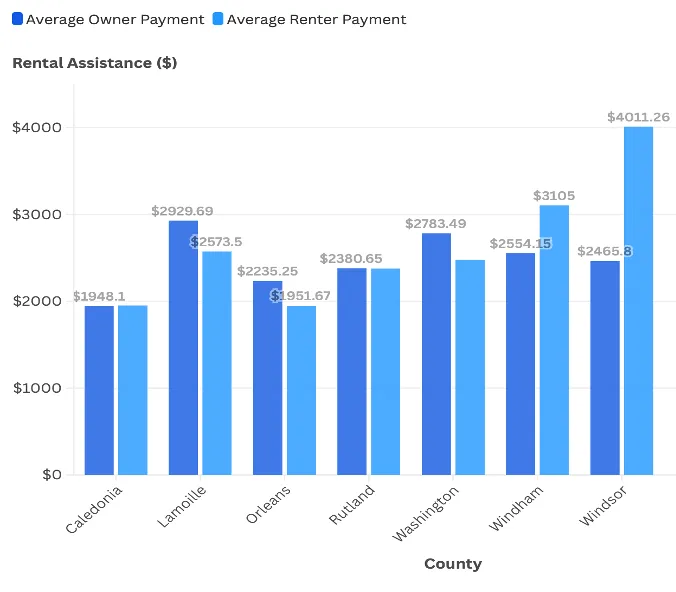
Source: Kroll & Blondin (2025)
Planned movements and migration in Vermont
Planned movement differs from displacement in its voluntariness (Figure 11-7). Moving out of harm’s way—voluntarily or involuntarily—is a common way to reduce physical harm against both sudden and slow onset climate hazards. For migration to be adaptative (as opposed to coping or maladaptive), voluntary conditions are necessary. Migration away from vulnerable areas and communities has cascading impacts on both local and regional economies and communities (Marandi & Main, 2021).
Climate hazards outside of Vermont are projected to intensify within the U.S. and globally. It is not known to what degree climate-related sudden events or slow processes will lead to population movements away from coastal areas impacted by sea-level rise and wildfire-prone areas and into Vermont (International Organization for Migration, 2024). These movements into Vermont from outside (in-migration) may be considered adaptation to climate change. There are at least three interacting communities to consider in terms of human migration under climate change: 1) the community of migrants themselves; 2) the community of origin; and 3) the community of destination (Gemenne & Blocher, 2017). A determining factor that is largely unknown is how adaptation (or maladaptation) will be manifested in each of these populations over time (Khavarian-Garmsir et al., 2026).
Concerns about Vermont being able to accommodate a large influx of people as a “climate haven” (Bergman, 2023; D’Auria, 2025) relate to the capacity for communities to sustain their existing populations while receiving migrants due to constraints in infrastructure (e.g., housing stock and wastewater management), geography (e.g., flood vulnerability), and socioeconomics (e.g., affordability and social inclusion).
There is little evidence of overwhelming climate migration into Vermont in present and future projections; however, this is not the complete story (Table 11-5). There are currently no clear trends in migration across international borders (e.g., due to aridification reducing crop yields) or movement within the U.S. (e.g., due to heatwaves or socioeconomic factors like amenities; Clark et al., 2022; Feng et al., 2010; Hoffmann et al., 2024; Mazzoleni et al., 2026). It is clear that there is great potential for human movement out of harm’s way in pursuit of short-term safety and long-term relocation, whether adaptive or not (International Organization for Migration, 2024).
Climate impacts on changes in populations in Vermont can be direct (e.g., displacement and out-migration due to riverine flooding) and indirect (e.g., voluntary in-migration due to sea-level rise outside the state). Projections for amplifications and displacement by 2100 by county (Table 11-5) estimate that Chittenden, Bennington, and Windsor counties will have no population change or have increases of up to 10,000 individuals by 2100 due to amplification (i.e., where fertility rates and aging populations are included at the destination based on the assumption that migrants are often younger) and displacement (Hauer et al., 2024). All other counties are projected to either have no population change or losses of up to 10,000 individuals by 2100 (Hauer et al., 2024) Compounding impacts of climate change like riverine flooding impacting livelihoods and/or poverty are not included in these projections. Due to these uncertainties, projections should be considered conservative (Table 11-5).
A different study projects a population increase of 0–1% in Chittenden and Lamoille counties by 2053 due to climate change-induced sea level rise (Shu et al., 2023; Table 11-5). Bennington Essex, Rutland, Windham, and Windsor counties are projected to have population decreases of –3% to –1%. Grand Isle, Franklin, Orange, Caledonia, Orleans, Addison and Washington are projected to have population declines of 0% to –1% by 2053 (Shu et al., 2023).
County | Amplification due to Population for 2100 under SSP2-RCP4.5 | Displacement due to Population for 2100 under SSP2-RCP4.5 | Projected population change under SSP2- RCP4.5 for 2053 |
|---|---|---|---|
Addison | 0 to –10,000 | 0 to –10,000 | -1% to 0% |
Bennington | 0 to +10,000 | 0 to +10,000 | -3% to –1% |
Caledonia | 0 to –10,000 | 0 to –10,000 | -1% to 0% |
Chittenden | 0 to +10,000 | 0 to +10,000 | 0% to 1% |
Essex | 0 to –10,000 | 0 to –10,000 | -3% to –1% |
Franklin | 0 to –10,000 | 0 to –10,000 | -1% to 0% |
Grand Isle | 0 to –10,000 | 0 to –10,000 | -1% to 0% |
Lamoille | 0 to –10,000 | 0 to –10,000 | 0% to 1% |
Orange | 0 to –10,000 | 0 to –10,000 | -1% to 0% |
Orleans | 0 to –10,000 | 0 to –10,000 | -1% to 0% |
Orleans | 0 to –10,000 | 0 to –10,000 | -1% to 0% |
Rutland | 0 to –10,000 | 0 to –10,000 | -3% to –1% |
Washington | 0 to –10,000 | 0 to –10,000 | -1% to 0% |
Windham | 0 to –10,000 | 0 to –10,000 | -3% to –1% |
Source: Amplification and displacement for 2100 under SSP2-RCP4.5 (Hauer et al., 2024); project population under SSP2-RCP4.5 for 2053 (Shu et al., 2023)
Migration is fundamental to human existence, as we live and depend on ever-changing ecological systems. Social, economic, and political systems determine vulnerability in terms of mobility and exposure (Figure 11-7). The interactions between the community of origin, those migrating and the community of destination will determine not only the vulnerability of communities to climate change impacts, but collective socioeconomic and environmental well-being. Whether it be internal or international migration, xenophobia threatens the opportunities for climate-induced migration to foster demographic growth and racial and cultural diversification in Vermont, thus limiting local economic revitalization and regional adaptation to climate change. (A Northeast Safe & Thriving for All (NEST), 2023). Nurturing welcoming and inclusive environments for migrants requires expansion of affordable housing and healthcare, resilient infrastructure, employment opportunities, and social and legal infrastructure.
11.4 Economy
11.4.1 Vermont’s economy at a glance
Vermont's economy faces significant and growing risks from climate change. With a GDP of approximately $36.9 billion (inflation adjusted or chained to 2017 U.S. dollars) in 2025 and a workforce of roughly 251,000 people, the state has limited fiscal capacity to absorb repeated climate shocks (U.S. Bureau of Economic Analysis, 2026c; U.S. Census Bureau, 2022; U.S. Census Bureau of Labor Statistics, 2026). Climate risk can stress economies in two ways: 1) physical risks arise from direct damage to productive assets, disruption of supply chains, reduced labor productivity, declines in agricultural output, and increased public expenditure on disaster response and recovery; 2) transition risks emerge from the structural changes associated with shifting to a low-carbon economy, with implications for energy costs, capital investment, and labor market adjustment. Both types of risks carry macroeconomic consequences, including effects on GDP, household income, wealth distribution, employment, inflation, and public finances.
Vermont has the smallest economy in the U.S.; the state lost about $3.7 billion during the COVID-19 pandemic but GDP has since bounced back, similarly to the rest of the country (Figure 11-12). Vermont’s economy is heavily service-oriented, largely dominated by tourism, professional services (e.g., scientific, technical, administrative services), and healthcare, with some recent growth in the technology sector (Table 11-6). Ninety-five percent of Vermont business are small businesses, and they employ 62% of the population (U.S. Census Bureau, 2022). The University of Vermont and the University of Vermont Medical Center are anchor institutions and reflect the high proportion of employment in healthcare.
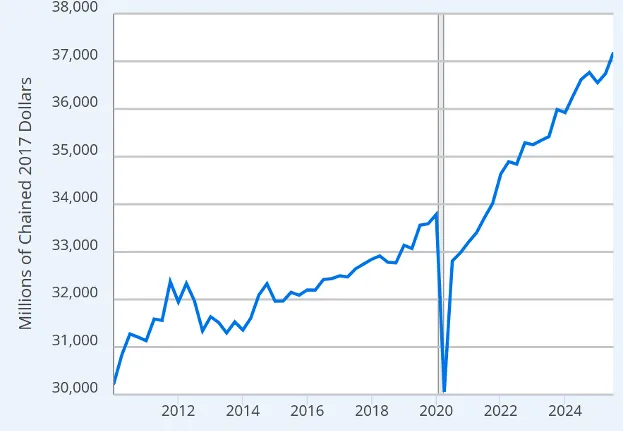
Source: U.S. Bureau of Economic Analysis (2026a)
| Sector | GDP ($million) |
|---|---|
Finance, insurance, real estate, rental, and leasing | 6,660.20 |
Finance and insurance | 1,753.70 |
Real estate and rental and leasing | 4,908.40 |
Professional and business services | 5,121.90 |
Educational services, health care, and social assistance | 4,971.80 |
Healthcare and social assistance | 4,150.20 |
Educational services | 825.10 |
Government and government enterprises | 4,792.70 |
Federal civilian | 1,059.30 |
Military | 174.70 |
State and local | 3,557.80 |
Manufacturing | 2,638.00 |
Food and beverage and tobacco product manufacturing | 700.00 |
Wood product manufacturing | 82.20 |
Retail trade | 3,125.20 |
Arts, entertainment, recreation, accommodation, and food services | 2,537.90 |
Arts, entertainment, and recreation | 461.40 |
Accommodation and food services | 2,077.30 |
Wholesale trade | 1,465.40 |
Construction | 1,161.00 |
Information | 1,389.90 |
Utilities | 857.00 |
Other services (except government and government enterprises) | 723.50 |
Transportation and warehousing | 560.20 |
Agriculture, forestry, fishing and hunting | 422.70 |
Farms | 452.00 |
Forestry, fishing, and related activities | 107.90 |
Mining, quarrying, and oil and gas extraction | 186.90 |
All industry total | 36,398.90 |
Source: U.S. Bureau of Economic Analysis (2026b)
Note: This table follows North American Industry Classification System classifications including sub-industry disaggregation for select relevant sectors. Not all sub-industries are shown so the figures will not add up to the aggregated number. The real estate sector shows a large GDP contribution, but this figure is somewhat misleading, as it includes imputed rents, that is, the methodology assumes that homeowners pay rent to themselves. This is not actual economic activity. Vermont has a high home ownership rate of 74%, so a large share of its real estate GDP is imputed rents (Federal Reserve Bank of St. Louis, 2025).
Retail, trade, accommodation, and food services together account for over a quarter of all employment (26.4%), which largely fall under tourism (Table 11-7). State and local governments also employ a large share of workers (18.4%). Vermont has fewer employees in higher-wage, higher-productivity sectors (e.g., information, finance and insurance, professional and technical services) relative to national averages, but more employees in health care, education, retail, and accommodation sectors, which is consistent with a rural, aging, tourism-driven state economy that is heavily oriented toward localized services (Table 11-7).
Sector | Jobs in Vermont | % Jobs in Vermont | National jobs | % National jobs |
|---|---|---|---|---|
Public administration | 53,259 | 17.2 | 22,420,669 | 14.5 |
Federal | 6,859 | 2.2 | 3,001,207 | 1.9 |
State | 16,127 | 5.2 | 4,819,889 | 3.1 |
Local | 30,273 | 9.8 | 14,599,573 | 9.4 |
Health care and social assistance | 51,343 | 16.6 | 22,217,638 | 14.3 |
Retail trade | 35,820 | 11.6 | 15,479,194 | 10 |
Accommodation and food services | 30,369 | 9.8 | 14,092,895 | 9.1 |
Manufacturing | 27,434 | 8.9 | 12,733,350 | 8.2 |
Professional, scientific, and technical services | 17,851 | 5.8 | 10,781,508 | 7.0 |
Construction | 16,196 | 5.2 | 8,135,442 | 5.2 |
Administrative and support and waste management and remediation services | 13,370 | 4.3 | 9,123,838 | 5.9 |
Educational services | 11,039 | 3.6 | 3,204,582 | 2.1 |
Other services (except public administration) | 8,830 | 2.9 | 4,666,503 | 3.0 |
Wholesale trade | 8,822 | 2.9 | 6,106,692 | 3.9 |
Finance and insurance | 8,429 | 2.7 | 6,290,311 | 4.1 |
Transportation and warehousing | 6,411 | 2.1 | 6,562,468 | 4.2 |
Arts, entertainment, and recreation | 4,914 | 1.6 | 2,605,233 | 1.7 |
Agriculture, forestry, fishing and hunting | 3,601 | 1.2 | 1,254,363 | 0.8 |
Real estate and rental and leasing | 3,008 | 1.0 | 2,406,045 | 1.6 |
Management of companies and enterprises | 2,035 | 0.7 | 2,613,063 | 1.7 |
Utilities | 1,210 | 0.4 | 589,311 | 0.4 |
Mining, quarrying, and oil and gas extraction | 629 | 0.2 | 586,238 | 0.4 |
Information | 0 | 0.0 | 2,904,986 | 1.9 |
Total employment | 309,138 |
| 154,990,441 |
|
Source: U.S. Census Bureau of Labor Statistics (2026)
Note: This table follows North American Industry Classification System classifications. Sub-industry disaggregation is included for select relevant sectors
The agriculture, forestry, fishing, and hunting sectors are a relatively small portion (1.3%) of GDP (Table 11-6). However, these sectors provide input for value-added goods and services such as specialty foods—notably maple syrup and cheese—as well as wood manufacturing. These sectors provide the basis for a significant part of the appeal of the tourism and recreation sector (see Outdoor Recreation & Tourism 9.4) and are critical for food security in Vermont (see Agriculture & Food Systems 6.4.6)
11.4.2 Sectoral vulnerabilities
Tourism
Tourism-oriented sectors are highly susceptible to climate change (see Outdoor Recreation and Tourism, Figure 9-6). Fall and spring are becoming more variable and unpredictable in length and weather, with direct consequences for visitor volumes and spending patterns (see Outdoor Recreation and Tourism 9.4 and 9.6). Retail businesses and restaurants are concentrated in downtown areas, often situated within floodplains and river corridors due to a legacy of historical river-based development tied to timber shipping. Many businesses in Vermont without a climate preparedness program (see 11.5.5) failed within three years of a flood (Johanna de Graffenreid, pers. comm., October 29, 2025). There is evidence that extreme heat in New England can disrupt downtown traffic, hurting business (Van Leuven & Schaefer, 2025). In the aftermath of the July 2023 and July 2024 floods in Vermont, the Business Emergency Gap Assistance Program (BEGAP) provided emergency matching stopgap assistance to businesses. Securing funding to make this a long-term and reliable program for businesses as well as supporting proactive resilience planning prior to a disaster is a priority of the Vermont Resilience Implementation Strategy (Vermont Agency of Natural Resources & Vermont State Treasurer’s Office, 2025).
Healthcare
Extreme weather exacerbated by climate change will increase health burdens, leading to Vermonters needing to use more health care services (see Human Health 10.0). Vermont’s healthcare costs are among the highest in the country, as are health insurance premiums (Figure 11-13). An increase in utilization of health care services could contribute to overall rising health care expenses for people, including out-of-pocket costs and insurance premiums. Premiums are expected to rise as a consequence of the cuts to Medicaid and the Affordable Care Act premium tax credit enhancements in the 2025 Budget Reconciliation Act (Center on Budget and Policy Priorities, 2025). These cuts increase the number of people who are uninsured, further increasing communities’ vulnerability (Center on Budget and Policy Priorities, 2025). Blue Cross Blue Shield Vermont, the state’s major insurer, drained its reserves in the last few years, though it seems to have made a recovery in 2025 (Duffort, 2026). Climate change impacts may contribute to higher costs for healthcare in the future, thereby threatening an already fragile system.
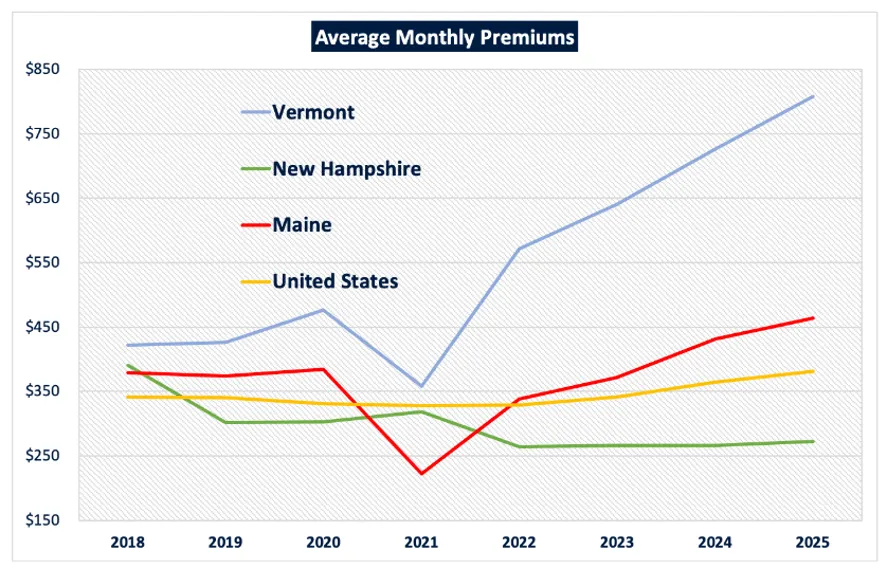
Source: Vermont Healthcare 911 (2026)
Public sector
The government is likely to experience fiscal instability from having to respond to climate change, especially in combination with other shocks or stressors (e.g., pandemics, shifts in federal government funding priorities). In Vermont, some towns took on debt to complete necessary infrastructure repair following summer floods because the costs exceeded their annual budgets. They were thus reliant on FEMA funds, which have been slow to be disbursed or have been denied in some cases (Giles, 2026; Guber, 2025; see 11.6.6).
Agriculture
Agriculture is vulnerable to climate risk (see Agriculture and Food Systems 6.4). Some farmland is in floodplains, thereby making farms directly exposed to flooding events that have become more frequent and severe (see Climate Change in Vermont 2.6.2). The July 2023 floods caused an estimated $16 million in agricultural damages (Vermont Climate Council, 2025). Longer-term rises in temperature and shifts in precipitation patterns can also impact agricultural yields (see Agriculture and Food Systems 6.4). Given agriculture's role as a supplier to value-added food manufacturing and as a foundation for the tourism sector, climate impacts on farming can transmit across multiple parts of the Vermont economy. Moreover, a higher proportion of people are employed in agriculture in Vermont compared to national levels (Table 11-7).
Labor and employment
Climate change affects labor productivity through multiple pathways. Heat stress reduces the physical capacity and cognitive performance of workers, particularly in physically demanding outdoor roles (see Human Health 10.3.1). Extreme weather events, especially flooding, can prevent workers from reaching their workplaces and disrupt business operations for extended periods (see 11.5.3). These effects fall disproportionately on lower-wage workers in agriculture, construction, and recreation, which are all sectors with the least flexibility to adapt working hours or conditions.
Climate change can also lead to job losses in affected sectors, though research in this area is scarce. In Vermont, unemployment insurance claims increased after the 2023 floods (Public Assets Institute, 2023). One national level study in the U.S. notes an increase in the unemployment rate after a shock that is persistent and becomes more severe over time (Kim et al., 2025). As unemployment increases, it can reduce purchasing power and demand for goods and services, with the potential to slow broader economic activity beyond the sectors initially affected by climate events.
Transition risk
Vermont is comparatively less exposed to transition risk (i.e., structural changes associated with shifting to a low-carbon economy) than most other states. The state has no significant fossil fuel extraction or production assets, meaning it faces little risk of stranded assets or workforce displacement in carbon-intensive industries as the economy shifts toward lower emissions. Vermont's electricity grid is already high in the share of renewable energy, reducing the costs associated with energy transition (see Energy 8.3.1 and Human Health 10.11.6). However, there are some areas that may be affected by transition risk. Vermont's building stock is older than the national average and heavily reliant on fuel oil and propane for heating. Switching to heat pumps has high upfront costs for homeowners, but it is cheaper in the long run (see Energy 8.5.2 and Human Health 10.11.4). Similarly, the transportation sector remains heavily dependent on fossil fuels, and the transition to electric vehicles also has upfront costs that may be unevenly distributed across income levels. Further, Vermont has not been able to meet its GHG reduction requirements under the Global Warming Solutions Act (GWSA), leaving the state at risk for lawsuits (Vermont Climate Council, 2025).
11.5 Disaster management
Climate change is projected to increase the intensity and frequency of natural hazards in Vermont that require preparedness and response (see Climate Change in Vermont 2.6). More frequent disasters can undermine individual and collective capacities to respond to future disasters and to slow-onset climate change. Taking proactive actions within each phase of the disaster management cycle, including disaster preparedness, response, recovery, and mitigation can increase community resilience and minimize losses to individuals and communities (Figure 11-14).
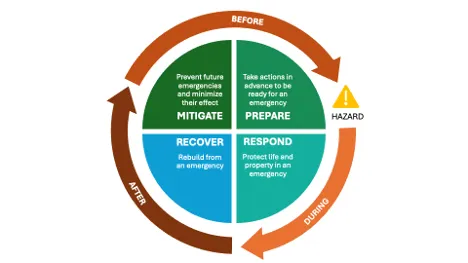
Source: Fairfax County (2019)
Preparedness for a hazard takes place prior to the incident to reduce the adverse impacts on society, economy, and ecosystems. Anticipation of risks and establishing a dialogue about these risks between the public and government leaders is paramount. Response to the immediate impacts of natural hazards occurs during the event. Response actions aim to reduce loss to individuals, communities, and society by protecting life, property, and resources. Recovery comes after the immediate response to the hazard and is considered a longer-term process of rebuilding and regeneration. The degree and manner to which a system can recover defines its resilience. When a system can return to a state like the original one, or a more desirable state, the system can be characterized as resilient and adaptive. Mitigation of future impacts can occur as part of the recovery stage. Lessening impacts requires the use of resources to bring greater resilience and reduce vulnerability in social, economic, and environmental systems. The following subsection provides an overview of the response to various disasters impacting Vermont from 2020–2025 with particular attention given to the flooding events of July 2023 and July 2024.
11.5.1 Disaster declarations
FEMA disaster declarations—made at the discretion of the sitting U.S. President—authorize federal government assistance in the event of immediate threats and severe damage from natural hazards. While the number of studies in the U.S. is small, existing studies have shown that federal disaster assistance is impacted by politics. FEMA disaster declarations and allocation of funds are influenced by both the president and Congress (Garrett & Sobel, 2003). Factors such as whether the president is running for re-election, whether the disaster is in a swing state, or if the state is otherwise important to the president were all found to be significant (Downton & Pielke, 2001; Garrett & Sobel, 2003; Sabol et al., 2026). The amount of aid given varies widely, from 5% to 200% of estimated damages (Deryugina, 2017). Most recently, the federal administration denied Vermont’s request for a Major Disaster Declaration for floods that occurred in the Northeast Kingdom in 2025, despite estimated damages exceeding the state’s $1.2 million threshold for disaster declarations (Cotton, 2026).
Vermont has experienced several disasters related to flooding and severe weather that have been authorized for a FEMA declaration (Table 11-8). There are two types of declarations. Emergency Declarations provide aid to supplement states and local governments in providing emergency services. Major Disaster Declarations are declared when the U.S. President deems it beyond the capabilities of states and local governments to respond. These provide wider assistance to both individuals and subnational governments for emergency and permanent work (FEMA, 2025). In the past 5-years, 25% of all disaster declarations were granted for every county in Vermont (EM-3567-VT, EM- 3595-VT, DR-4720-VT, EM-3609-VT). For the other 75% of disasters, most designated counties were in the northern and central portion of Vermont. One event (DR-4621-VT) exclusively impacted southern Vermont.
FEMA declarations trigger several federal mechanisms for response and recovery. Federal assistance for recovery and response comes in programmatic streams that include Individuals and Households Program (IHP), Public Assistance (PA), and National Flood Insurance Programs (NFIP). Mitigation of hazards is supported under the Hazard Mitigation Grant Program (HMGP) and the Building Resilient Infrastructure and Communities (BRIC) program. HMGP and BRIC have been stymied by legal challenges under changing federal priorities (Angueira, 2025; Raymond, 2025).
Total disbursements from FEMA and the U.S. Department of Housing and Urban Development to Vermont amounted to over $350 million under these programs from 2021–2025 (Table 11-9). The highest PA ($200 million) and IHP funding ($26 million) were in 2023, following the severe flooding event in July of that year (Figure 11-15).
Hazard/Disaster | FEMA ID* | Frequency/ Incident Period | Designated Counties |
|---|---|---|---|
Severe Storms and Flooding | DR-4816-VT | August 22–August 24, 2024 | Lamoille |
Tropical Storm Depression Debby | EM-3609-VT | August 8–August 10, 2024 | All |
Severe Storms, Flooding, Landslides, and Mudslides | DR-4826-VT | July 29–July 31, 2024 | Caledonia, Essex and Orleans |
Severe Storms, Flooding, Landslides, and Mudslides | DR-4810-VT | July 9–July 11, 2024 | Addison, Caledonia, Chittenden, Essex, Lamoille, Orange, Orleans, Washington |
Severe Winter Storm | DR-4770-VT | January 9–January 13, 2024 | Chittenden, Essex, Franklin, Lamoille, and Orleans |
Severe Storms and Flooding | DR-4762-VT | December 18–December 19, 2023 | Essex, Lamoille, Orange, Orleans, Rutland, Windham, Windsor |
Severe Storms and Flooding | DR-4744-VT | August 3–August 5, 2023 | Addison |
Severe Storms, Flooding, Landslides, and Mudslides | DR-4720-VT | July 7–July 21, 2023 | All |
Flooding | EM- 3595-VT | July 9–July 17, 2023 | All |
Severe Storm and Flooding | DR-4695 | December 22–December 24, 2022 | Chittenden, Essex, Franklin, Grand Isle, Lamoille, Orange, Orleans, Washington |
Tropical Storm Henri | EM-3567-VT | August 22–August 29, 2021 | All |
Severe Storm and Flooding | DR-4621-VT | July 29–July 30, 2021 | Bennington and Windham |
Source: FEMA (2026a)
Note: *DR signifies Major Disaster Declaration. EM signifies Emergency Declaration
FEMA Program | Definition | Amount | Status |
|---|---|---|---|
Individuals and Households Program (IHP) | Financial and direct services to eligible individuals and households affected by a disaster who have uninsured or under-insured necessary expenses and serious needs | $39,927,573 | Active |
Public Assistance (PA) | Supplemental grants to state, tribal, territorial, and local governments and certain types of private non-profits so communities can quickly respond to and recover from major disasters or emergencies | $258,036,974 | Active
|
Hazard Mitigation Grant Program (HMGP)
| Funding to state, local, tribal and territorial governments to develop hazard mitigation plans and rebuild in ways that reduce or mitigate future disaster losses in their communities | N/A | No presidential approvals granted as of December 11, 2025 |
Building Resilient Infrastructure and Communities (BRIC) program | Supports states, local, and territorial governments and Tribal Nations as they work to reduce their hazard risk | N/A | Cancelled in April 2025; ordered to be reinstated in December 2025 |
National Flood Insurance Program (NFIP) | Flood insurance to property owners, renters, and businesses, to help them recover faster when floodwaters recede | $50,620,956 | Active |
Source: FEMA (2026c); Labowitz (2025); Raymond (2025)
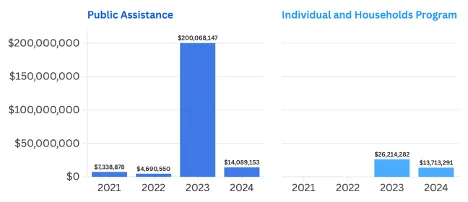
Source: FEMA (2026b)
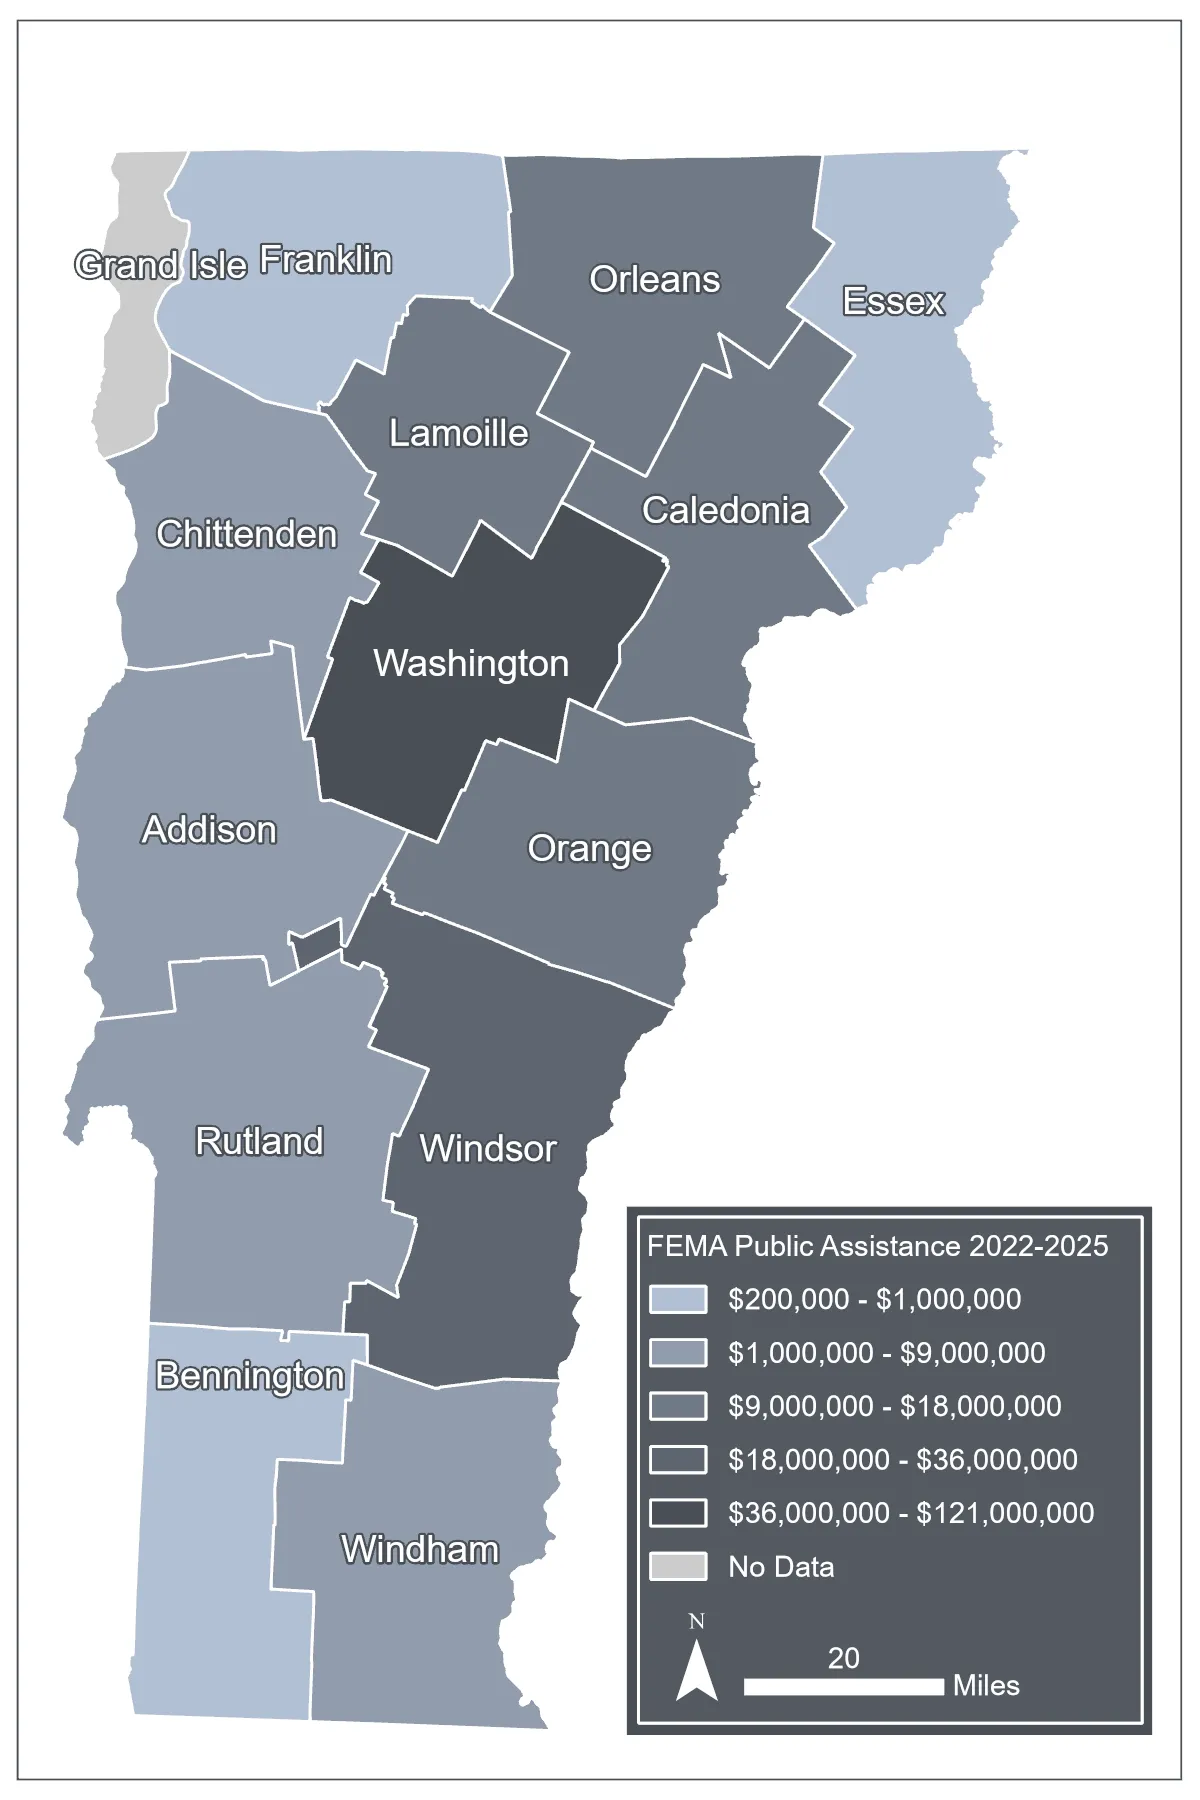
Between 2022–2025, all Vermont counties received PA payments, except for Grand Isle, which was limited in the disasters declared (Figure 11-16). Washington County had the largest disbursement under PA at nearly $121 million.
Source: FEMA (2026c); PolicyMap (2025)Note: Visualization by Hannah C. Turner
Source: FEMA (2026c); PolicyMap (2025)
Note: Visualization by Hannah C. Turner
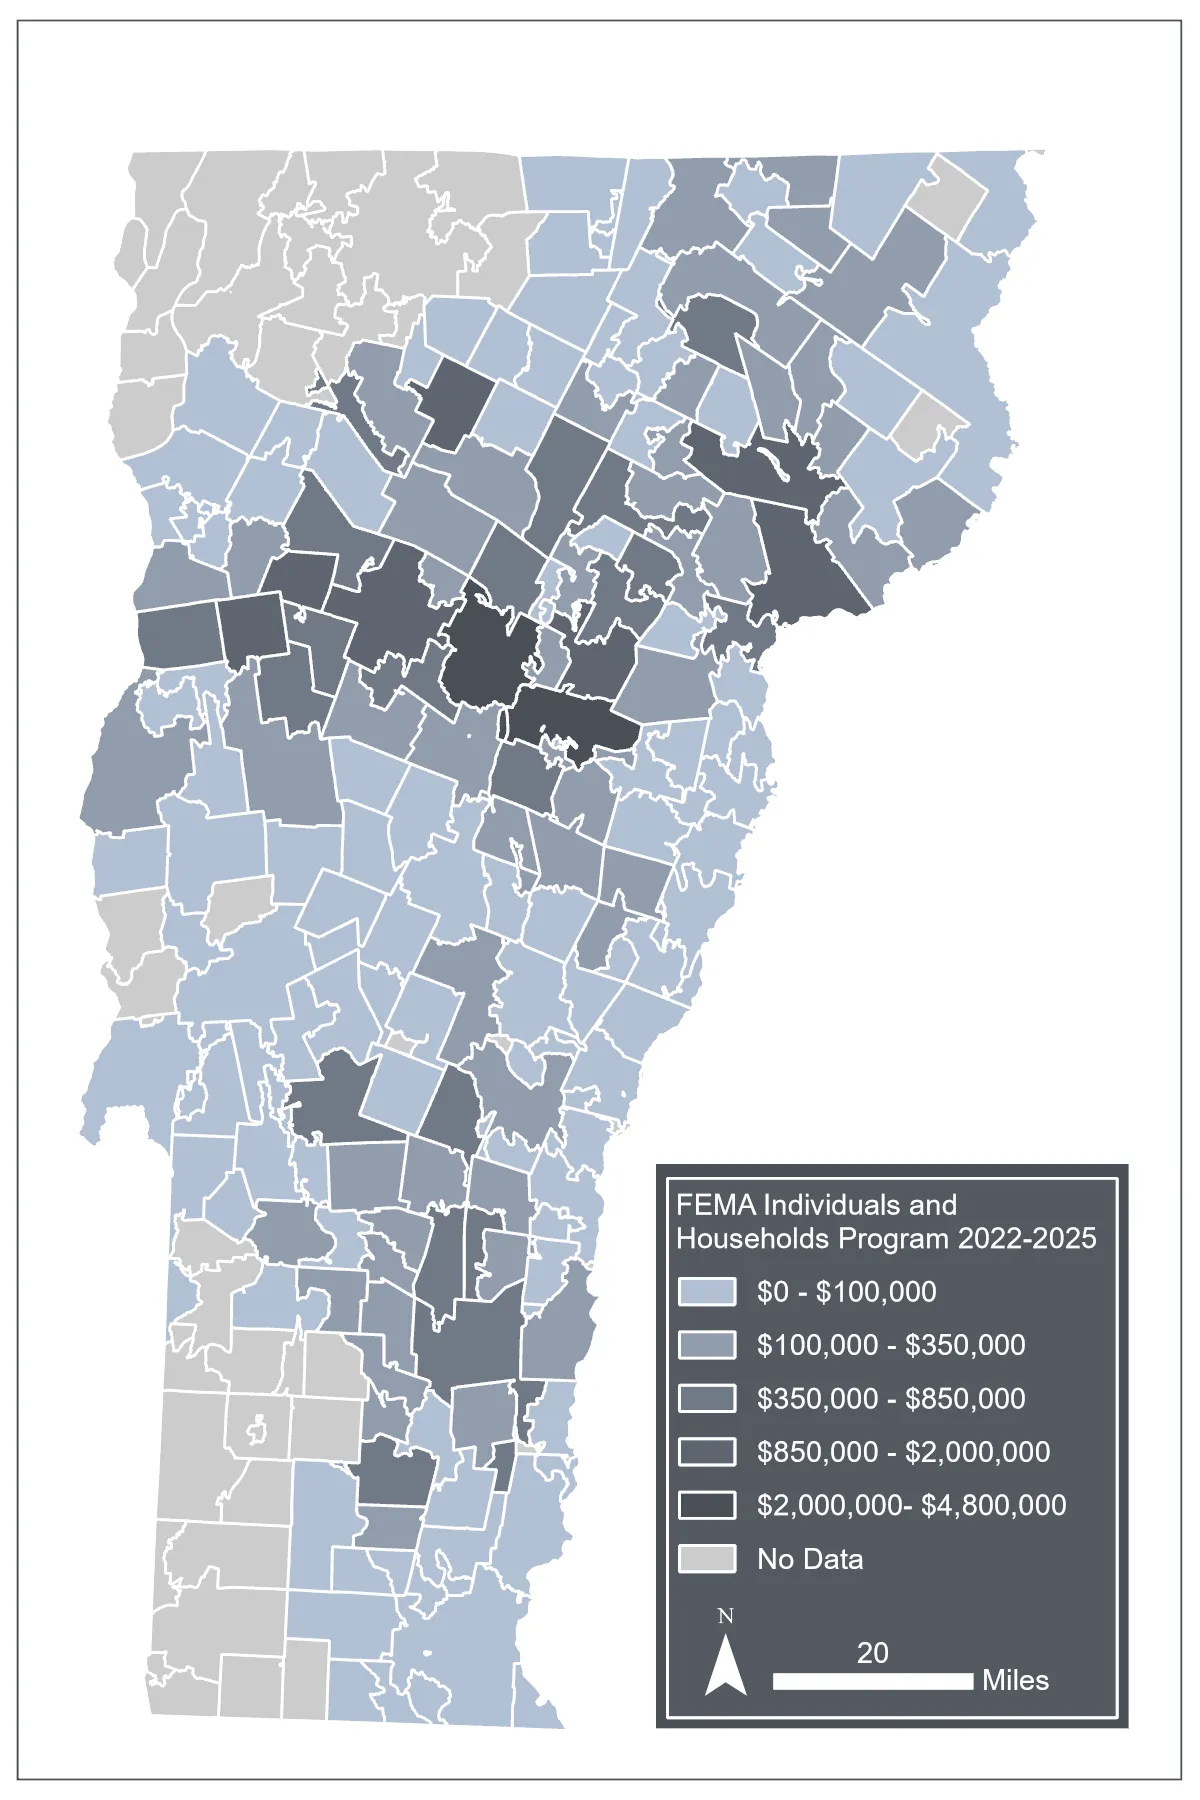
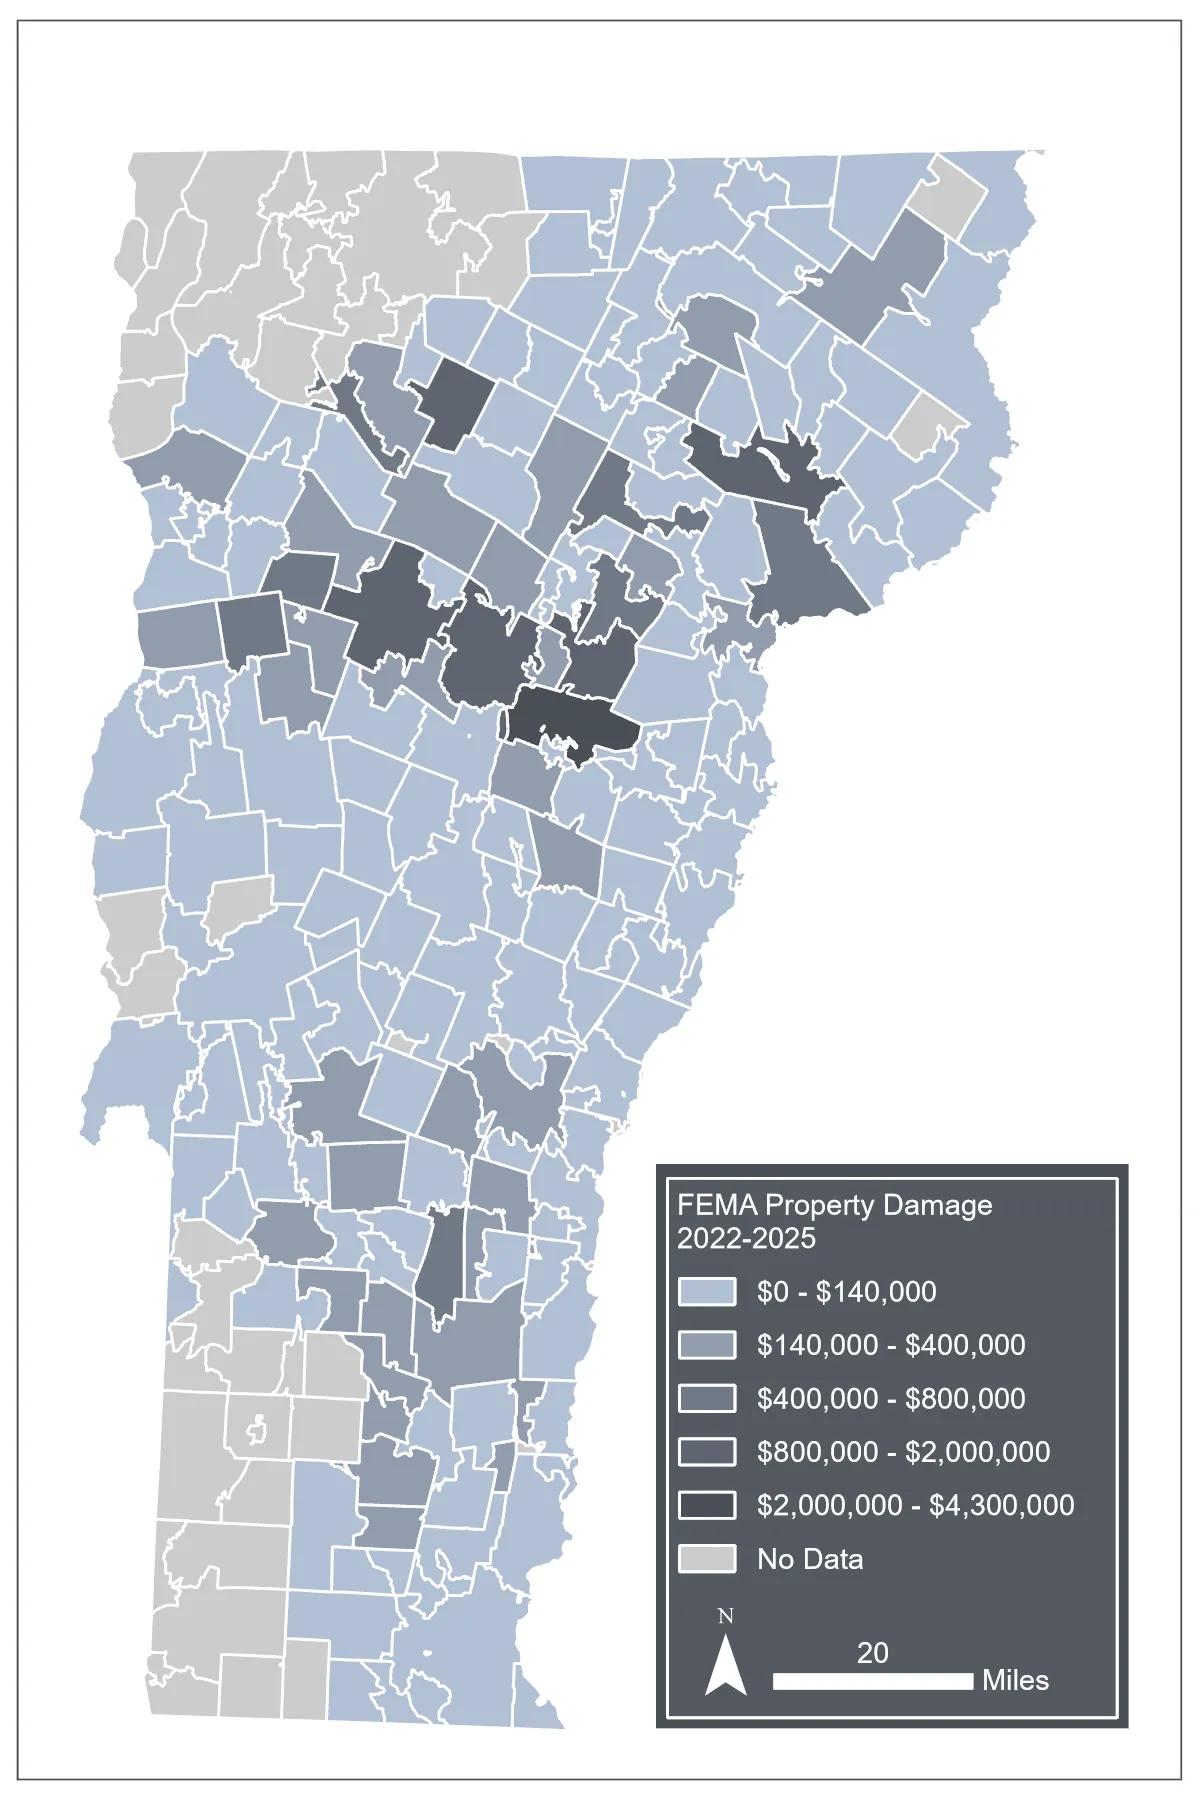
Individual assistance through IHP from 2022–2025 was distributed across Vermont, with a significant portion going to Washington and Caledonia counties, which reported the highest number of uninhabitable homes after flooding events (Figure 11-15; see Human Health Figure 10-8). Property damage in the state was estimated at $28 million, with the most substantial damage being concentrated along the Winooski River, southern Chittenden County, Washington County, and several areas in the northeast and southeast (Figure 11-18).
Source: FEMA (2026c); PolicyMap (2025)
Note: Visualization by Hannah C. Turner
11.5.2 Response
Risk and crisis communication during the 2023 Vermont floods
Months before the Great Vermont Flood of 2023, emergency managers and other stakeholders involved in flood preparation and response identified localized flash flooding, rapid fluvial erosion, and concerns related to dam operations during flood events as some of the region’s most consequential hazards—risks that became apparent once the storms intensified (Soares et al., 2026).
The July 2023 flooding event reinforced the importance of risk and crisis communication in community preparedness, protective actions, and emergency coordination during extreme weather events. The Winooski watershed—one of the most affected regions—provides a detailed view of how emergency managers, planners, and local officials interpret threats, issue warnings, and support vulnerable residents under rapidly evolving conditions.
For the Winooski watershed, some communication practices worked effectively: Vermont Emergency Management’s (VEM) recurring pre-storm coordination calls helped align local officials; National Weather Service’s alerts provided steady meteorological updates; and mapping tools such as FEMA flood maps, though unevenly adopted, offered situational insights. However, some gaps became apparent. Warning terminology—such as flash flood watch, warning, and emergency—was largely misunderstood by the public. Generic protective instructions lacked the specificity required for localized decision-making. Confusion emerged around dam-safety messaging, where technical terms unintentionally suggested structural failure risks that never happened. Governance challenges further complicated communication: a decentralized emergency response system placed considerable responsibility on local officials who had variable training and capacity. Several local officials in smaller towns are unpaid as there was not a commonly adopted mechanism for public non-emergency personnel to shift focus to response in times of need, which made the response process more complex (Soares et al., 2026).
Inequities in information access surfaced; vulnerable groups (e.g., older adults, non-English speakers, low-income residents, manufactured-home park communities) had limited access to real-time updates, especially when messages were distributed primarily through digital platforms or opt-in systems. Message fatigue resulted when alerts were broadcast to individuals outside the hazard zone (Soares et al., 2026).
Despite these challenges, community mobilization played a vital role. Nonprofits, grassroots organizations, and volunteer groups provided substantial recovery support. Expanding their involvement during the pre-crisis stage would strengthen preparedness and outreach, particularly for populations traditionally left out of official communication channels.
The work by local officials and emergency managers in response to the Great Vermont Flood of 2023 was commendable. However, with a climate expected to produce increasing flood events, communication governance and flow to and from local and state officials will need to be improved. Strengthening these systems will help reduce risks to both human life and critical infrastructure in future events (Box 11-1).
Box 11-1 Recommendations for strengthening flood risk and crisis communication
1. Improve clarity, relevance, and accessibility of warning messages
- Use clear, plain-language instructions that include what the threat means, why it matters, and what specific action to take.
- Tailor messages to specific locations and scenarios, avoiding one-size-fits-all guidance that can cause confusion.
- Replace jargon with straightforward explanations.
- Integrate multilingual communication and pre-scripted translations to reach those with limited English proficiency.
- Ensure messages are accessible across digital and non-digital channels to avoid exacerbating a digital divide.
2. Strengthen communication governance and coordination
- Conduct pre-crisis gap analyses to clarify roles, responsibilities, and communication pathways among federal, state, local, and community actors.
- Develop standardized protocols for message creation and distribution to reduce conflicting or duplicative alerts.
- Expand staffing and technical support for roles that require both operational expertise and public-facing communication.
- Use geo-targeted alerts to minimize message fatigue and improve the relevance of warnings.
3. Expand support for vulnerable populations
- Build partnerships with community organizations, nonprofits, and local leaders before disasters to establish trust and communication pathways.
- Identify barriers faced by vulnerable groups (e.g., language, limited internet access, mobility challenges) to create tailored outreach strategies.
- Increase resources for agencies responsible for assisting at-risk populations, ensuring they have the capacity to provide timely and more effective communication.
- Involve community organizations that were able to effectively respond to past disasters in future planning
4. Improve integration and use of predictive and mapping tools
- Incorporate erosion risk, not just inundation, into community conversations and preparedness materials.
- Use mapping tools to support more precise, localized messaging that aligns with the public’s immediate decision-making needs.
11.5.3 Recovery
Long-term recovery groups
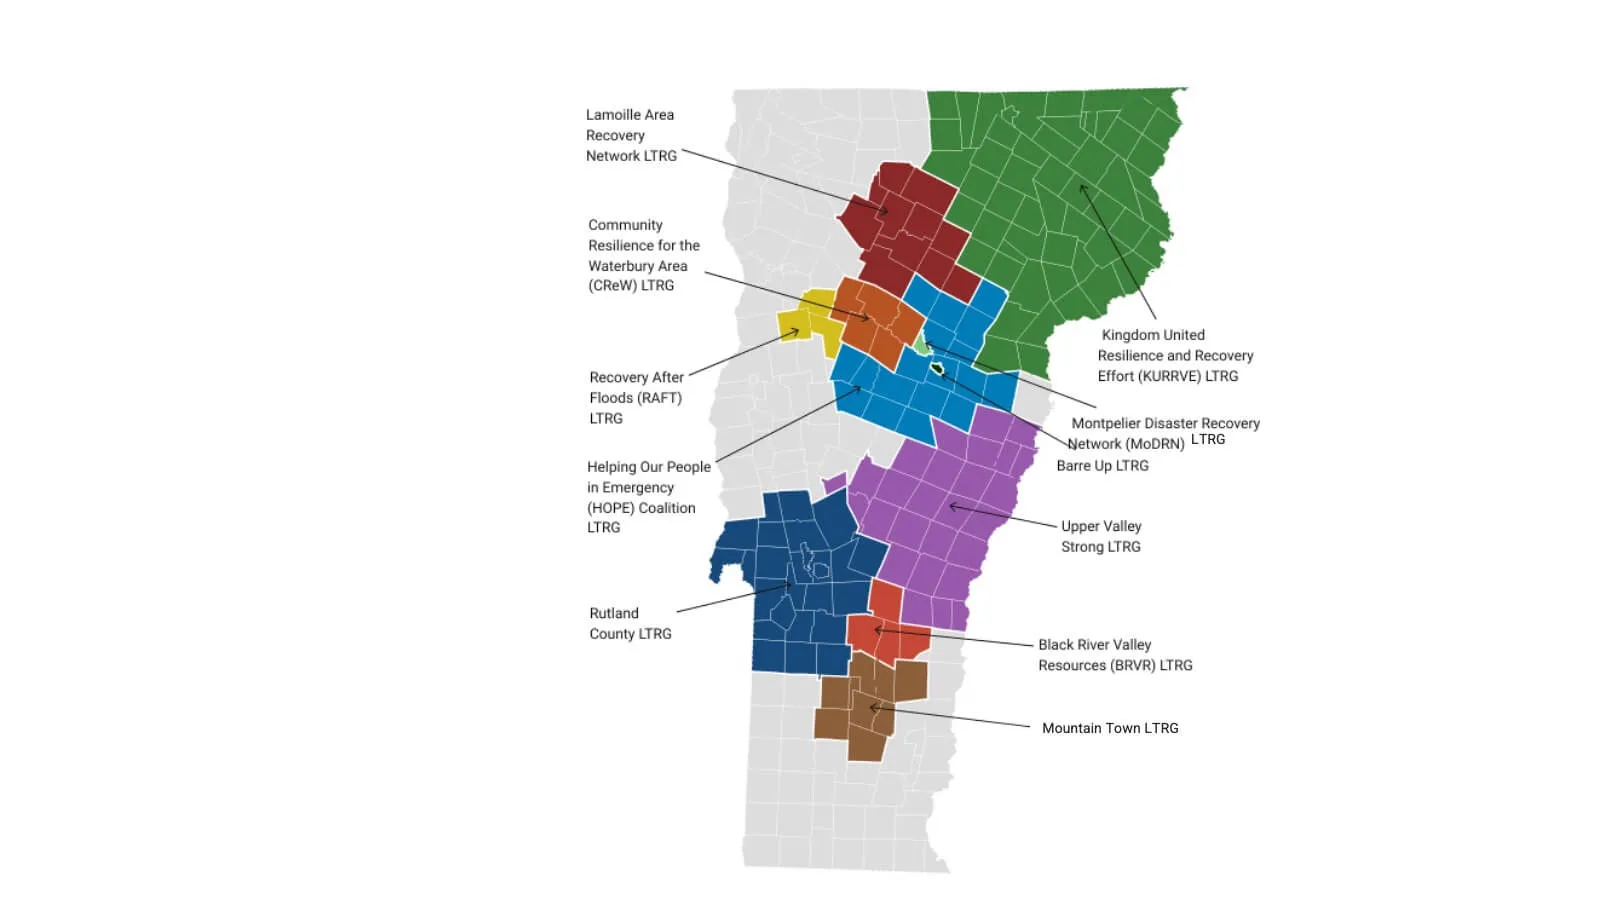
Locally led Long-Term Recovery Groups (LTRGs) exist throughout the state to bring together community organizations to help people with long-term recovery needs after a disaster (Figure 11-19). LTRGs are citizens-led non-profits that offer coordination of resources and volunteer recovery efforts and disseminate critical information about FEMA, state-led efforts, and local initiatives. Despite filling a vital niche in the state’s recovery apparatus, they remain under-resourced and are not written into emergency plans, consulted on recovery strategy, or considered experts on these matters, which undercuts their effectiveness. These groups include census tracts with a significant population experiencing poverty (U.S. Census Bureau, 2024c). For example, the Kingdom United Resilience and Recovery Effort LTRG includes Essex County, where almost 16% of the population is facing food insecurity (Rabbitt et al., 2024).
Source: Vermont Disaster Recovery (2026)
Emergency Relief and Assistance Fund
Understanding distribution patterns of emergency relief and assistance resources, programs, and planning helps detect differences in climate change resilience of communities across the state. An important state-level program is the Emergency Relief and Assistance Fund, which provides state funding to match federal PA funding after a disaster is declared by FEMA. Eligible public costs are reimbursed by federal taxpayers at 82.5%. For communities that take specific steps to reduce flood damage, the state contributes either 12.5% or 17.5% of the total cost. Communities that are eligible for 12.5% matching have adopted the National Flood Insurance Program, the Town Road and Bridge Standards, a Local Emergency Management Plan, and a Local Hazard Mitigation Plan. Communities that are eligible for 17.5% matching have taken all the steps mentioned above plus additional steps of either a) protecting river corridors from new development, or b) protecting their flood hazard areas from development and participating in the FEMA Community Rating System, which is a voluntary incentive program that recognizes and encourages community floodplain management practices that exceed the minimum requirements of NFIP.
Insurance
Flood insurance can provide payouts after flooding events even without a disaster declaration. However, flood insurance is relatively expensive, and only 2% of Vermont homeowners had flood insurance according to the Vermont Department of Financial Regulation (D’Ambrosio, 2023). This rate of coverage resembles that of other states. The two types of flood insurance available are 1) the National Flood Insurance Program (NFIP) administered by FEMA and 2) private flood insurance. In 2023, there were 3,534 NFIP policies and 2,676 private flood insurance policies written in Vermont (D’Ambrosio, 2023) though there are approximately 10,000 structures within FEMA-designated Special Flood Hazard Areas (State of Vermont Flood Ready, 2024). The Vermont 211 reports following the July 2023 and July 2024 flood events show that most impacted residential and commercial properties reported that they were not covered by flood insurance (Table 11-10 and Table 11-11). Efforts to expand flood insurance are needed to prepare Vermonters for more frequent and intense flooding (see Climate Change in Vermont 2.6.2).
In Vermont, nearly 90% of communities are eligible for the NFIP (Vermont Geoportal, 2026). Existing participation varies geographically across the state with non-participating communities concentrated in the northeastern counties (Figure 11-20). Coverage by NFIP does not equate to flood risk or exposure to inundation. In the continental U.S., estimates vary from at least 41 million people live in a 100-year floodplain (Wing et al., 2022) to lower estimates of 13–23 million people based on FEMA maps (Qiang, 2019; Wing et al., 2022). NFIP payouts for the 2023 and 2024 floods totaled about $43.3 million and $7.2 million, respectively (FEMA, 2026b), with disparities in disbursement across the state (Figure 11-21).
County | July 2023 | July 2024 | ||||
|---|---|---|---|---|---|---|
Yes | No | Unknown | Yes | No | Unknown | |
Addison | 35 | 501 | 15 | 11 | 168 | 0 |
Bennington | 10 | 90 | 2 | 0 | 1 | 0 |
Caledonia | 30 | 251 | 3 | 69 | 792 | 2 |
Chittenden | 34 | 180 | 3 | 52 | 468 | 1 |
Essex | 0 | 9 | 0 | 2 | 112 | 0 |
Franklin | 2 | 49 | 1 | 0 | 8 | 0 |
Grand Isle | 0 | 5 | 0 | 0 | 1 | 0 |
Lamoille | 38 | 354 | 7 | 9 | 91 | 0 |
Orange | 32 | 358 | 6 | 3 | 26 | 0 |
Orleans | 34 | 344 | 9 | 12 | 168 | 1 |
Rutland | 34 | 125 | 1 | 1 | 3 | 0 |
Washington | 243 | 1417 | 11 | 116 | 774 | 1 |
Windham | 27 | 167 | 2 | 0 | 2 | 0 |
Windsor | 70 | 457 | 11 | 0 | 4 | 0 |
All counties | 589 | 4,307 | 71 | 275 | 2,618 | 5 |
Source: Vermont Emergency Management (2023a)
Note: Respondents were given the options “Yes”, “No”, and “Unknown”
County | July 2023 | July 2024 | |||
|---|---|---|---|---|---|
Yes | No | Yes | No | Unknown | |
Addison | 4 | 47 | 2 | 10 | 4 |
Bennington | 1 | 7 | 0 | 2 | 1 |
Caledonia | 0 | 10 | 16 | 92 | 0 |
Chittenden | 0 | 14 | 7 | 41 | 0 |
Essex | 0 | 1 | 0 | 11 | 0 |
Franklin | 3 | 4 | 0 | 1 | 3 |
Grand Isle | 0 | 0 | 0 | 1 | 0 |
Lamoille | 4 | 12 | 0 | 7 | 4 |
Orange | 2 | 9 | 0 | 7 | 2 |
Orleans | 5 | 23 | 2 | 13 | 5 |
Rutland | 0 | 3 | 0 | 0 | 0 |
Washington | 21 | 64 | 19 | 49 | 21 |
Windham | 5 | 14 | 0 | 0 | 5 |
Windsor | 8 | 31 | 0 | 1 | 8 |
All counties | 53 | 239 | 46 | 235 | 53 |
Source: Vermont Emergency Management (2023a)
Note: Respondents were given the options “Yes”, “No”, and “Unknown”
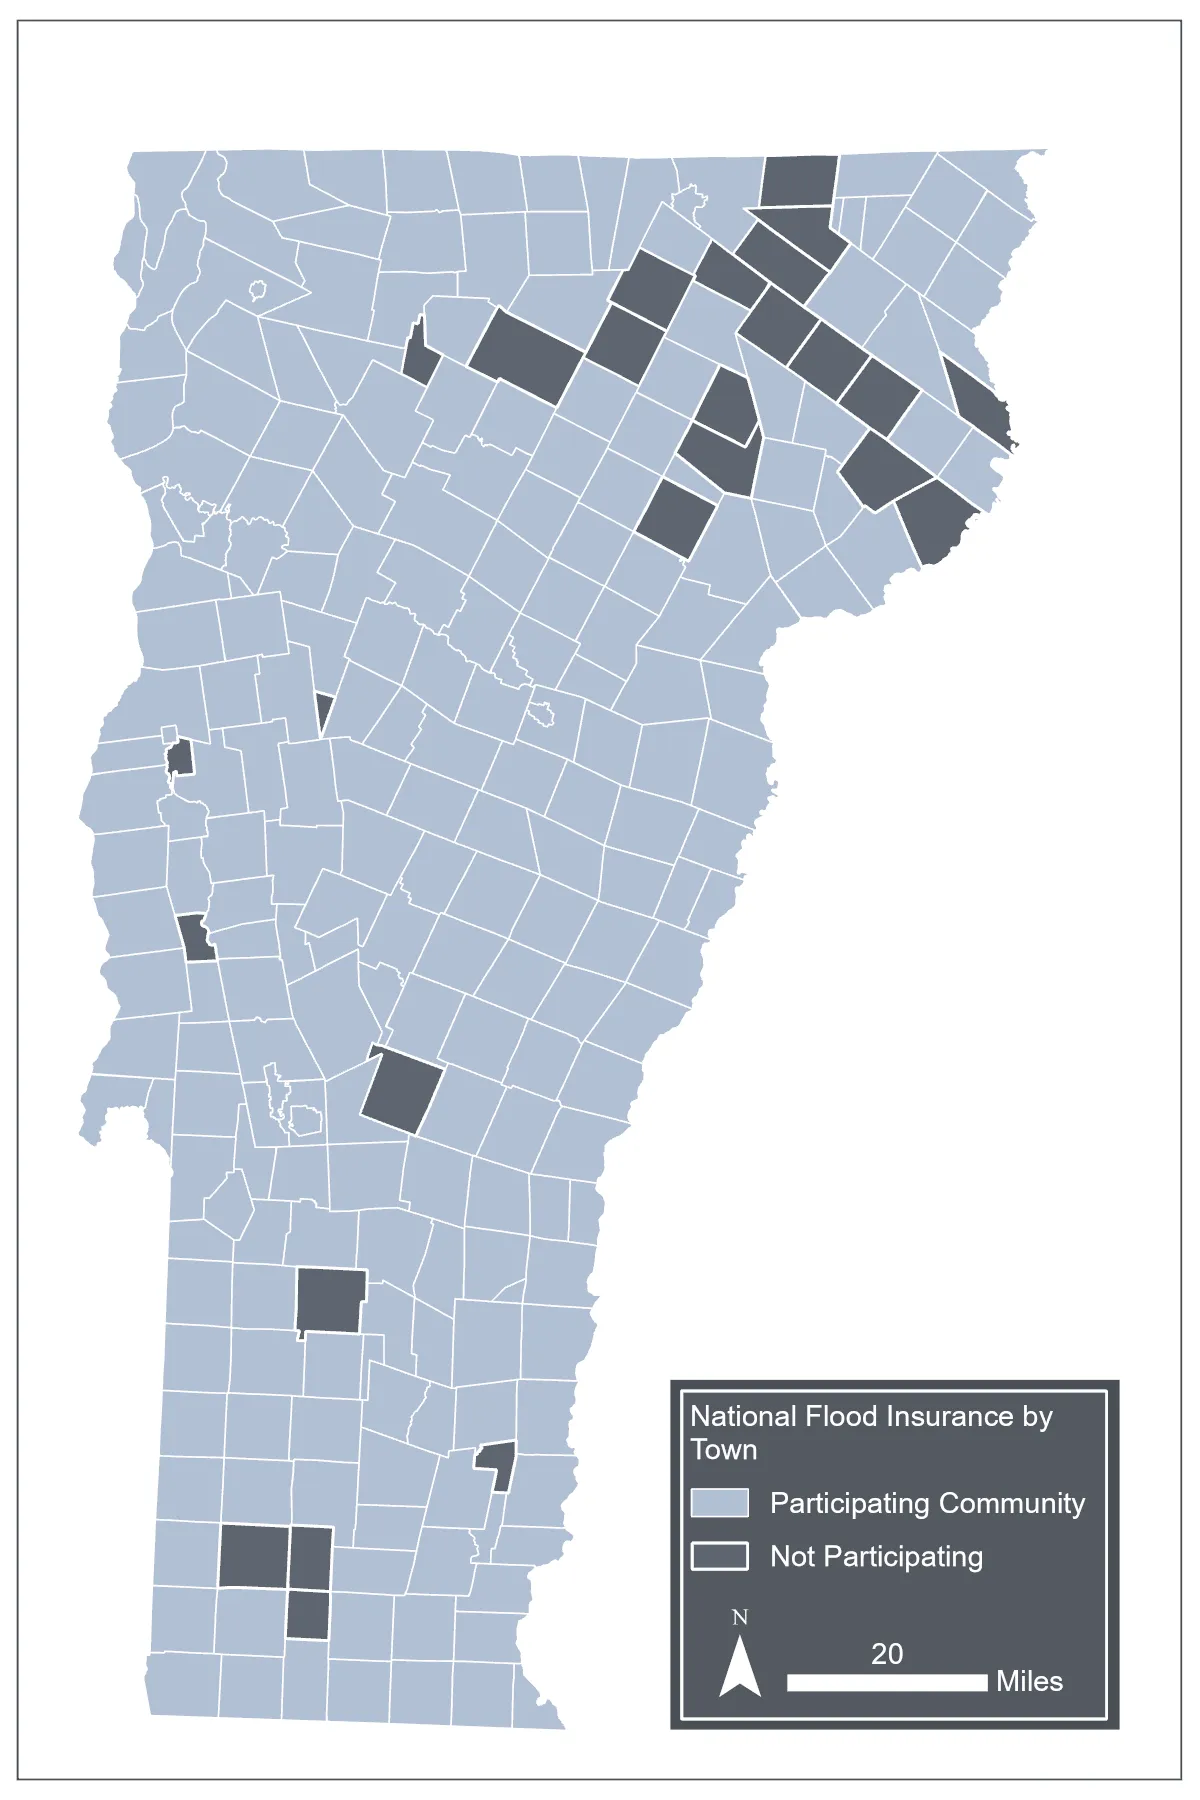
Source: Vermont Geoportal (2026)
Note: Visualization by Hanah C. Turner
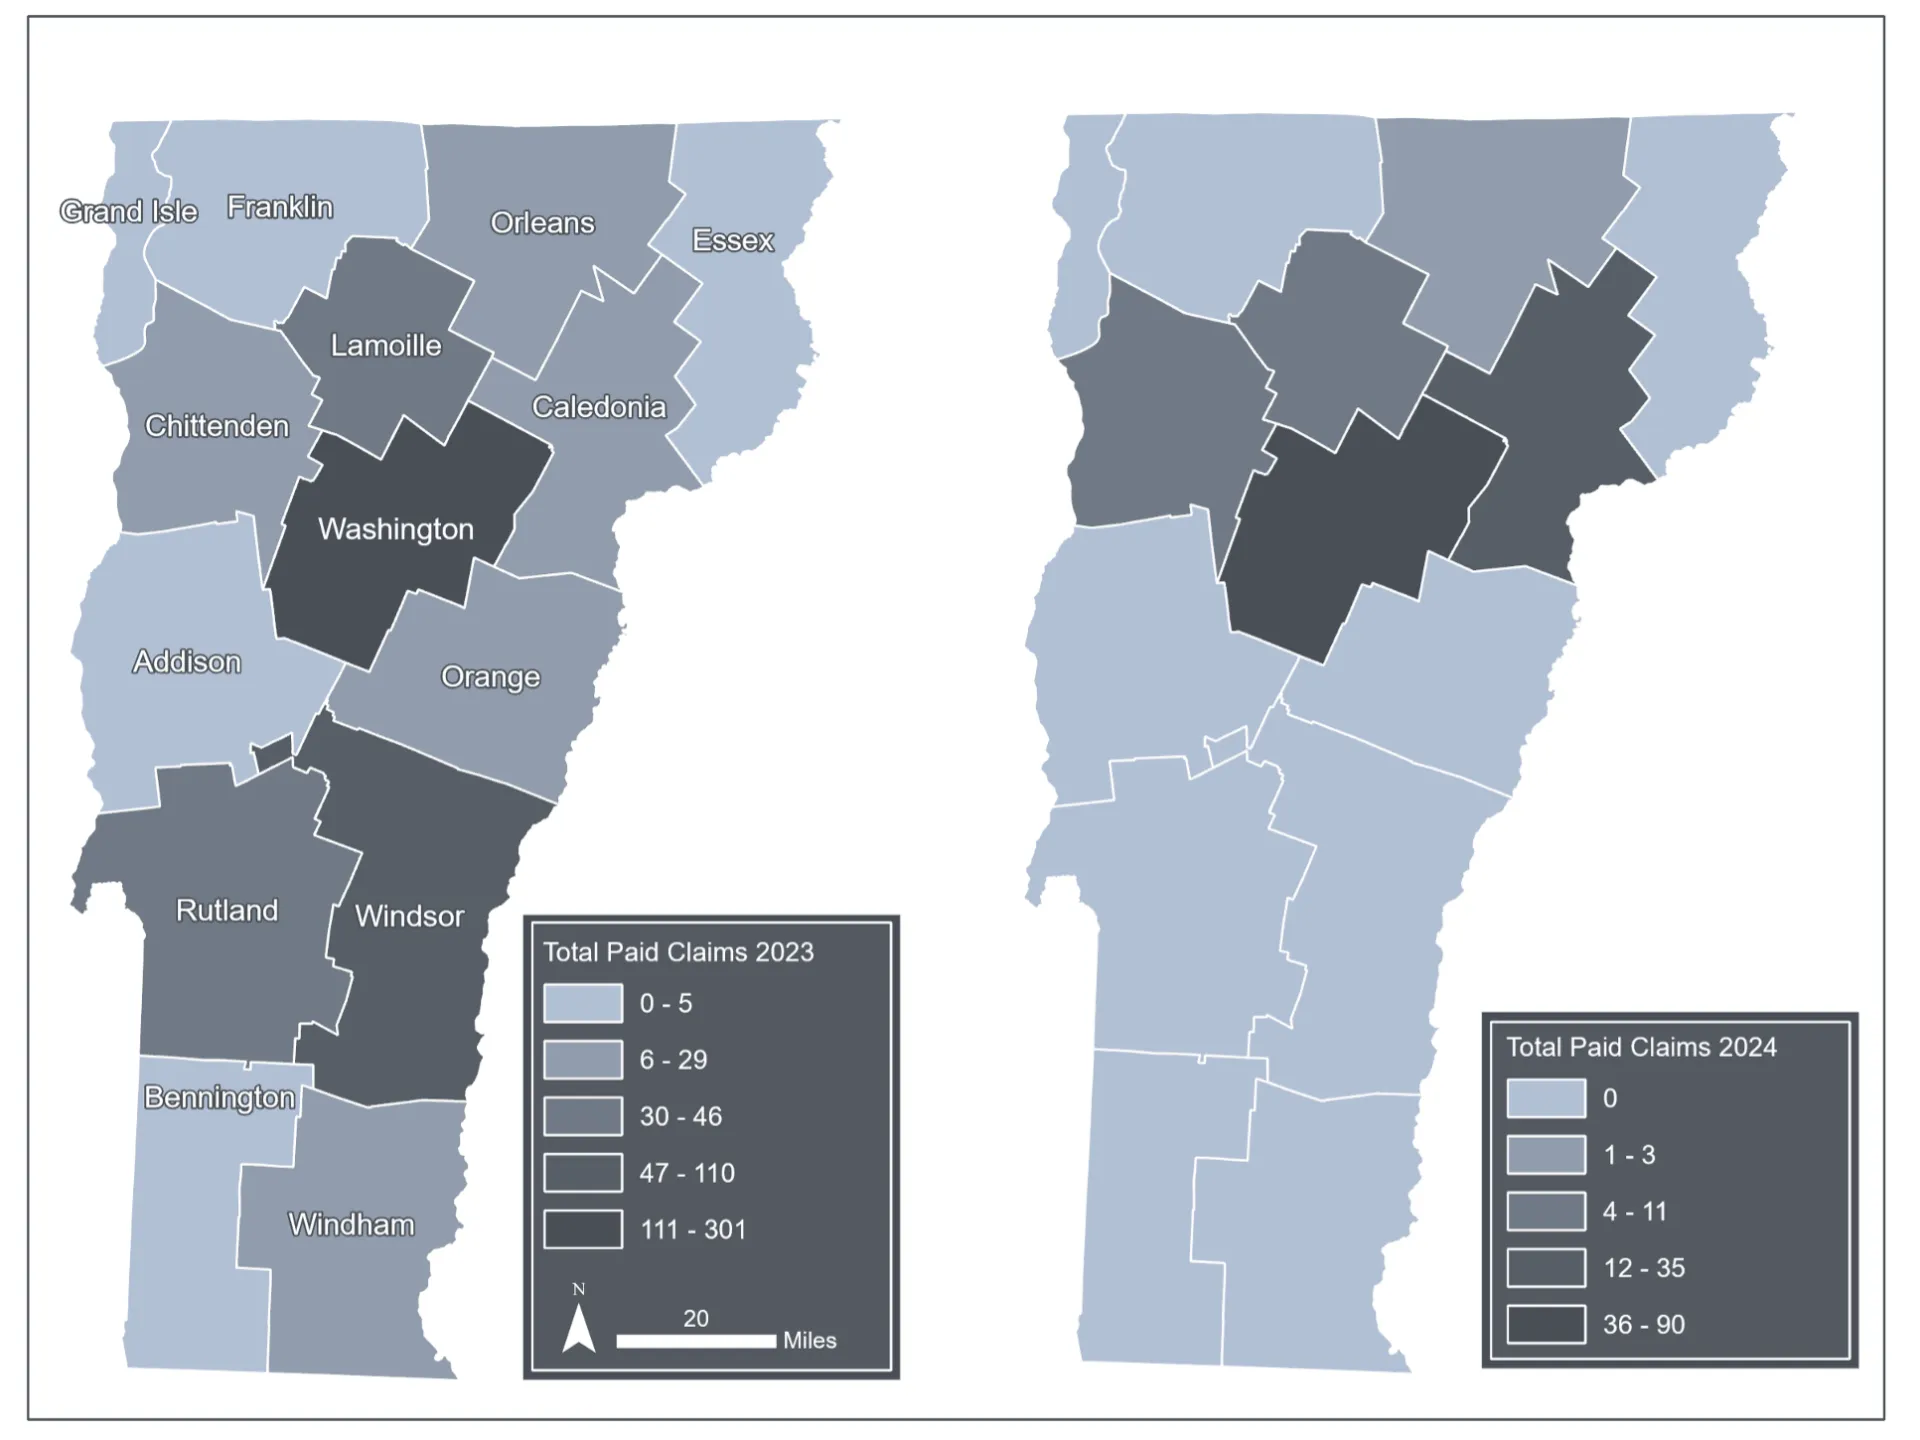
Source: FEMA (2026a)
Note: Visualization by Hanah C. Turner
Buyouts
Federal, state, and other programs in local governments and non-governmental organizations exist to purchase and subsequently demolish homes damaged by flooding rather than repairing or rebuilding them. As of December 2025, only around 3% (8 of 264) of buyout applications have been paid out by FEMA for the 2023 and 2024 flooding events. Recent changes to FEMA’s rules and eligibility requirements for federal buyouts have slowed progress (Berlin, 2025). In Lamoille County, the majority of buyouts were funded by the state; for example, 62.5% (5 of 8) of buyouts in Wolcott are state-led (Calvin et al., 2023).
There are challenges for homeowners who do receive buyouts, as the funds often go towards covering remaining mortgage expenses rather than payments directly to the homeowners. In some cases, the buyout does not cover the full amount of the mortgage and homeowners are left with debt. Further, since buyouts are administered locally, some municipal governments have been denying buyout requests from homeowners because the demolition of these homes would lead to a reduction in the towns’ property taxbases (McCallum, 2024).
Vermont is ranked highest in the nation in terms of vulnerability to flood risks measured by overvaluation of homes and a high percentage of the total municipal revenue stemming from property taxes, with 64% of counties falling into the most vulnerable quintile (Gourevitch et al., 2023). In the absence of buyouts, homeowners sell their homes in regular real estate transactions, simply transferring risk to other individuals. Under the business-as-usual climate scenario, floods could reduce housing stock; in this case, the lack of insurance and buyouts would lessen home values, undermining individual and community capacities to adapt (Gourevitch et al., 2023).
11.5.4 Mitigation
Community Development Block Grant Disaster Recovery (CDBG-DR)
Anticipating future extreme events, the Vermont Agency of Commerce and Community Development was awarded a Community Development Block Grant of $67.8 million from the U.S. Department of Housing and Urban Development in 2025 (Vermont Agency of Commerce and Community Development, 2026). As of November 2025, 77% of funds were awarded in pursuit of several broad areas of community development including housing ($27.5 million), infrastructure improvement ($13.3 million), planning ($3 million) and flood mitigation ($6.2 million; Vermont Agency of Commerce and Community Development, 2026).
Most funds have been awarded to the housing sector (55% of the total awarded funds). As of March 12, 2026, 65% of the available housing funds have been awarded, while 100% of the funds for infrastructure, planning and mitigation have been awarded, meaning that the remaining funds ($14.5 million) are dedicated to housing (Vermont Agency of Commerce and Community Development, 2026). Grants are geographically concentrated in the Housing and Urban Development (HUD) “Most Impacted and Distressed” counties of Washington and Lamoille. Affordable housing is prioritized, with a proposed 195 new units and 35 renovated units in Barre (122), Montpelier (53), Ludlow (44), Johnson (25), and Plainfield (8). The average amount awarded per unit is $140,948 (Vermont Agency of Commerce and Community Development, 2026).
Awards were granted for flood resilient bridge infrastructure and roadways for Cabot’s North Tributary ($1.25 million) and Brattleboro’s Detman Bridge ($1.7 million; Vermont Agency of Commerce and Community Development, 2026). Barre received an award ($856,428) to increase floodplain capacity and redesign Gunners Brook (Vermont Agency of Commerce and Community Development, 2026). In Barre, the Good Samaritan Haven received funds to relocate a homeless shelter out of the floodplain ($3.3 million; Vermont Agency of Commerce and Community Development, 2026). Lamoille Regional Planning Commission and the Village of Morrisville received an award to improve the flood resilience of the municipal water supply ($3.2 million; Vermont Agency of Commerce and Community Development, 2026). The Two Rivers-Ottauquechee Regional Commission received an award to buyout potentially contaminated properties stemming from the July 2023 floods ($3 million; Vermont Agency of Commerce and Community Development, 2026).
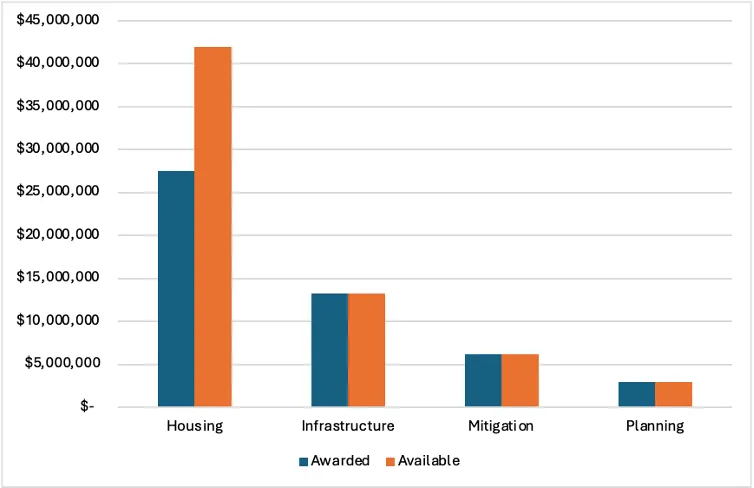
Source: Vermont Agency of Commerce and Community Development (2026)
Three mitigation grants were awarded to the towns of Waterbury ($2 million), Weston ($3 million), and Hardwick ($1.2 million; Vermont Agency of Commerce and Community Development, 2026). These funds are going towards resources for dam removal, engineering and installation of green infrastructure for floodplain restoration and flood resilience.
Eight planning grants ranging from $100,000 for East Montpelier to $1,000,000 for Lamoille County Planning Commission were awarded for the purpose of flood mitigation planning through scoping and feasibility studies, engineering, and design of high-impact stormwater projects; capacity building for shovel-readiness for resilient infrastructure and conducting a flood modeling and hydrology study of the Upper Winooski River Basin to identify watershed and municipal scale flood hazard mitigation projects (Vermont Agency of Commerce and Community Development, 2026). Ultimately, these awards address underlying gaps in technical and financial capital needed to expand access and availability of affordable housing in some of the most high-risk flood geographies in Vermont. Increasing resources for affordable housing while improving flood mitigation infrastructure and nature-based solutions are recommended for all of Vermont’s communities.
11.5.5 Preparedness and education
Disaster preparedness education aims to equip individuals and groups with actionable knowledge to reduce their vulnerability to disasters (Box 11-2). Disaster preparedness education increases awareness, enhances understanding, and builds capacity in disaster risk reduction, response, and recovery (Guo et al., 2025). It includes educating individuals about the potential hazards they may face, teaching them how to develop emergency plans, and training them in emergency response techniques. It also encompasses educating communities on the importance of developing resilient public and private infrastructure, early warning systems, and fostering a culture of preparedness. It is a functional, operational, and cost-effective tool for risk management. It creates a culture of safety and resilience at all levels (Torani et al., 2019). With climate change increasing the frequency of disasters, it is important to make this kind of education more widespread and accessible.
Both the Vermont Department of Health (VDH) and VEM (under the Department of Public Safety) have several resources for individuals, businesses and family preparedness for disasters (Vermont Emergency Management, 2026). These include instructions on building a preparedness kit and family emergency preparedness workbooks that are available in ten different languages common in Vermont’s communities. A business preparedness workbook is published by VEM to introduce business owners to climate hazard and continuity planning. VEM manages and provides support to several emergency response agencies in Vermont. VEM regional coordinators are assigned to every county in Vermont to aid in planning development, training, and exercise support in communities. However, state-led organizations like VDH and VEM face barriers to deeper community engagement because they are governed by bureaucracy, which is limited by the lack of flexibility and trust in government (Campbell et al., 2022; Davis et al., 2025; Satizábal et al., 2022). For example, flooded towns experienced an emergency response slowed by bureaucracy, which is why community-led responses were so abundant and effective.
Individuals and communities responded to recent disasters (Table 11-8) with collective action and by harnessing aid from local, state, and federal sources (Gaffney, 2026; Vermont Public Staff, 2024). For example, grassroots flood responders created a toolkit to support communities in advancing their flood preparedness in future disasters (Resilience Hub, 2026). Resources developed by communities for communities allow for the expansion of response and preparedness through both formal (e.g., municipal, state, federal) and informal channels (Shi & Moser, 2021).
Box 11-2 Climate change and education
Schools can play a meaningful role in community resilience because they are central institutions directly involved in the development of systems thinking, collaboration, equity analysis, and civic participation, all of which align with resilience indicators identified in the community development literature.
National research supports the value of climate education in reducing student anxiety and increasing students' sense of agency and adaptive capacity. A community-based environmental education study documented statistically significant increases in participants' reported adaptive capacity and civic action after structured climate learning experiences (Ardoin et al. 2022). The Ipsos/National Public Radio national teacher poll (2019) found that 82% of teachers report that climate change is happening and 86% believe it should be taught in schools, but 55% do not teach it due to limited training, resources, or time. These findings highlight the need for structured, evidence-based approaches that can support both educators and communities.
Across Vermont, educators, students, and community partners are practicing climate action through applied, real-world experiences. For example, the Equitable Climate Action Partnership (ECAP) assists schools in understanding climate impacts in their own communities and engaging in mitigation and adaptation projects that relate to flooding, biodiversity, food systems, and energy transitions.
Regional data also suggest that Vermont is well-positioned to benefit from school-based climate learning. A Northern Borders resilience survey (Daigneault et al., 2023) found that communities in this multi-state region reported higher levels of social resilience, including trust, shared leadership, and civic engagement compared to economic or infrastructural resilience measures. These findings indicate that Vermont's social systems, including schools, may be strong leverage points for resilience-building. Economic data reinforce this opportunity. Vermont already supports approximately 18,900 workers in climate-related fields such as energy efficiency, renewable energy, transportation, natural resources, and ecosystem restoration (Energy Action Network 2026). This suggests a direct connection between climate education, workforce development, and community capacity. A current example of community-based climate action comes from the Upper Valley Super Compost Project, which supports schools in designing and implementing comprehensive composting systems.
11.6 Planning, governance, and policy
Planning for resilience allows for identification of climate risks and creation of an overall framework for addressing and managing them. Planning includes measures to deal with both short-term and long-term risk, with a goal of proactive, not reactive, climate action. Further, planning and governance frameworks provide the basis for the development of effective policy instruments.
The development and implementation of plans and policies are shaped by governance structures and thus impact their success. Tackling climate issues is a multi-level governance challenge that requires integrating and coordinating across a wide range of sectors. Governance involves actors and institutions across government—at the federal, state, and local levels—as well as civil society and non-governmental institutions. Interactions between these actors not only shape the goals and design of climate policy but also determine their operationalization and ultimate outcomes.
11.6.1 Climate action at the state level
The most recent, significant state-level development on climate action has been the Global Warming Solutions Act (Act 153; Vermont Climate Council, 2025). The law binds the state to reduce greenhouse gas emissions according to targets in line with the Paris Agreement. It established a Climate Council tasked with the development of a Climate Action Plan, which is required to include recommendations for, and assessments of, resilience and adaptation. Public engagement for input through community events and public comment was a core part of the 2025 Climate Action Plan Update. The priority recommendations related to resilience are:
- Expand and maintain a permanent Flood Resilience Communities Fund
- Invest in municipal infrastructure to support compact development
- Increase funding and adapt existing Vermont programs that achieve climate goals on farms and in forests
- Promote equitable landscape connectivity and conservation for 30x30 and 50x50 goals
- Support utility programs that ensure the electric grid supports customer electrification and resilience
- Identify revenue sources to immediately support these priority actions
- Implement the Climate-Ready Workforce Initiative and related actions
The Vermont Agency of Natural Resources is responsible for implementing the recommendations in the Climate Action Plan by developing specific actions (Vermont Climate Council, 2025). For resilience and adaptation, the agency led the development of the Vermont Resilience Implementation Strategy (Vermont Agency of Natural Resources, 2025). Actions fall under the following strategic priorities: improving government systems for planning and implementation, community-centric approach, early warning systems and rapid response, economic and environmental sustainability, infrastructure design and reinforcement, and nature-based solutions. Key themes include increasing state agency capacity and coordination, setting up dedicated funds for adaptation and post-disaster response, technical and financial assistance for municipalities, and providing resources for climate-resilient small business and workforce development.
11.6.2 Local and regional level governance and planning
Decentralization is a key aspect of governance in Vermont because of the absence of county-level governing bodies. In Vermont, most decision-making occurs at the municipal level on issues such as infrastructure development, land use, land taxation, community services, and public safety. Regional planning commissions provide technical assistance to municipalities and link municipal governments together and to the state government, but they do not have elected members or tax authority. There are 11 regional planning commissions (RPC) in the state, and they work across sectors including land-use, transportation, housing, economic development, and environmental quality (Figure 11-23). Through their guidance, the Vermont Climate Action Office is piloting a framework for municipal climate planning in line with state climate goals and priorities. The program will test a draft in a few municipalities and then a final resource will be created by the end of 2026 (Climate Action Office, 2025).
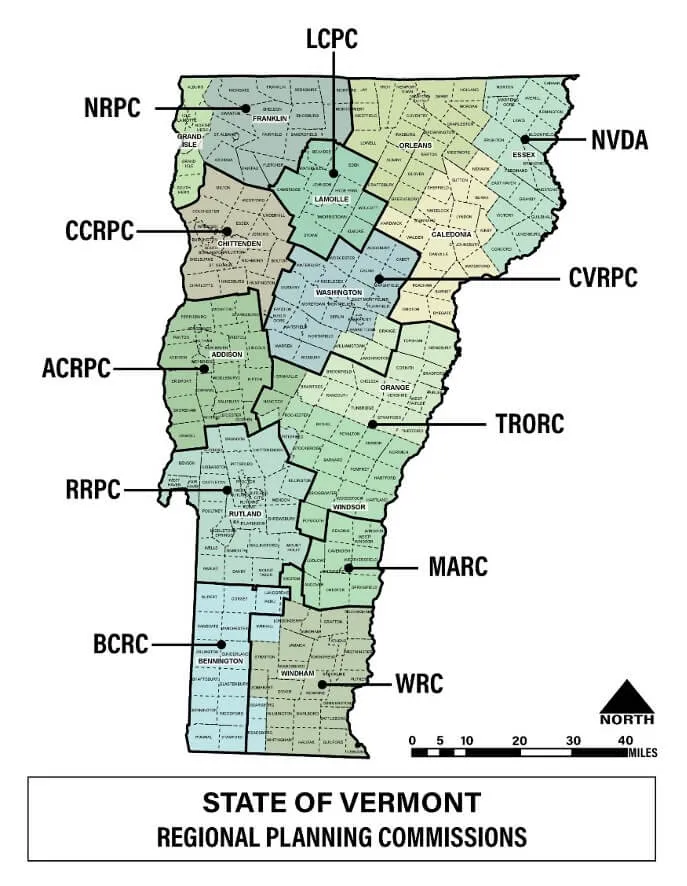
Source: The Flood Safety Act (2025)
Incorporating climate risks via Local Hazard Mitigation Plans
Climate risk can be identified and assessed through municipal Local Hazard Mitigation Plans (LHMPs), which are prerequisites for federal funding for FEMA assistance and can be enhanced to include more comprehensive resilience measures including adaptation, nature-based solutions, and community services. RPCs support municipalities in developing LHMPs, which are then submitted for approval to VEM. RPC support includes technical expertise for municipal plans, zoning, and bylaws to incorporate floodplain regulations, river corridor protections, and climate-adaptive policies. They assist with flood inundation studies, planning for culvert and road replacements, and fulfilling community buyouts. Given the high risk of floods in the state, all LHMPs address flooding (Table 11-12). Nearly all address fluvial erosion, and other weather hazards such as flash floods, ice jams, wildfires, drought, landslides, and extreme temperatures are less frequently addressed. Municipalities work with RPCs to develop regional plants that help coordinate and scale action across towns, reducing fragmentation and improving action under limited local-level capacity.
Hazard | Approved Plans | Percent of Approved Plans |
|---|---|---|
Flooding | 134* | 100.00% |
Fluvial Erosion | 125 | 93.30% |
Winter Storms | 115 | 85.80% |
Ice Storm | 101 | 75.40% |
High Wind | 87 | 64.90% |
Flash Flood | 69 | 51.50% |
Extreme Cold | 62 | 46.30% |
Hail | 48 | 35.80% |
Wildfires | 47 | 35.10% |
Drought | 46 | 34.30% |
Thunderstorms | 42 | 31.30% |
Hurricanes/Tropical Storms | 39 | 29.10% |
Landslides | 38 | 28.40% |
Earthquakes | 38 | 28.40% |
Infectious Disease Outbreak | 37 | 27.60% |
Invasive Species | 36 | 26.90% |
Extreme Heat | 36 | 26.90% |
Ice Accretion | 33 | 24.60% |
Dam Failure | 32 | 23.90% |
Tornadoes | 27 | 20.10% |
Ice Jams | 26 | 19.40% |
Lightning | 26 | 19.40% |
Source: Vermont Emergency Management (2023b)
Note: *134 plans were approved between 2017 and June 2023; some are multi‑jurisdictional
RPCs are deeply involved in project scoping, grant writing, and project management for resilience projects, leveraging programs like the VEM-run program, Flood Resilient Communities Fund, FEMA's BRIC grants, and the Resilience Initiative for Vermont Empowerment and Recovery administered by Two Rivers-Ottauquechee Regional Commission (Resilience Initiative for Vermont Empowerment and Recovery (RIVER), 2025). For instance, the Bennington Regional Planning Commission is applying a transportation resilience planning tool to the Batten Kill watershed (Bennington Regional Planning Commission, 2024), and the Lamoille County Planning Commission is developing a regional flood resiliency and recovery plan (Lamoille County Planning Commission, 2024).
RPCs primarily focus on infrastructure projects; for example, they are supporting multiple flood resilience projects along the upper Mad River, a scoping study to reduce flood risk from Big Branch in Mount Tabor (Rutland Regional Planning Commission, 2025), and numerous road and culvert replacement projects aimed at preventing washouts across the state. The Northeastern Vermont Development Association is managing flood recovery projects that include floodplain restoration in Lyndon and ice jam flooding mitigation in Coventry (King and DuBois Inc., 2025; Northeast Vermont Development Association, 2018). These initiatives and resources support municipalities as they center resilience in community development.
Unhoused populations are not always explicitly mentioned in plans developed by RPCs: 80% mention ‘unhoused’ or ‘homeless’ populations, while only 50% have dedicated subsections or headings. There is minimal discussion and focus on mitigating the risks and vulnerabilities that unhoused populations face due to environmental exposure. The county with the largest unhoused population, Chittenden, has no mention of unhoused populations in their 2018 plan (Chittenden Country Regional Planning Commission & Good Jobs In a Clean Environment, 2018). Many reports that were published more recently (i.e., after 2020) have explicit references to unhoused populations. It is anticipated that due to recent increases in unhoused populations, more robust consideration in planning is underway for upcoming plans.
Greenhouse gas emissions mitigation
Regional planning in the transportation and energy sectors is key to climate change mitigation. The Municipal Energy Resilience Program is a major initiative across all regions that helps towns weatherize and electrify public buildings. For example, the Northwest Regional Planning Commission is implementing the Climate Pollution Reduction Grant and has partnered with Saint Albans City on a transportation needs assessment and an enhanced energy plan. The Addison County Regional Planning Commission aims to increase local capacity by assisting with the development of an energy navigator program to help residents with weatherization (Addison County Regional Planning Commission, 2022). The Chittenden County Regional Planning Commission has updated municipal energy data guides and is helping five municipalities create or update their enhanced energy and climate plans to meet state standards (VAPDA, 2025). The Northeastern Vermont Development Association administers $11.4 million in energy resilience funding for Northeast Kingdom communities under the solar installation and design training program, which serves to boost workforce development in the region (Northeast Vermont Development Association, 2025). Scaling up the Municipal Energy Resilience Program may provide communities with needed resources to expand mitigation efforts and increase energy efficiency and cost savings.
Leveraging co-benefits for water quality
Municipalities and regions across Vermont are simultaneously addressing climate hazards (like flooding) and water quality concerns. For example, the Central Vermont Regional Planning Commission is developing non-regulatory water quality and flood resilience projects along the upper Mad River and has assisted towns like Middlesex and Woodbury with grant applications for road resiliency and flood mitigation (VAPDA, 2025). The Lamoille County Planning Commission is using $604 billion in program funding to develop conceptual design plans for water quality and flood mitigation projects in Cambridge, Johnson, and Wolcott (Lamoille County Planning Commission, 2024; VAPDA, 2025). The Mount Ascutney Regional Commission is administering a $3.2 million block grant for statewide water quality and flood resilience improvements and assisted Ludlow with the Resilience Initiative for Vermont Empowerment and Recovery project for a FEMA grant application (Mount Ascutney Regional Commission, 2025). The Rutland Regional Planning Commission is managing a scoping study for the Mount Tabor town garage and produced a map of inundation areas for a theoretical dam failure at the Chittenden Reservoir (VAPDA, 2025).
11.6.3 Land-use planning
Development patterns
Historic patterns of land use profoundly influence how communities are positioned geographically, socially, and economically—and how exposed they are to climate risk. Beginning with the dispossession of Indigenous peoples, Vermont’s history includes extensive deforestation to convert forests into fields for subsistence pasture and agriculture and channeling rivers for lumber transport. These land transformations from the early Industrial Revolution shape some vulnerable aspects of communities. Successive waves of changing land use shaped settlement patterns that concentrated development in narrow river valleys and disconnected floodplains—precisely the landscapes most exposed to the flooding that climate change is intensifying. Continued fragmentation of natural and working landscapes through conversion to impervious, built environments will likely increase adverse impacts.
Land-use planning and sustainable urban design can help reduce emissions and improve climate resilience in communities (see Infrastructure 7.7; Human Health 10.11.5). To increase resilience, development may be concentrated in existing urban and village centers on higher ground, away from floodplains and river corridors. Natural buffers (e.g., forests, wetlands, floodplains, riparian areas) must be protected and restored at-scale to reduce flood risk. Infrastructure investment must prioritize the retrofitting and climate-proofing of existing communities. Housing supply must expand substantially in walkable, transit-accessible locations. A walkable community allows for active transportation which in turn improves health outcomes from more physical activity and reduces air pollution (see Human Health 10.11.1). At the same time, walkable communities less reliant on private gas-powered vehicles lowers greenhouse gas emissions (Sallis et al., 2012). The Vermont Livability Map is a pilot project that aims to determine where development should take place (Box 11-3).
Green infrastructure, nature-based solutions, and ecological restoration
Understanding communities as social-ecological systems means recognizing that natural systems and processes influence community resilience. Green infrastructure and nature-based solutions can harness the environment to help communities both mitigate and adapt to climate change (Opperman & Galloway, 2022).
Whereas Vermont's pre-colonial landscape was characterized by a network of wetlands and many beaver dams that slowed the movement of water, development and landscape transformation have straightened and channelized many streams, increasing discharge velocity and streambank erosion (Kline & Cahoon, 2010). This development has diminished many ecosystem services provided by wetlands and connected floodplains (e.g., water, filtration, water retention); these losses can exacerbate the impacts of more extreme streamflow caused by more intense precipitation (Kline & Cahoon, 2010). Restoration of floodplain ecosystems is a nature-based, cost-effective solution to prepare for more frequent extreme weather events and rebuild community resilience (Gourevitch et al., 2020). Gentrification is a possible side effect following the implementation of nature-based solutions as access to nature can increase property values (Quinton et al., 2022; Stroud et al., 2023). Preventing the displacement of communities that could benefit the most from nature-based solutions should be considered and prioritized (D’Amico, 2025; Gourevitch et al., 2020).
Many nature-based solutions, and other green infrastructure projects, can be integrated into existing infrastructure to create cost-efficient resilience measures with co-benefits for people and wildlife. In 2017, Vermont created the Stormwater Management Manual Rule and Design Guidance to integrate green infrastructure (e.g., vegetation cover, green roofs, wetlands, bioretention; Vermont Agency of Natural Resources, 2017). Urban tree canopy is another common type of green infrastructure that can reduce temperatures and alleviate urban heat island effect (Zhou et al., 2021). Investing in greater canopy coverage has co-benefits such as keeping air temperatures cooler and storing carbon (Elmqvist et al., 2015).
Mobility and built environment
Transportation accounts for approximately 40% of Vermont's greenhouse gas emissions (Climate Action Office, 2025; see Energy 8.3), and thermal heating of residential and commercial buildings accounts for another 30%. Together these two sectors represent nearly three quarters of the state's emissions—and both are deeply shaped by land-use decisions.
The transition away from fossil fuel dependence requires making active transportation and public transit viable options for a greater share of Vermonters. This would require investing in connected networks of sidewalks, protected bike lanes, and multi-use paths to allow for these modes of transport to be used for commuting. It entails the expansion of public transit. Designing communities around the assumption of universal car ownership may exclude lower-income residents, older adults, young people, and people with disabilities.
Legislative efforts
Vermont’s legislature has taken actions to address the integrated nature of housing, working lands, natural environments, and rural development. For example, the HOME Act (Act 47) designates a minimum density requirement of at least five dwelling units per acre for new residences that are served by municipal water and sewer lines. Another land-use planning example is the Flood Safety Act (Act 121) of 2024 that reduces flood risk and vulnerability to flood damage through multiple avenues: regulating proposed development in river corridors, setting municipal floodplain management requirements, establishing a “net gain” rule of 2:1 for wetland conservation, and improving dam safety (The Flood Safety Act, 2024).
Box 11-3 Vermont Livability Map
The Vermont Livability Map is a pilot project to provide tools and resources to determine what can be built with the land in Vermont. The Vermont Research Open Source Program Office (VERSO), the Vermont Complex Systems Institute, the Leahy Institute for Rural Partnerships, and undergraduate student interns in the Open Research Community Accelerator (ORCA) program are all collaborating on its development.
The project uses LiDAR-informed flood inundation data, sewage lines, wastewater treatment facilities, and zoning to help identify what can be built and where.
11.6.4 Social protection
Social protection measures (e.g., social safety nets, insurance programs, provision of essential services) support communities’ resilience to extreme weather and other types of shocks by addressing socioeconomic risks (Tamasiga et al., 2024). Social protection centers equity and human dignity, aiming to ensure people's well-being. In the context of climate change risks, it can encompass two complementary approaches: 1) reactive assistance to those already affected; and 2) proactive structural reform to reduce vulnerability before shocks occur. Integrating social protection into community planning is essential for preventing the long-term erosion of livelihoods in climate-sensitive sectors like recreation, tourism, and agriculture.
The first approach (i.e., reactive assistance) focuses on providing direct assistance to affected populations after climate shocks or slow-onset climate impacts have already occurred (International Labour Office, 2024). For acute events, this includes expanding access to disaster relief, emergency housing, food assistance, and mental health services in the aftermath of extreme weather or natural disasters (Oxford Policy Management, 2017). Federal policy trends, such as cuts to Medicaid and federal nutrition assistance programs, are shifting greater responsibility onto the state (Hirschfeld, 2025), while simultaneously reducing the resources available to those most exposed to climate impacts. Vermont's General Assistance program, state-funded housing stabilization programs, and the 3SquaresVT program are existing state mechanisms that could be strengthened and made more responsive to climate-related needs.
The second approach (i.e., proactive structural assistance) addresses structural inequalities that make certain populations disproportionately vulnerable. This requires addressing underlying conditions (e.g., poverty, economic inequality, racial inequality, housing insecurity, inadequate healthcare, wage stagnation) that determine who bears the greatest burden of climate impacts. For example, community land trusts and public housing may offer affordable housing options to address housing insecurity and poverty. For example, the Champlain Housing Trust provides affordable access to housing; it sells its homes to low-income buyers who benefit from a low 0.5% foreclosure rate (Temkin et al., 2010). A study of community land trusts in Minneapolis found that homeowners noted the significance of affordability gained by joining the trust and reported feeling more stable and able to the pursue new employment and educational opportunities (Hackett et al., 2019). Vienna, Austria offers another successful model for social housing: 40% of households live in social housing where rents are lower than in the private housing market. The Viennese model is accessible to broad parts of the population, not just low-income applicants; it therefore increases the “social mix” in neighborhoods, which is the diversity of residents’ ethnicity, income, education, and other socioeconomic factors (Premrov & Schnetzer, 2023). Beyond housing, another example of proactive structural assistance is expanding affordable healthcare. Communities with access to universal healthcare have improved health outcomes, fewer bankruptcy filings, and reduced family financial crises, thus decreasing climate vulnerability of communities (Garrett et al., 2009).
11.6.5 Social cohesion and psychology
Social cohesion is important for sustainability and resilience because it is a key factor for a community’s ability to bounce back after a shock (Sobhaninia, 2024). While conceptions of social cohesion vary, they usually include the following dimensions: sense of belonging versus isolation, inclusion versus exclusion, trust versus distrust, and participation versus non-involvement (Jenson, 1998). Aspects that increase social cohesion include social support networks, social participation, and community engagement (Sobhaninia, 2024). These aspects can exist within and across communities or within state/other institutions.
Resilience can be understood as a process, with social cohesion being one key part. Communities that have, “dense preexisting networks of trust and reciprocity” are more likely to be better prepared for shocks, including climate shocks (Tamasiga et al., 2024). According to Vermont’s Civic Health Index, the state ranks second in the U.S., “for working with neighbors to do something positive for the neighborhood or community and for discussing political, societal, or local issues with neighbors” (Vermont Secretary of State’s Office et al., 2025). Trust in local government is much higher than trust in the federal government, and confidence in local government further increased during the COVID-19 pandemic. Vermonters are more politically engaged in their communities compared to residents of other states (Vermont Secretary of State’s Office et al., 2025). However, this participation, while high in proportion to the rest of the country, is still a small portion of the population (17%).
Social networks have shown many positive outcomes in Vermont. Community groups created a resilience toolkit in response to the 2023 and 2024 floods (Resilience Hub, 2026). During these floods, volunteers in communities often were first responders and organized supplies and communication, essentially following a mutual aid model (Pintair, 2023). The toolkit is a result of the learning and experience from past floods in preparation for future floods.
Social cohesion can be strengthened by government support, such as a collaborative governance model that integrates top-down public resources, expertise, and legal authority with bottom-up neighborhood organizing, local expertise, and grassroots power (Vo, 2025). This can look like formal power-sharing agreements, funding, or technical assistance.
11.6.6 Public finance
Fiscal impacts of climate change
Climate change has fiscal impacts and can put public finances under strain. Following a climate shock, public expenditures, public revenue, and public borrowing costs are all affected but fiscal actions and outcomes differ based on a jurisdiction’s income (Barrage, 2025). Areas with higher incomes or access to good credit see increases in public expenditure, while government spending is lower in poorer and credit-constrained areas (Barrage, 2025). Increased spending after a disaster aims to stimulate economic recovery—called counter-cyclical spending by economists. A report by the U.S. Chamber of Commerce estimates that every $1 spent on resilience and preparedness can reduce post-disaster damage and cleanup costs by $6 (U.S. Chamber of Commerce et al., 2024).
Federal support to states through intergovernmental transfers are key to recovery and include both direct disaster assistance (e.g., FEMA), and general social safety net transfers (e.g., unemployment insurance, public health expenditures; Deryugina, 2017). Preliminary analysis of costs associated with the July 2023 floods exceeded $600 million, with the State of Vermont matching $37 million (Reynolds, 2025; Vermont Agency of Administration, 2023). In Vermont, the direct federal disaster aid for 2023 was higher than 90% of the state’s savings in 2024 (The Pew Charitable Trusts, 2025). A nationwide study on floods and hurricanes showed that high income counties in the U.S. increased their expenditures, received increased intergovernmental transfers, and did not see declining tax revenues while low-income counties did not significantly increase public expenditure, lower receiver lower intergovernmental transfers, and experienced declining tax revenues (Miao et al., 2023). This indicates that low-income counties had to rely more on borrowing and were unable to sufficiently invest in disaster recovery, thus increasing long-term debt levels in low-income counties while lowering them in high-income counties (Miao et al., 2023). Local governments may see increasing trends in borrowing costs due to climate change disasters. Climate risk has overall increased yields of municipal bonds since the last decade, with yields higher for bonds backed by less diversified revenue sources and those that have a higher share backed by property taxes (Acharya et al., 2022; Auh et al., 2022; Barrage, 2025; Goldsmith-Pinkham et al., 2023; Jeon et al., 2024).
Financing recovery and resilience
Federal funds are important for financing disaster recovery and climate resilience, though there is risk because federal disaster declarations and allocations of funds are influenced by politics (see 11.5.1). Vermont has been among the states denied FEMA assistance in 2025 (Cotton, 2026) along with other federal social safety assistance (e.g., SNAP; Flanders, 2025). Affordable Care Act health insurance subsidies have decreased, increasing an individual’s cost-burden and therefore vulnerability to climate and health risks (Ullman, 2025; see Human Health 10.10). Future federal support is uncertain, so it remains important for Vermont to prepare by increasing secure financing.
Dedicated funds play an important role in enabling implementation of climate adaptation and resilience actions. The Flood Resilient Communities Fund provided dedicated funding for voluntary projects that decreased flood risk and improved water quality, but funding has been allocated, and new applications are closed (Vermont Department of Public Safety Vermont Emergency Management, 2026). The Municipal Climate Recovery Fund, run through the State Treasurer’s Office and Vermont Bond Bank, offers financing for flood-related expenses at a low (~1.3%) interest rate. The Treasurer’s Office estimates the program will save taxpayers $3.5 million (State of Vermont Office of the State Treasurer, 2023). It can also act as bridge while municipalities are waiting for FEMA funds. Another option is the Property and Casualty Intermunicipal Fund run by the Vermont League of Cities and Towns that helps its members buy down interest rates for flood-related loans. However, these two options do not meet demand. Throughout the state of Vermont, the need for sustained and dedicated financing for both adaptation and post-disaster recovery remains for municipalities, communities, and businesses.
In 2024, the state passed the Climate Superfund Act, which allows the state to recover funds for damages from fossil fuel companies for the climate impacts that they have caused in Vermont. The State Treasurer’s Office is currently working on estimating the damages. The law has been challenged in a U.S. District Court by the Trump administration, the fossil fuel lobby, and 24 states (Gaffney, 2025). The funds, if recovered, are mandated to be used for adaptation and resilience projects.
Additional economic activity in the state can also increase its tax base. Other potential sources of revenue for resilience include expanding taxation. Progressive income taxes and wealth taxes have been proposed by various groups. A second home tax has been proposed to increase revenue while addressing the housing crisis in the state.
11.7 Traceable accounts
11.8 References
2025 Global Report on Internal Displacement (GRID). (2025). Internal Displacement Monitoring Centre (IDMC). https://doi.org/10.55363/IDMC.XTGW2833
A Northeast Safe & Thriving for All (NEST). (2023). Cornell AAP. https://labs.aap.cornell.edu/sites/aap-labs/files/2023-11/NOAA%20NEST%20REPORT%202023.pdf
Acharya, V. V., Johnson, T., Sundaresan, S., & Tomunen, T. (2022). Is Physical Climate Risk Priced? Evidence from Regional Variation in Exposure to Heat Stress (Working Paper No. 30445). National Bureau of Economic Research. https://doi.org/10.3386/w30445
Addison County Regional Planning Commission. (2022). Addison County Regional Plan. https://acrpc.org/wp-content/uploads/2022/03/Regional_Plan_2_18_2018_updated_02_09_2022.pdf
Angueira, G. A. (2025, December 11). Federal judge orders FEMA to restore billions in canceled disaster mitigation funding. The Seattle Times. https://www.seattletimes.com/nation-world/nation/federal-judge-orders-fema-to-restore-billions-in-canceled-disaster-mitigation-…’s%20disruption%20upended%20projects,areas%20most%20vulnerable%20to%20disasters.
Ardoin, N. M., Bowers, A. W., Kannan, A., & O’Connor, K. (2022). Positive youth development outcomes and environmental education: A review of research. International Journal of Adolescence and Youth, 27(1), 475–492. https://doi.org/10.1080/02673843.2022.2147442
Auh, J. K., Choi, J., Deryugina, T., & Park, T. (2022). Natural Disasters and Municipal Bonds (Working Paper No. 30280). National Bureau of Economic Research. https://doi.org/10.3386/w30280
Avtar, R., Blickle, K., Chakrabarti, R., Janakiraman, J., & Pinkovskiy, M. (2023). Understanding the Linkages between Climate Change and Inequality in the United States. Economic Policy Review, 29(1). https://doi.org/10.2139/ssrn.4487633
Baker, D., Hamshaw, S. D., & Hamshaw, K. A. (2014). Rapid Flood Exposure Assessment of Vermont Mobile Home Parks Following Tropical Storm Irene. Natural Hazards Review, 15(1), 27–37. https://doi.org/10.1061/(ASCE)NH.1527-6996.0000112
Barrage, L. (2025). Climate Change Impacts on Public Finances Around the World. Annual Review of Resource Economics, 17(Volume 17, 2025), 281–300. https://doi.org/10.1146/annurev-resource-011624-035902
Bennington Regional Planning Commission. (2024). The Bennington Regional Plan. http://www.bcrcvt.org/uploads/1/1/1/8/111899771/bcrc_regional_plan_november_21_2024_final_adopted.pdf
Benveniste, H., Huybers, P., & Proctor, J. (2025). Global climate migration is a story of who and not just how many. Nature Communications, 16(1), 7752. https://doi.org/10.1038/s41467-025-62969-3
Berberian, A. G., Gonzalez, D. J. X., & Cushing, L. J. (2022). Racial Disparities in Climate Change-Related Health Effects in the United States. Current Environmental Health Reports, 9(3), 451–464. https://doi.org/10.1007/s40572-022-00360-w
Bergman, M. M. (2023, July 31). Vermont Was Supposed to Be a Climate Haven. The Atlantic. https://www.theatlantic.com/science/archive/2023/07/climate-change-safe-states-vermont-floods/674780/
Berlin, C. (2025, July 17). Since the historic floods of 2023, few Vermont residents have buyout money in hand. VT Digger. https://vtdigger.org/2025/07/17/since-the-historic-floods-of-2023-few-vermont-residents-have-buyout-money-in-hand/
Bezgrebelna, M., McKenzie, K., Wells, S., Ravindran, A., Kral, M., Christensen, J., Stergiopoulos, V., Gaetz, S., & Kidd, S. A. (2021). Climate Change, Weather, Housing Precarity, and Homelessness: A Systematic Review of Reviews. International Journal of Environmental Research and Public Health, 18(11), 5812. https://doi.org/10.3390/ijerph18115812
Calvin, K., Dasgupta, D., Krinner, G., Mukherji, A., Thorne, P. W., Trisos, C., Romero, J., Aldunce, P., Barrett, K., Blanco, G., Cheung, W. W. L., Connors, S., Denton, F., Diongue-Niang, A., Dodman, D., Garschagen, M., Geden, O., Hayward, B., Jones, C., … Péan, C. (with Lee, H.). (2023). IPCC, 2023: Climate Change 2023: Synthesis Report. Contribution of Working Groups I, II and III to the Sixth Assessment Report of the Intergovernmental Panel on Climate Change [Core Writing Team, H. Lee and J. Romero (eds.)]. IPCC, Geneva, Switzerland. (First). Intergovernmental Panel on Climate Change (IPCC). https://doi.org/10.59327/IPCC/AR6-9789291691647
Cambell, G., & Wexler, C. (2019). Taxpayer Migration by Age and Income: Evidence from the IRS. Joint Fiscal Office. https://ljfo.vermont.gov/assets/Publications/Presentation/d51fd1049d/Taxpayer-Migration-by-Age-and-Income-SLIDES2-to-post.pdf
Campbell, L., Schwaller, N. L., Nguyen, M. T., & Smith, G. (2022). Stuck in the Middle: The Challenges of Local Government Administration of Post-Hurricane Disaster Mitigation. International Journal of Mass Emergencies & Disasters, 40(2), 155–183. https://doi.org/10.1177/028072702204000203
Center on Budget and Policy Priorities. (2025, August 27). By the Numbers: Harmful Republican Megabill Will Take Health Coverage Away From Millions of People and Raise Families’ Costs | Center on Budget and Policy Priorities. https://www.cbpp.org/research/health/by-the-numbers-harmful-republican-megabill-will-take-health-coverage-away-from
Chittenden Country Regional Planning Commission & Good Jobs In a Clean Environment. (2018). 2018 Chittenden County ECOS Plan. www.ecosproject.com/plan
Clark, M. B., Nkonya, E., & Galford, G. L. (2022a). Flocking to fire: How climate and natural hazards shape human migration across the United States. Frontiers in Human Dynamics, 4, 886545. https://doi.org/10.3389/fhumd.2022.886545
Clark, M. B., Nkonya, E., & Galford, G. L. (2022b). Flocking to fire: How climate and natural hazards shape human migration across the United States. Frontiers in Human Dynamics, 4, 886545. https://doi.org/10.3389/fhumd.2022.886545
Clark, M. B., Nkonya, E., & Galford, G. L. (2025). Exodus of the affluent? Examining climate hazards, migration, and household income in the U.S. Population and Environment, 47(3), 28. https://doi.org/10.1007/s11111-025-00496-5
Climate Action Office. (2025). Pilot Program Launch: Municipal Climate Planning Guides | Climate Change in Vermont. Climate Change in Vermont. https://climatechange.vermont.gov/event/pilot-program-launch-municipal-climate-planning-framework-and-guide
Cotton, E. (2026, February 9). FEMA denies disaster aid for 2025 flooding, leaving NEK towns scrambling. VTDigger. https://vtdigger.org/2026/02/09/fema-denies-disaster-aid-for-2025-flooding-leaving-nek-towns-scrambling/
Cronley, C., Fackler, A., First, J. M., Lee, S., & Tsouris, I. (2024). Persons Experiencing Homelessness during Extreme Temperatures: Lessons for Promoting Socially Inclusive Adaptive Capacity. International Journal of Environmental Research and Public Health, 21(8), 984. https://doi.org/10.3390/ijerph21080984
Cutter, S. L., Boruff, B. J., & Shirley, W. L. (2003). Social Vulnerability to Environmental Hazards. Social Science Quarterly, 84(2), 242–261. https://doi.org/10.1111/1540-6237.8402002
Daigneault, A., Daigle, K., Garlick, S., Hamshaw, K., Lavallee, A., Niles, M., Weiskitte, A., Whitehouse, C., & Woodall, C. (2023). A Resilience Indicators Approach to Ensuring Equitable, Objective, and Continued Investment in Northern Border Communities, Final Project Report. https://www.uvm.edu/d10-files/documents/2025-09/2023-Northern-Borders-Resilience-Indicators.pdf
D’Ambrosio, D. (2023). Very few Vermonters have insurance to help pay for losses from catastrophic flooding. https://www.burlingtonfreepress.com/story/money/2023/08/16/flood-insurance-policies-rare-vermont-homeowners-premiums/7058788000…
D’Amico, E. (2025). Resilient by design: Isolating impactful climate adaptation measures in New England. Npj Climate Action, 4(1), 80. https://doi.org/10.1038/s44168-025-00275-w
Dang, H.-A. H., Hallegatte, S., Nguyen, M. C., & Trinh, T.-A. (2026). Impacts of global warming on subnational poverty and inequality. Nature Climate Change, 16(2), 207–213. https://doi.org/10.1038/s41558-025-02516-6
D’Auria, P. (2025, July 24). Vermont was seen as a climate haven. This summer has complicated that image. VT Digger. https://vtdigger.org/2023/07/24/vermont-was-seen-as-a-climate-haven-this-summer-has-complicated-that-image/
Davis, C. R., Johnson, E., Goldin, S., & Griffard, M. (2025). On the journey to (re)build trust: Understanding how governmental and non-governmental organizations can support marginalized communities through a hazard. International Journal of Disaster Risk Reduction, 116, 105095. https://doi.org/10.1016/j.ijdrr.2024.105095
Deryugina, T. (2017). The Fiscal Cost of Hurricanes: Disaster Aid versus Social Insurance. American Economic Journal: Economic Policy, 9(3), 168–198. https://doi.org/10.1257/pol.20140296
Downton, M. W., & Pielke, R. A. (2001). Discretion without Accountability: Politics, Flood Damage, and Climate. Natural Hazards Review, 2(4), 157–166. https://doi.org/10.1061/(ASCE)1527-6988(2001)2:4(157)
Duffort, L. (2026, March 2). BlueCross BlueShield of Vermont reports surplus, says it’s on a “path to financial recovery.” Vermont Public. https://www.vermontpublic.org/local-news/2026-03-02/bluecross-blueshield-of-vermont-reports-surplus-says-its-on-a-path-to-finan…
Eisenhardt, H. R., Peterson, T., & Schwebel, M. (2024). Establishing a methodology to measure vulnerability of unhoused populations to climate change in the United States. Climate Risk Management, 45, 100629. https://doi.org/10.1016/j.crm.2024.100629
Elmqvist, T., Setälä, H., Handel, S., Van Der Ploeg, S., Aronson, J., Blignaut, J., Gómez-Baggethun, E., Nowak, D., Kronenberg, J., & De Groot, R. (2015). Benefits of restoring ecosystem services in urban areas. Current Opinion in Environmental Sustainability, 14, 101–108. https://doi.org/10.1016/j.cosust.2015.05.001
Energy Action Network. (2026). Climate Workforce Coalition. https://eanvt.org/network-action-teams/climate-workforce/
Fairfax County. (2019). Community Emergency Response Guide. Emergency Management and Security Fairfax County Virginia. https://www.fairfaxcounty.gov/emergencymanagement/cerg
Federal Reserve Bank of St. Louis. (2025). Rental Vacancy Rate for Vermont [VTRVAC] [Dataset]. https://fred.stlouisfed.org/series/VTRVAC
FEMA. (2025, July 29). How a Disaster Gets Declared | FEMA.gov. https://www.fema.gov/disaster/how-declared
FEMA. (2026a). Disasters and Other Declarations | FEMA.gov. https://www.fema.gov/disaster/declarations
FEMA. (2026b). Historical NFIP Claims Information and Trends. https://www.floodsmart.gov/historical-nfip-claims-information-and-trends?map=countries/us/us-vt-all®ion=us-vt&miny=2020&maxy…
FEMA. (2026c). OpenFEMA Data Sets. https://www.fema.gov/about/openfema/data-sets
Feng, S., Krueger, A. B., & Oppenheimer, M. (2010). Linkages among climate change, crop yields and Mexico–US cross-border migration. Proceedings of the National Academy of Sciences, 107(32), 14257–14262. https://doi.org/10.1073/pnas.1002632107
Flanders, C. (2025, August 20). Some Vermonters Will Lose Food Assistance Under Federal Bill. Seven Days. https://www.sevendaysvt.com/news/some-vermonters-will-lose-food-assistance-under-federal-bill-44272778/
Fountain, K., & Duffort, L. (2023, July 26). Preliminary tally indicates Vermont floods damaged more than 4,000 homes and 800 businesses. https://vtdigger.org/2023/07/26/preliminary-tally-indicates-vermont-floods-damaged-more-than-4000-homes-and-800-businesses/
Gaffney, A. (2025). Trump administration asks judge to rule against Vermont’s climate superfund law—VTDigger. https://vtdigger.org/2025/09/16/trump-administration-asks-judge-to-rule-against-vermonts-climate-superfund-law/
Gaffney, A. (2026, January 14). Drought cost Vermont farmers $15.9M. https://vtdigger.org/2026/01/14/drought-cost-vermont-farmers-15-9m/
Garrett, L., Chowdhury, A. M. R., & Pablos-Méndez, A. (2009). All for universal health coverage. The Lancet, 374(9697), 1294–1299. https://doi.org/10.1016/S0140-6736(09)61503-8
Garrett, T. A., & Sobel, R. S. (2003). The Political Economy of FEMA Disaster Payments. Economic Inquiry, 41(3), 496–509. https://doi.org/10.1093/ei/cbg023
Gemenne, F., & Blocher, J. (2017). How can migration serve adaptation to climate change? Challenges to fleshing out a policy ideal. The Geographical Journal, 183(4), 336–347. https://doi.org/10.1111/geoj.12205
Giles, A. (2026, March 2). Federal disaster relief is uncertain. So these towns want to help themselves. Vermont Public. https://www.vermontpublic.org/local-news/2026-03-02/federal-disaster-relief-is-uncertain-so-these-towns-want-to-help-themselves
Goldsmith-Pinkham, P., Gustafson, M. T., Lewis, R. C., & Schwer. (2023). Sea-Level Rise Exposure and Municipal Bond Yields | The Review of Financial Studies | Oxford Academic. Review of Financial Studies, 36(11). https://academic.oup.com/rfs/article-abstract/36/11/4588/7156853
Gourevitch, J. D., Kousky, C., Liao, Y., Nolte, C., Pollack, A. B., Porter, J. R., & Weill, J. A. (2023). Unpriced climate risk and the potential consequences of overvaluation in US housing markets. Nature Climate Change, 13(3), 250–257. https://doi.org/10.1038/s41558-023-01594-8
Gourevitch, J. D., Singh, N. K., Minot, J., Raub, K. B., Rizzo, D. M., Wemple, B. C., & Ricketts, T. H. (2020). Spatial targeting of floodplain restoration to equitably mitigate flood risk. Global Environmental Change, 61, 102050. https://doi.org/10.1016/j.gloenvcha.2020.102050
Guber, A. (2025, July 10). Vermont town faces $20 million in flood damages with a just $1.3 million budget. WPTZ. https://www.mynbc5.com/article/vermont-town-faces-20-million-in-flood-damages-with-a-just-13-million-budget/65370180
Guo, L., Fang, M., Liu, L., Chong, H., Zeng, W., & Hu, X. (2025). The development of disaster preparedness education for public: A scoping review. BMC Public Health, 25(1), 645. https://doi.org/10.1186/s12889-025-21664-0
Hackett, K. A., Saegert, S., Dozier, D., & Marinova, M. (2019). Community land trusts: Releasing possible selves through stable affordable housing. Housing Studies, 34(1), 24–48. (136520598). https://doi.org/10.1080/02673037.2018.1428285
Hallegatte, S., & Rozenberg, J. (2017). Climate change through a poverty lens. Nature Climate Change, 7(4), 250–256. https://doi.org/10.1038/nclimate3253
Hamshaw, K. A., & Baker, D. (2024). Manufactured housing communities and climate change: Understanding key vulnerabilities and recommendations for emergency managers. Journal of Emergency Management, 22(7), 87–99. https://doi.org/10.5055/jem.0845
Hauer, M. E., Jacobs, S. A., & Kulp, S. A. (2024). Climate migration amplifies demographic change and population aging. Proceedings of the National Academy of Sciences, 121(3), e2206192119. https://doi.org/10.1073/pnas.2206192119
Hirschfeld, P. (2025, September 29). State plans temporary reprieve for Vermonters facing loss of SNAP benefits. Vermont Public. https://www.vermontpublic.org/local-news/2025-09-29/state-plans-temporary-reprieve-vermonters-loss-snap-benefits
Hoffmann, R., Abel, G., Malpede, M., Muttarak, R., & Percoco, M. (2024). Drought and aridity influence internal migration worldwide. Nature Climate Change, 14(12), 1245–1253. https://doi.org/10.1038/s41558-024-02165-1
Home—Vermont 211. (n.d.). VT 211. Retrieved February 22, 2026, from https://vermont211.org/
Housing & Homelessness Alliance of Vermont, Chittenden County Homeless Alliance, & Vermont Balance of State Continuum of Care. (2025). 2025 State of Homelessness in Vermont Report:Based on the 2025 Vermont Point-in-Time Count and June 2025 Coordinated Entry Data. https://helpingtohousevt.org/wp-content/uploads/2025/07/FINAL-State-of-Homelessness-2025.pdf
Hunter, L. M., Koning, S., Fussell, E., King, B., Rishworth, A., Merdjanoff, A., Muttarak, R., Riosmena, F., Simon, D. H., Skop, E., & Van Den Hoek, J. (2021). Scales and sensitivities in climate vulnerability, displacement, and health. Population and Environment, 43(1), 61–81. https://doi.org/10.1007/s11111-021-00377-7
International Labour Office. (2024). World Social Protection Report 2024-2026: Universal Social Protection for Climate Action and a Just Transition. https://doi.org/https://doi.org/10.54394/ZMDK5543
International Organization for Migration. (2024). World Migration Report 2024. United Nations. https://publications.iom.int/books/world-migration-report-2024
Ipsos, & National Public Radio. (2019). Teachers Agree That Climate Change is Real and Should Be Taught in Schools. https://www.ipsos.com/en-us/news-polls/teachers-agree-climate-change-real-and-should-be-taught-schools-04-22-2019
Jenson, J. (1998). Mapping social cohesion: The state of Canadian research. Family Network, CPRN. https://canadacommons.ca/artifacts/1498948/-/2157886/
Jeon, W., Barrage, L., & Walsh, K. J. (2024). Pricing Climate Risks: Evidence from Wildfires and Municipal Bonds | Working Paper | ifo | CESifo. https://www.ifo.de/en/cesifo/publications/2024/working-paper/pricing-climate-risks-evidence-wildfires-and-municipal-bonds
Khavarian-Garmsir, A. R., Sharifi, A., Sadeghi, A., & Allam, Z. (2026). How does the climate change and migration nexus result in maladaptation? Climate Policy, 26(4), 550–565. https://doi.org/10.1080/14693062.2025.2518298
Kim, H. S., Matthes, C., & Phan, T. (2025). Severe Weather and the Macroeconomy. American Economic Journal: Macroeconomics, 17(2), 315–341. https://doi.org/10.1257/mac.20220329
King and DuBois Inc. (2025). COVENTRY ICE JAM FLOOD STUDY OF THE BLACK RIVER COVENTRY, VERMONT. https://coventryvt.org/wp-content/uploads/2025/10/Coventry-Ice-Jam-Summary-Report-Draft-October-2025.pdf
Kline, M., & Cahoon, B. (2010). Protecting River Corridors in Vermont1. JAWRA Journal of the American Water Resources Association, 46(2), 227–236. https://doi.org/10.1111/j.1752-1688.2010.00417.x
Kroll, A. K., & Blondin, C. (2025). Agency of Commerce & Community Development (ACCD) Department of Housing and Community Development (DHCD) Vermont 2025 HUD -Community Development Block Grant Disaster Recovery (CDBG-DR) Action Plan. https://outside.vermont.gov/agency/ACCD/ACCD_Web_Docs/CD/VCDP/CDBG-DR/Vermont-DRAFT-2025-CDBG-DR-Action-Plan-4-21-25.pdf?_gl=1*….
Labowitz, S. (2025, November 25). Carnegie Endowment for International Peace [Database]. Tracking U.S. Federal Disaster Spending: The Disaster Dollar Database. https://carnegieendowment.org/features/disaster-dollar-database?lang=en
Lamoille County Planning Commission. (2024). 2023 – 2031 LAMOILLE COUNTY REGIONAL PLAN. https://lamoillecounty.govoffice.com/vertical/Sites/%7B3C01460C-7F49-40F5-B243-0CA7924F23AF%7D/uploads/Regional_Plan_Update_Fin…
Lantieri, N., Black-Plumeau, L., Gilding, L., Anderson, W., Leonard, S., & Carrington, H. (2024). Vermont Housing Needs Assessment: 2025-2029. Vermont Housing Finance Agency. https://outside.vermont.gov/agency/ACCD/ACCD_Web_Docs/Housing/Housing-Needs-Assessment/2025-2029/VT-HNA-2025.pdf?_gl=1*hod2y4*_…
Marandi, A., & Main, K. L. (2021). Vulnerable City, recipient city, or climate destination? Towards a typology of domestic climate migration impacts in US cities. Journal of Environmental Studies and Sciences, 11(3), 465–480. https://doi.org/10.1007/s13412-021-00712-2
Mazzoleni, M., Di Baldassarre, G., Hagström, A., & Raffetti, E. (2026). Drought is associated with human migration in agriculture-dependent middle-income countries. Communications Earth & Environment. https://doi.org/10.1038/s43247-026-03358-6
McCallum, K. (2024, October 9). Flooded Vermonters Want Home Buyouts. But Some Towns Are Saying No. Seven Days. https://www.sevendaysvt.com/news/vermonters-want-buyouts-for-their-flooded-homes-some-towns-are-saying-no-42022929/
Miao, Q., Abrigo, M., Hou, Y., & Liao, Y. (Penny). (2023). Extreme Weather Events and Local Fiscal Responses: Evidence from U.S. Counties. Economics of Disasters and Climate Change, 7(1), 93–115. https://doi.org/10.1007/s41885-022-00120-y
Mount Ascutney Regional Commission. (2025). FY 2025 Annual Report. https://acrobat.adobe.com/id/urn:aaid:sc:VA6C2:245f81f3-3d77-4ca1-91af-407ce7e9da30
Northeast Vermont Development Association. (2018). Regional Plan for the Northeast Kingdom 2015-2023. https://www.nvda.net/nvda-regional-plan/2018FullPlan.pdf
Northeast Vermont Development Association. (2025). 75th Annual Report. https://www.nvda.net/files/FBAnnualMtg10-09-25.pdf#:~:text=In%20FY25%2C%20NEK%20communities%20were%20awarded%20over,resiliency%….
Oliver, A. F., Charlotte. (2025, September 28). Vermont’s drought is straining communities and leading residents to suffer. VTDigger. https://vtdigger.org/2025/09/28/vermonts-drought-is-straining-communities-and-leading-residents-to-suffer/
Opperman, J. J., & Galloway, G. E. (2022). Nature-based solutions for managing rising flood risk and delivering multiple benefits. One Earth, 5(5), 461–465. https://doi.org/10.1016/j.oneear.2022.04.012
Otto, I. M., Reckien, D., Reyer, C. P. O., Marcus, R., Le Masson, V., Jones, L., Norton, A., & Serdeczny, O. (2017). Social vulnerability to climate change: A review of concepts and evidence. Regional Environmental Change, 17(6), 1651–1662. https://doi.org/10.1007/s10113-017-1105-9
Oxford Policy Management. (2017). Shock-Responsive Social Protection Systems Research: Literature review (2nd Edition). Oxford Policy Management. https://www.opml.co.uk/files/Publications/a0408-shock-responsive-social-protection-systems/srsp-literature-review.pdf
Pintair, O. Q. (2023, July 19). Facing widespread need, Vermonters turn to grassroots networks of help. VTDigger. https://vtdigger.org/2023/07/19/as-floods-widen-caverns-of-need-vermonters-turn-to-grassroots-help/
PolicyMap. (2025). https://www-policymap-com.ezproxy.uvm.edu/newmaps/e/uvm
Premrov, T., & Schnetzer, M. (2023). Social mix and the city: Council housing and neighbourhood income inequality in Vienna. Urban Studies, 60(4), 752–769. https://doi.org/10.1177/00420980221119408
Public Assets Institute. (2023, August 21). Another Flood Casualty: Vermont Jobs. https://publicassets.org/research-publications/another-flood-casualty-vermont-jobs
Public Assets Institute. (2025). State of Working Vermont 2025. https://publicassets.org/wp-content/uploads/2025/12/SWVT-2025.pdf
Qiang, Y. (2019). Disparities of population exposed to flood hazards in the United States. Journal of Environmental Management, 232, 295–304. https://doi.org/10.1016/j.jenvman.2018.11.039
Quinton, J., Nesbitt, L., & Sax, D. (2022). How well do we know green gentrification? A systematic review of the methods. Progress in Human Geography, 46(4), 960–987. https://doi.org/10.1177/03091325221104478
Rabbitt, M. P., Reed-Jones, M., Hales, L. J., Burke, M. P., & United States. Department of Agriculture. Economic Research Service. (2024). Household food security in the United States in 2023. Economic Research Service, U.S. Department of Agriculture. https://doi.org/10.32747/2024.8583175.ers
Ramos, A. (2025). Feeling the Heat: Navigating Extreme Weather, Mobility, and Routines of the Unhoused and Unsheltered. Journal of Health and Human Services Administration, 48(3–4), 79–95. https://doi.org/10.1177/10793739251382599
Raymond, N. (2025, December 11). Trump administration unlawfully canceled disaster prevention program, US judge rules. Reuters. https://www.reuters.com/legal/government/trump-administration-unlawfully-canceled-disaster-prevention-program-us-judge-2025-12-…
Ren, Q., Panikkar, B., & Galford, G. (2023). Vermont Environmental Disparity Index and Risks. Environmental Justice, 16(6), 418–431. https://doi.org/10.1089/env.2021.0063
Resilience Hub. (2026). Resilience Hub Toolkit | Build a Community Resilience Hub. https://resiliencetoolkit-org.onrender.com/
Resilience Initiative for Vermont Empowerment and Recovery (RIVER). (2025). Resilience Initiative for Vermont Empowerment and Recovery (RIVER). https://riverprojectsvt.org
Reynolds, P. (2025, June 11). Progress Report: In Vermont, A Push for Stronger Flood Protections. https://www.clf.org/blog/progress-report-in-vermont-a-push-for-stronger-flood-protections/
Rutland Regional Planning Commission. (2025). Rutland Regional Plan June 2026-2034 [Pre-Application Draft]. https://storymaps.arcgis.com/stories/5018a6bc74d34a59aca763981e78355a
Sabol, M., Grover, A., & Dresner, M. (2026). Public Decision Making in Disaster Relief Operations: The Case of the U.S. Federal Emergency Management Agency (FEMA). Risk, Hazards & Crisis in Public Policy, 17(1), e70053. https://doi.org/10.1002/rhc3.70053
Sallis, J. F., Floyd, M. F., Rodríguez, D. A., & Saelens, B. E. (2012). Role of Built Environments in Physical Activity, Obesity, and Cardiovascular Disease. Circulation, 125(5), 729–737. https://doi.org/10.1161/CIRCULATIONAHA.110.969022
Satizábal, P., Cornes, I., De Lourdes Melo Zurita, M., & Cook, B. R. (2022). The power of connection: Navigating the constraints of community engagement for disaster risk reduction. International Journal of Disaster Risk Reduction, 68, 102699. https://doi.org/10.1016/j.ijdrr.2021.102699
Shaffer, R., Deller, S. C., & Marcouiller, D. W. (2004). Community economics: Linking theory and practice (2nd ed). Blackwell publishing. https://cir.nii.ac.jp/crid/1971149384776720285
Shi, L., & Moser, S. (2021). Transformative climate adaptation in the United States: Trends and prospects. Science, 372(6549), eabc8054. https://doi.org/10.1126/science.abc8054
Shu, E. G., Porter, J. R., Hauer, M. E., Sandoval Olascoaga, S., Gourevitch, J., Wilson, B., Pope, M., Melecio-Vazquez, D., & Kearns, E. (2023). Integrating climate change induced flood risk into future population projections. Nature Communications, 14(1), 7870. https://doi.org/10.1038/s41467-023-43493-8
Silva Rodríguez De San Miguel, J. A., Martínez Díaz, E., & Monroy Becerril, D. M. (2021). The relationship between climate change and internal migration in the Americas. Management of Environmental Quality: An International Journal, 32(4), 822–839. https://doi.org/10.1108/MEQ-01-2021-0020
Sironi, A. C. B., & Emmanuel, M. (Eds.). (2019). Glossary on Migration. International Migration Law, No. 34. https://publications.iom.int/books/international-migration-law-ndeg34-glossary-migration
Soares, R., A. Balerna, J., Quainoo, R., C. Merrill, S., Ali-Khan, M., Shrum, T. R., & Koliba, C. J. (2026). “The Great Vermont Floods of 2023”: A Risk and Crisis Communication Assessment. Society & Natural Resources, 39(2), 309–331. https://doi.org/10.1080/08941920.2025.2553353
Sobhaninia, S. (2024). The Social Cohesion Measures Contributing to Resilient Disaster Recovery: A Systematic Literature Review. Journal of Planning Literature, 39(4), 519–534. https://doi.org/10.1177/08854122241238196
State of Vermont Flood Ready. (2024, April 1). Community Reports. https://floodready.vermont.gov/assessment/community_reports
State of Vermont Office of the State Treasurer. (2023). Governor Scott and Treasurer Pieciak Announce Program to Save Flood Impacted Municipalities Millions | Office of the State Treasurer. https://www.vermonttreasurer.gov/press-releases/governor-scott-and-treasurer-pieciak-announce-program-save-flood-impacted
Stroud, H. M., Kirshen, P. H., & Timmons, D. (2023). Monetary evaluation of co-benefits of nature-based flood risk reduction infrastructure to promote climate justice. Mitigation and Adaptation Strategies for Global Change, 28(1), 5. https://doi.org/10.1007/s11027-022-10037-2
Tamasiga, P., Mogomotsi, P. K., Onyeaka, H., & Mogomotsi, G. E. J. (2024). Amplifying climate resilience: The impact of social protection, social cohesion, and social capital on public support for climate change action. Sustainable Environment, 10(1), 2361568. https://doi.org/10.1080/27658511.2024.2361568
Tate, E., Rahman, M. A., Emrich, C. T., & Sampson, C. C. (2021). Flood exposure and social vulnerability in the United States. Natural Hazards, 106(1), 435–457. https://doi.org/10.1007/s11069-020-04470-2
Temkin, K., Theodos, B., & Price, D. (2010). Shared Equity Homeownership Evaluation: Case Study of Champlain Housing Trust. The Urban Institute. https://www.urban.org/sites/default/files/publication/29286/412243-Shared-Equity-Homeownership-Evaluation-Case-Study-of-Champla…
The Flood Safety Act. (2024). Vermont’s Flood Safety Act of 2024. https://floodready.vermont.gov/flood-safety-act
The Pew Charitable Trusts. (2025). What Waning Federal Disaster Aid Would Mean for State Budgets. https://pewtrsts.org/4nBXwq3
Torani, S., Majd, P. M., Maroufi, S. S., Dowlati, M., & Sheikhi, R. A. (2019). The importance of education on disasters and emergencies: A review article. Journal of Education and Health Promotion, 8, 85. https://doi.org/10.4103/jehp.jehp_262_18
Trudeau, M., Nieuwendyk, L., Belon, A. P., & Nykiforuk, C. I. J. (2025). Evidence-informed recommendations for municipal supports of people experiencing homelessness during extreme weather events. Local Environment, 1–25. https://doi.org/10.1080/13549839.2025.2566518
Ullman, L. (2025, December 12). Thousands of Vermonters face skyrocketing premiums as Senate rejects health care subsidy extensions. Https://Www.Wcax.Com. https://www.wcax.com/2025/12/12/thousands-vermonters-face-skyrocketing-premiums-senate-rejects-health-care-subsidy-extensions/
U.S. Bureau of Economic Analysis. (2026a). Gross Domestic Product: All Industry Total in Vermont [VTNQGSP] [Dataset]. FRED, Federal Reserve Bank of St. Louis. https://fred.stlouisfed.org/series/VTNQGSP
U.S. Bureau of Economic Analysis. (2026b). Regional Data SAGDP9 Real GDP by State [Dataset]. API. https://www.bea.gov/itable/regional-gdp-and-personal-income
U.S. Bureau of Economic Analysis. (2026c). SQGDP1 State quarterly gross domestic product (GDP) summary. https://www.bea.gov/data/gdp/gdp-state
U.S. Census Bureau. (2020). “Total Population,” Decennial Census, Table P1, 2020 [Dataset]. https://data.census.gov/table?g=040XX00US50
U.S. Census Bureau. (2022). County Business Patterns and Economic Census 2022 [Dataset]. https://www.census.gov/data/datasets/2022/econ/cbp/2022-cbp.html
U.S. Census Bureau. (2023). “Age of Householder by Household Income in the Past 12 Months (in 2024 Inflation-Adjusted Dollars)” American Community Survey 5-Year Estimates Subject Tables, Table B19037. [Dataset]. https://data.census.gov/table/ACSDP5Y2024.DP05?q=older+population&g=040XX00US50
U.S. Census Bureau. (2024a). “ACS Demographic and Housing Estimates.” American Community Survey 5-Year Estimates Subject Tables, Table DP05. [Dataset]. https://data.census.gov/table/ACSDP5Y2024.DP05?q=older+population&g=040XX00US50
U.S. Census Bureau. (2024b). Age and Sex. American Community Survey, ACS 5-Year Estimates Subject Tables, Table S0101.[Dataset]. https://data.census.gov/table/ACSST5Y2024.S0101?q=Age+and+Sex&g=040XX00US50
U.S. Census Bureau. (2024c). Poverty in States and Metropolitan Areas: 2024. https://www.census.gov/library/publications/2025/acs/acsbr-026.html
U.S. Census Bureau. (2024d). “Race,” American Community Survey 5-Year Estimates Subject Tables, Table B02001, 2024 [Dataset]. https://data.census.gov/table/ACSDT5Y2024.B02001?q=vermon
U.S. Census Bureau of Labor Statistics. (2026). Quarterly Census of Employment and Wages [Dataset]. https://api.bls.gov/publicAPI/v2/timeseries/data//api/2024/a/area/50000.csv
U.S. Chamber of Commerce, Allstate, & U.S. Chamber of Commerce Foundation. (2024). The Economic Benefits of Investing in Climate Resilience. https://www.uschamber.com/security/the-preparedness-payoff-the-economic-benefits-of-investing-in-climate-resilience
U.S. Climate Vulnerability Index. (2026). Overall Climate Vulnerability in The U.S. [Dataset]. https://map.climatevulnerabilityindex.org/map/cvi_overall/usa?mapBoundaries=Tract&mapFilter=0&reportBoundaries=Tract&geoContext…
USGCRP. (2023). Fifth National Climate Assessment (No. 5th). U.S. Global Change Research Program. https://nca5.climate.us/downloads/NCA5_2023_FullReport.pdf
Van Leuven, A. J., & Schaefer, K. A. (2025). Are Downtown Businesses More Vulnerable to Extreme Heat? 2025 Rural Renewal Symposium, Woodward, Oklahoma. https://extension.umaine.edu/business/upcoming-events/are-downtown-businesses-more-vulnerable-to-extreme-heat/
VAPDA. (2025). Fiscal Year 2025 ANNUAL REPORT. Vermont Association of Planning and Development Agencies. https://www.ccrpcvt.org/wp-content/uploads/2025/09/FY25-VAPDA-Annual-Report.pdf
Vermont Agency of Administration. (2023, October 23). Match estimate for the Summer 2023 Floods. https://legislature.vermont.gov/Documents/2024/WorkGroups/Senate%20Finance/July%20Floods/W~Doug%20Farnham~July%20Flood%20-%20Ma…
Vermont Agency of Commerce and Community Development. (2026). Community Development Block Grant Disaster Recovery (CDBG-DR) Funds. https://disasterrecovery.vermont.gov/individuals/long-term-recovery-groups
Vermont Agency of Human Services, & Department of Health. (2025). Healthy Aging in Vermont: An Overview of Adults 60+ Years Old. https://www.healthvermont.gov/sites/default/files/document/hsi-factsheet-healthy-aging-in-vermont.pdf
Vermont Agency of Natural Resources. (2017). Vermont Stormwater Management Manual Rule and Design Guidance. https://dec.vermont.gov/sites/dec/files/wsm/stormwater/docs/Permitinformation/2017%20VSMM_Rule_and_Design_Guidance_04172017.pdf
Vermont Agency of Natural Resources, & Vermont State Treasurer’s Office. (2025). Vermont Resilience Implementation Strategy. https://climatechange.vermont.gov/resilience-strategy/overview
Vermont Climate Council. (2025). Vermont Climate Action Plan 2025. https://outside.vermont.gov/agency/anr/climatecouncil/Shared%20Documents/VermontClimateActionPlan2025.pdf?_gl=1*z6ffrc*_ga*MTIx…..
Vermont Department of Public Safety Vermont Emergency Management. (2026). Flood Resilient Communities Fund | Vermont Emergency Management. https://vem.vermont.gov/flood-resilient-communities-fund
Vermont Disaster Recovery. (2025). Recovery. Rebuilding. Resilience. Reflection on the Vermont Storms of 2023 and 2024. https://map.vermont.gov/2025-flood-anniversary?_gl=1*h9bplz*_ga*Njc2NTk3MjU5LjE3NDYwMTUxNTI.*_ga_V9WQH77KLW*czE3NTM0NjIwNzQkbzI…
Vermont Disaster Recovery. (2026). Long Term Recovery Groups. https://disasterrecovery.vermont.gov/individuals/long-term-recovery-groups
Vermont Emergency Management. (2023a). 211 Flood Damage Report [Dataset]. https://vermont211.org/
Vermont Emergency Management. (2023b). Vermont State Hazard Mitigation Plan. Vermont Emergency Management. https://vem.vermont.gov/plans/SHMP
Vermont Emergency Management. (2026). Community Preparedness. https://vem.vermont.gov/preparedness
Vermont Geoportal. (2026). Floody Ready Vermont Atlas. https://maps.vermont.gov/ANR/Html5Viewer/Index.html?configBase=https://maps.vermont.gov/Geocortex/Essentials/ANR/REST/sites/Foc…
Vermont Healthcare 911. (2026, February 8). Vermont Premiums are the Most Expensive in the Country. VT Healthcare 911. https://www.vhc911.org/vhc911-stat/v1
Vermont Joint Fiscal Office. (2025). 2024 Vermont Basic Needs Budgets And Livable Wage Report. https://ljfo.vermont.gov/assets/Publications/Basic-Needs-Budget/GENERAL-379098-v2-2025_Basic_Needs_Budget_Report.pdf
Vermont Public Staff. (2024, July 13). How to help Vermont communities reeling from July 2024 floods. https://www.vermontpublic.org/local-news/2024-07-13/how-to-help-vermont-communities-reeling-from-july-2024-floods
Vermont Research Open Source Program Office, Vermont Complex Systems Institute, & Leahy Institute for Rural Partnerships. (2026). Vermont Livability Map. https://verso-uvm.github.io/Vermont-Livability-Map/
Vermont Secretary of State’s Office, National Conference on Citizenship, Center for Rural Studies at UVM, & Advisory Group. (2025). 2025 Vermont Civic Health Index. https://www.uvm.edu/d10-files/documents/2025-03/Vermont-CHI-FINAL-1.17.25.pdf
Vermont State Housing Authority. (2026). Rapid Response Mobile Home Infill Program (MHIP). https://www.affordablehomes.vermont.gov/about
Vo, C. D. (2025). Reinforcing Community Climate Resilience through Social Cohesion: Opportunities for Local Governments in Southern California. UCLA Journal of Environmental Law and Policy, 43(1). https://doi.org/10.5070/L543165395
Wing, O. E. J., Lehman, W., Bates, P. D., Sampson, C. C., Quinn, N., Smith, A. M., Neal, J. C., Porter, J. R., & Kousky, C. (2022). Inequitable patterns of US flood risk in the Anthropocene. Nature Climate Change, 12(2), 156–162. https://doi.org/10.1038/s41558-021-01265-6
Winsemius, H. C., Jongman, B., Veldkamp, T. I. E., Hallegatte, S., Bangalore, M., & Ward, P. J. (2018). Disaster risk, climate change, and poverty: Assessing the global exposure of poor people to floods and droughts. Environment and Development Economics, 23(3), 328–348. https://doi.org/10.1017/S1355770X17000444
Yang, X., Chen, D., Wahab, I., & Burman, A. (2025). Evidence of climate and economic drivers affecting migration in an unequal and warming world. Communications Earth & Environment, 6(1), 782. https://doi.org/10.1038/s43247-025-02811-2
Zhou, W., Huang, G., Pickett, S. T. A., Wang, J., Cadenasso, M. L., McPhearson, T., Grove, J. M., & Wang, J. (2021). Urban tree canopy has greater cooling effects in socially vulnerable communities in the US. One Earth, 4(12), 1764–1775. https://doi.org/10.1016/j.oneear.2021.11.010