Authors
Elizabeth Bansbach*
* Authors contributed equally
Gwen Ellis*
* Authors contributed equally
About
Recommended citation for chapter
Bansbach, E. and Ellis, G., 2026, Chapter 5: Fish and Wildlife. In Galford, G.L., Balerna, J.A., Turner, H.C., Sardonis, A., Peplinski H. (Eds). The Vermont Climate Assessment 2025. Burlington, Vermont: Climate Measurements Center of Excellence, Gund Institute for Environment at the University of Vermont. DOI: 10.5281/zenodo.20272849. Accessed online at https://vtclimate.org.
Author Contributor Roles Taxonomy (CRediT) statement
Elizabeth Bansbach: Conceptualization, Investigation, Writing – original draft, Writing – review & editing; Gwen Ellis: Conceptualization, Investigation, Writing – original draft, Writing – review & editing, Visualization, Supervision
Acknowledgements
The authors thank Elise Lauterbur, Kris Stepenuck, Evan Horne, and two anonymous reviewers whose thoughtful reviews and contributions helped refine and strengthen this chapter. The authors also thank Hannah C. Turner for spatial data visualization and Kent McFarland and Michael Hallworth from the Vermont Center for Ecostudies for data sourcing and content contributions.
Downloads
Please use the following accessible downloads for your own needs.To find downloads of other chapters in VCA 2025, please go to Downloads.
- Fish and Wildlife (high resolution PDF)
- Fish and Wildlife (low resolution PDF)
- Fish and Wildlife brief (PDF)
- Fish and Wildlife slidedeck (PPTX)
- alt-text is attached to each figure.
- alt-text is attached to each figure.
Table of contents
- 5.0 Executive summary
- 5.1 Key messages
- 5.2 Background
- 5.3 Terrestrial animal movement and connectivity
- 5.4 Changes in terrestrial species biodiversity
- 5.5 Interconnected effects of climate change on aquatic ecosystems
- 5.6 Specific aquatic ecosystem effects
- 5.7 Changes in inter-species dynamics
- 5.8 Climate-minded management strategies
- 5.9 Traceable accounts
- 5.10 Resources
- 5.11 References
5.0 Executive summary
Vermont ecosystems and wildlife will face considerable impacts due to climate change including changes to species’ behaviors, habitat suitability and quality, and ecosystem functioning. Fish and wildlife are an integral part of Vermont's culture and landscape affecting agriculture and food systems, recreation and tourism, and human health. Conserving habitat helps protect fish and wildlife and preserves important ecosystems services from pollination to subsistence harvesting to nutrient cycling. The findings presented in this chapter are relevant to diverse audiences, including resource managers, landowners, land stewards, recreators, and everyday Vermonters.
Current and expected impacts on fish and wildlife from climate change include:
- Species’ distribution across the landscape will change due to threats to habitat and resource quality. To follow appropriate habitat and temperature conditions, species may move northward out of Vermont or to higher elevations. Shifting ranges could cause local or regional extinctions of some native Vermont species, such as Bicknell’s thrush, spruce grouse, and Canada lynx.
- Some species, like those with very specific habitat requirements or limited dispersal abilities, cannot move and so are more likely to face disproportionate burdens of climate change. These include cold-water fish that are important for Vermonters’ livelihoods, amphibians that are indicators of environmental quality, and invertebrates that form the cornerstone of food webs.
- Pollinator biodiversity is predicted to decrease, which will likely damage agricultural and food system production.
- As Vermont grows warmer, introduced species are predicted to proliferate. This may increase competition for limited resources as well as potentially harm forest and ecosystem health. However, it could also bolster Vermont’s biodiversity, as cold-adapted species leave Vermont with northward range shifts.
- Disease dynamics will change as climate change increases the amount of time vectors—like ticks and mosquitoes—can be active. New or more frequent contact among different species may also alter disease dynamics. These changes will likely result in more infected human and wildlife individuals.
Loss of suitable habitat is a major driver of biodiversity loss, which is compounded by climate change impacts. Conserving land that provides habitat for at-risk species is one of the best strategies to secure Vermont’s biodiversity for generations to come. Conserving land has co-benefits, such as improving water quality and storing carbon, that can act as climate change mitigation and adaptation methods. This chapter will primarily discuss preservation and conservation of forests and wetlands because of their importance as crucial ecosystems in the state and because of Vermont’s ongoing commitment to their conservation. In addition to conserving land, researchers and managers should prioritize identifying species that are at the edge of their suitable habitat range, where these habitat edges exist, how those edges are expected to change, and what the timeline of change will be.
Vermont’s fish and wildlife will change — in where they are, how they survive, and how they interact — with warming temperatures and changing precipitation. Management strategies that prioritize species protections and land conservation will be essential to protecting not just fish and wildlife communities but Vermonters’ livelihoods.
5.1 Key messages
- As temperatures warm, the geographic ranges of species may shift northward or toward higher elevations. Shifting ranges could cause local or regional extinctions of some native Vermont species, such as Bicknell’s thrush, spruce grouse, and Canada lynx. Non-native species ranges may expand into Vermont.
- Increased frequency of flooding, drought, and extreme temperature events may impact the viability of some species. Ectotherms and species with limited dispersal are particularly at risk.
- The combined influence of warming temperatures and altered precipitation regimes may harm aquatic ecosystems and threaten suitable habitats for fish and game populations, in part through more frequent cyanobacteria blooms, new species, and altered water temperature and dissolved oxygen dynamics.
- Extended warmer fall temperatures, winter temperature fluctuations, earlier snow melt, and warmer spring temperatures may cause phenological mismatches for wildlife, including pollinators and important prey species such as snowshoe hares. Loss of biodiversity and ecosystem functioning are anticipated if wildlife cannot adapt.
- Decreases in winter snowpack and warmer annual temperatures may exacerbate the effects of diseases such as white-nose syndrome and avian influenza, introduce novel pathogens, and increase transmission across species.
5.2 Background
Vermont is home to more than 250 bird species, 92 fish species, 58 mammal species, 40 reptile and amphibian species, and thousands of invertebrate species (Vermont Fish and Wildlife Department, 2025b). In addition to their intrinsic value as part of Vermont’s natural heritage, fish and wildlife species provide ecosystem services, recreation, agriculture, and contribute to the state’s economy. A 2011 report estimated that Vermont residents spent $704 million on fish and wildlife-related activities, such as fishing, hunting, and outdoor recreation (Vermont Fish and Wildlife Department, 2015).
However, climate change in Vermont has caused rising average air and water temperatures, shorter periods of snow fall, and more frequent and intense precipitation and drought events—all which impact species habitat, biodiversity, and abundance. The biodiversity of an ecosystem is an indicator of ecosystem health. High biodiversity protects ecological function including the ability of plants and animals to thrive, reproduce, migrate, and move as well as the maintenance of abiotic natural processes. As biodiversity is threatened, so is the survival of species and their populations (Oliver et al., 2015; Peterson et al., 1998). Decreasing biodiversity is occurring across multiple scales—in Vermont, in North America, and across the globe (Galford et al., 2021; Hoegh-Guldberg et al., 2018; McElwee et al., 2023). While climate change contributes to direct and indirect threats to biodiversity among Vermont fish and wildlife, many species are also vulnerable to non-climate stressors, like land development and pollution, that are difficult to isolate. Effective conservation will therefore require collaboration across multiple sectors, strategic land preservation, and whole-ecosystem management.
5.3 Terrestrial animal movement and connectivity
The distribution of species across a landscape is partially determined by the environmental and climate conditions in which they can survive and thrive. Since 1900, Vermont’s annual average temperature has warmed 3.6°F (2°C) and is projected to increase another 2°F (1.1°C) by 2050, or 4–9°F (2.2–5°C) by 2100 under a high emissions scenario (see Climate Change in Vermont 2.4.2 and 2.9). A warmer environment will affect where wildlife can live. To follow their climatic niche, or the environmental conditions under which they best function, animals may move to new locations (Thomas, 2010). With increasing temperatures, this migration can result in movement to higher latitudes or higher elevation, or both. In Vermont, this means cold-adapted species could migrate out of the state or move higher up mountainsides. It also means warm-adapted species could move into the state through expanding ranges. Warming temperatures could also alter the climatic niche of resources that the species rely on, prompting migration. For example, as tree range shifts higher in elevation due to warmer temperatures at lower elevations, species dependent on those trees will be forced to live at higher elevations.
Migration to follow a climactic niche under rapid climate warming is only possible for highly mobile animals with greater dispersal capabilities such as some birds, mammals, and insects. Wildlife that are constrained by narrow habitat availability and limited generational movement will lag behind the rate of environmental change and be unable to migrate to new habitats, increasing the risk of extinction (Samuels, 2022). For instance, if stream temperatures exceed preferred thresholds, cold-water fish species may not be able to travel throughout their historic range, highlighting the necessity for species-specific management (Tandon, 2021; see 5.6). Interventions like assisted migration can counteract limitations of wildlife dispersal (see Box 5-1). Further research is required to identify species that are at the edge of their suitable habitat range, where these habitat edges exist, how they will change, and the timeline of change.
Range expansions are also introducing new species to Vermont. New species may outcompete native species or become forest or agricultural pests. Although many forest and agricultural pests are introduced through human movement, populations may become established or increase in size under favorable conditions associated with climate change.
Increased temperatures and other environmental stressors can create ideal circumstances and new opportunities for some species to thrive. For many pest populations, cold, harsh winters reduced population numbers. Milder winters due to climate change may increase these species’ distribution ranges and likelihood of overwinter survival. The creation of favorable conditions for agricultural pests to survive will have negative effects on plants and crop yields (Skendžić et al., 2021; see Agriculture and Food Systems 6.3.4). Longer growing seasons allow more time for pests to proliferate, and warmer air temperatures may bring pests northward, introducing new pests into Vermont (see 5.4.2).
Box 5-1: Assisted migration—a management consideration
Assisted migration is a potential management strategy to be used when habitat suitability decreases and wildlife need to migrate but cannot, usually due to limited dispersal capabilities. Whole populations can be relocated to new locations with familiar climate conditions. Assisted migration can also include genetic rescue, relocating individuals with advantageous genetic diversity to regions with struggling populations to improve resilience. For example, warm-adapted individuals may be moved to areas with non-warm-adapted populations, or individuals may be moved from large populations to more isolated populations.
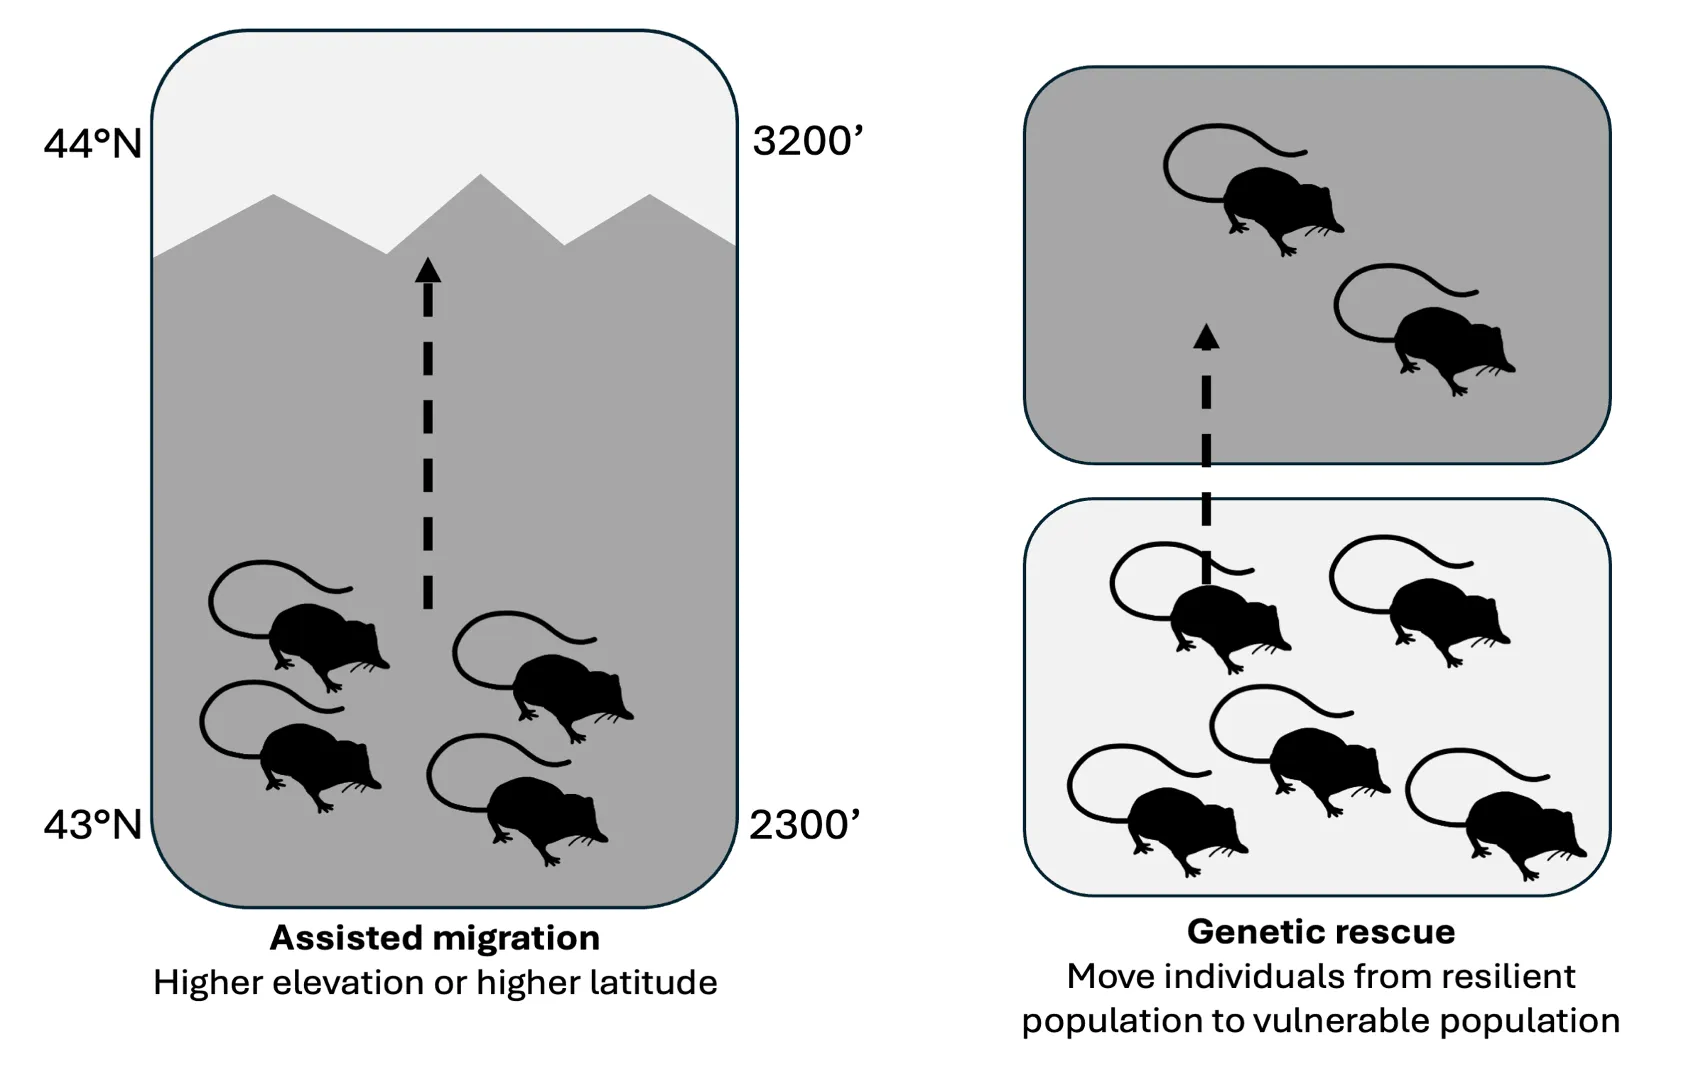
Source: This chapter
Example: Assisted migration is not currently a management strategy for the long-tailed (or rock) shrew (Sorex dispar), but it is a Vermont species with which the method could be considered. The long-tailed shrew has limited dispersal capabilities and populations are isolated, increasing the risk of inbreeding and loss of genetic diversity (Vermont Fish and Wildlife Department, 2015). Assisted migration could provide genetic rescue for these populations. However, the data on long-tailed shrew populations are limited, and as of 2015, there were only 32 occurrences recorded in the state. For assisted migration to be a feasible management strategy for this shrew species, more research is needed.
5.3.1 Changes in latitudinal distribution
Warmer temperatures and changing climates will impact food availability and reproductive viability for Vermont’s native species, potentially forcing them to relocate to more suitable areas (Audubon, 2026b). For northern cold-adapted species with a southern range boundary in Vermont, warming temperatures and decreasing habitat suitability could cause local or even statewide extirpation, as species ranges follow their climatic niches and shift or contract northwards. These wildlife species include moose (Alces alces), Canada lynx (Lynx canadensis), spruce grouse (Canachites canadensis), American marten (Martes americana), and black-backed woodpecker (Picoides arcticus; Buck, 2021; Vermont Fish and Wildlife Department, 2015).
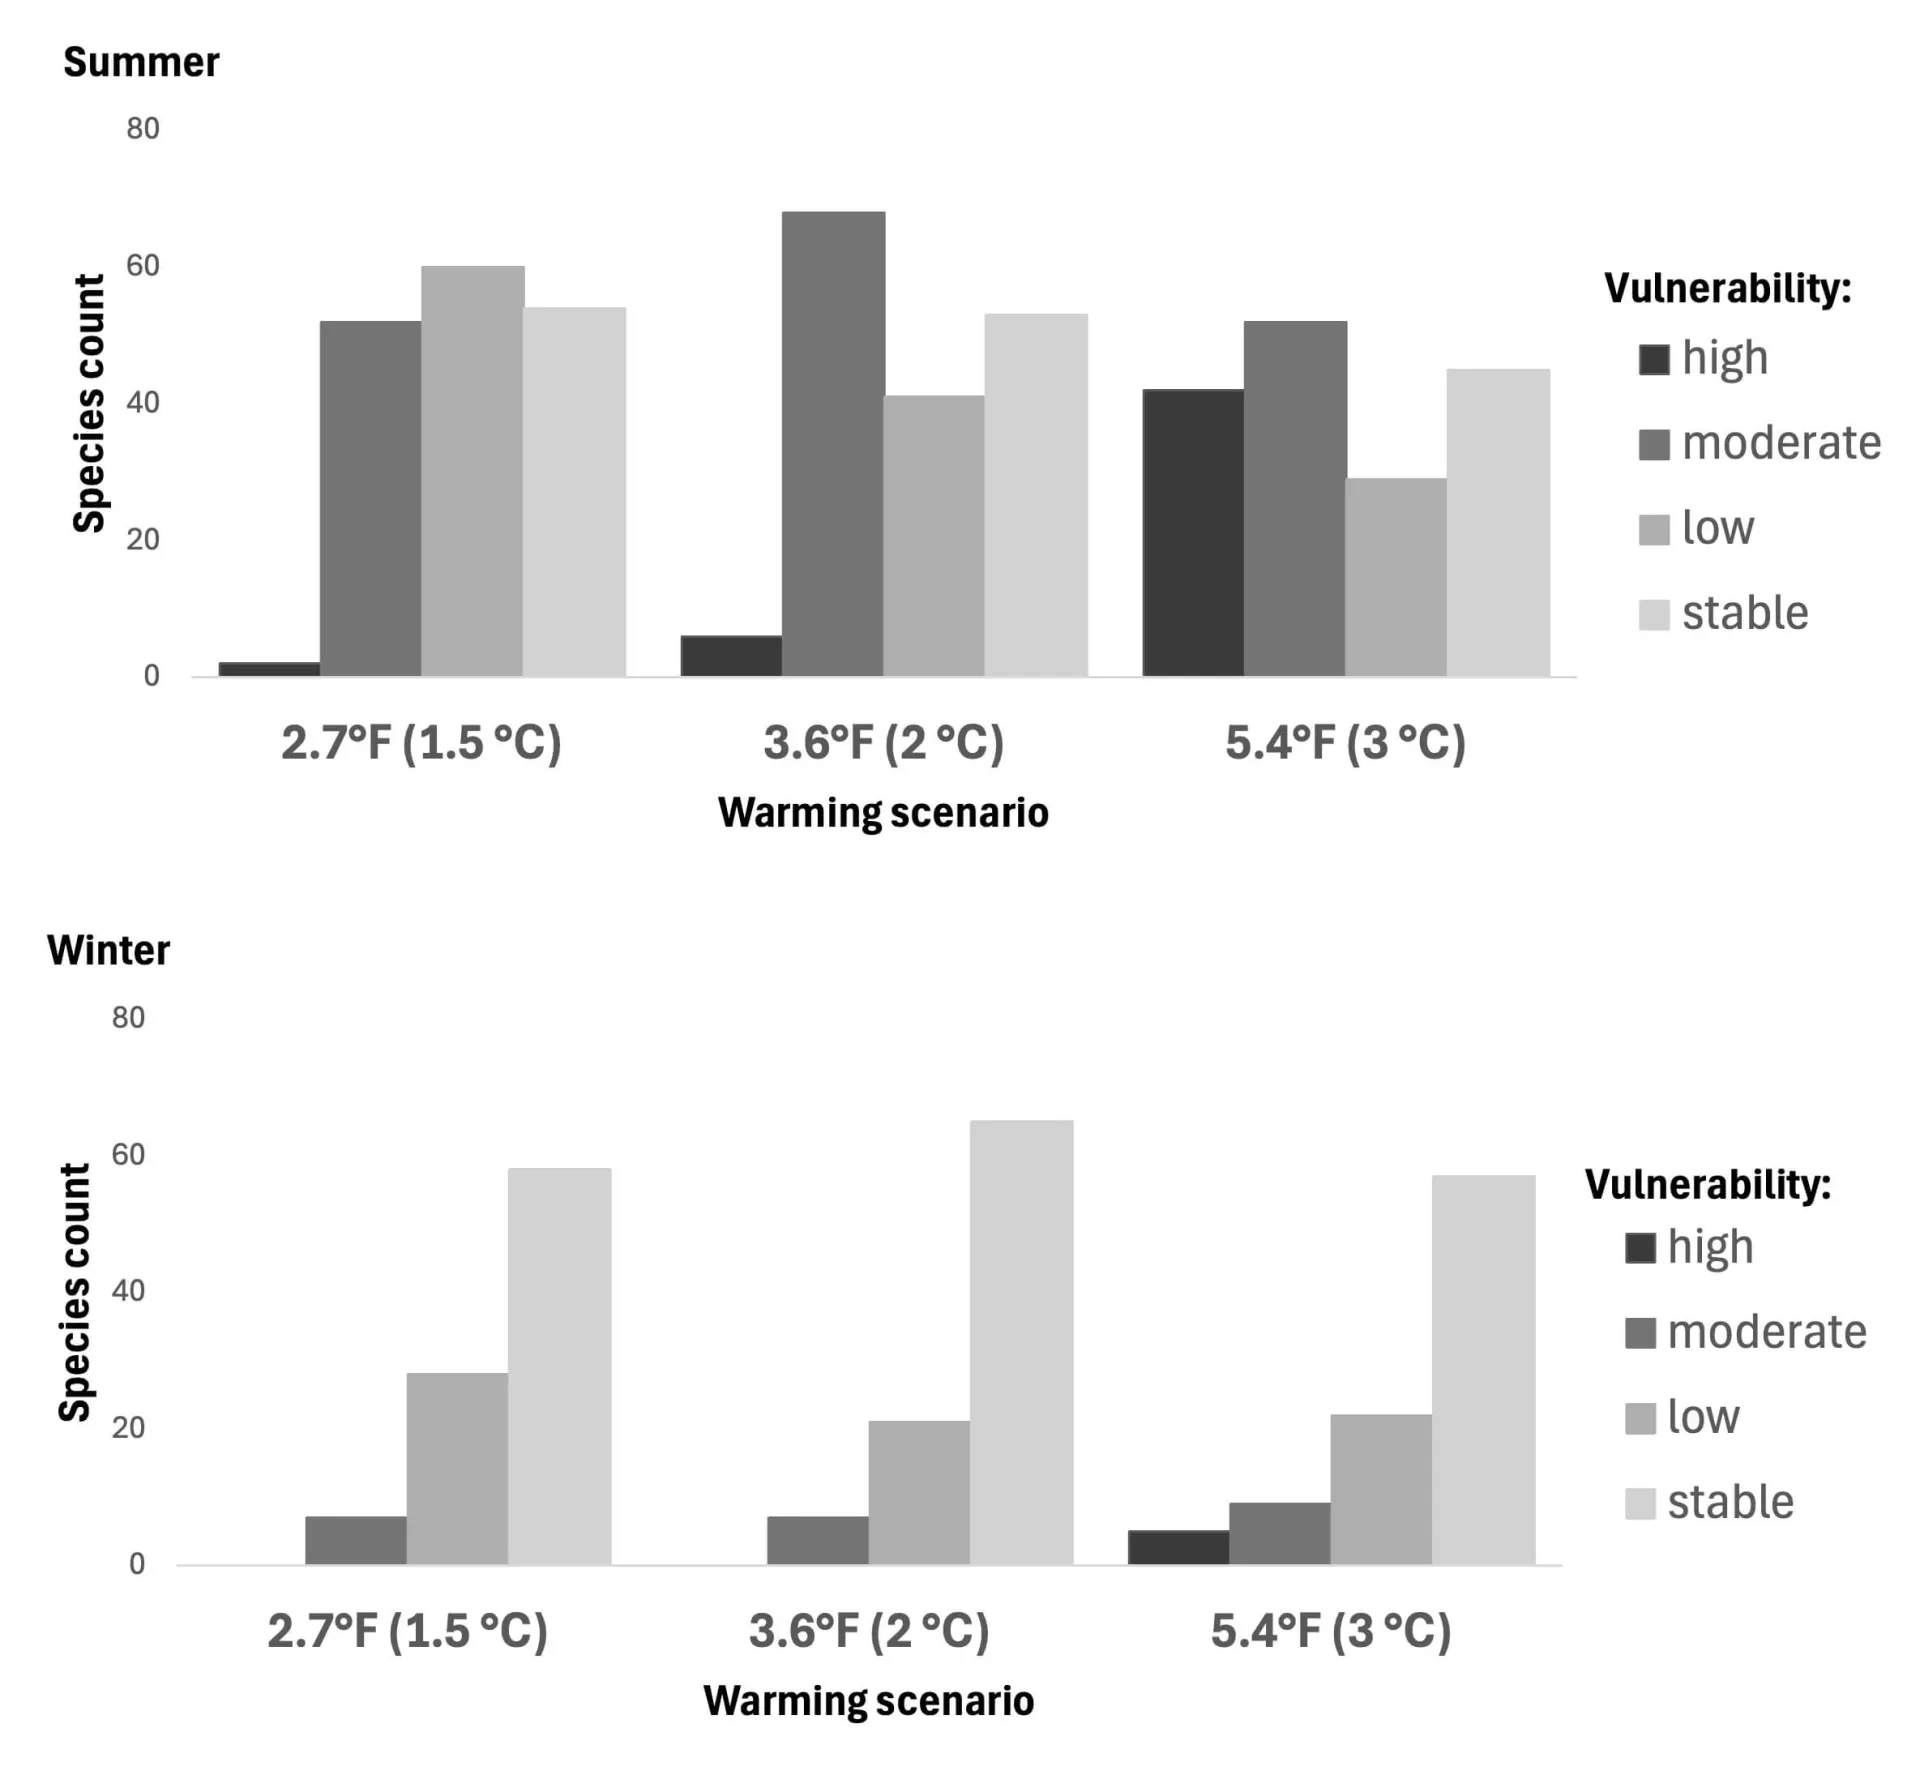
Loss of habitat is also a major driver of species extirpations, which climate change can accelerate or compound upon (Mantyka-Pringle et al., 2015). The Canada Lynx is considered extirpated in New York and was last reported in Vermont in 2024 (New York State Department of Environmental Conservation, 2026; Vermont Fish and Wildlife Department, 2024b). Lynx require large, connected swaths of forests, deep snow, and robust snowshoe hare populations (their preferred prey; U.S. Fish and Wildlife Service, 2026a). These conditions are shrinking in Vermont (see 5.7.2; Forests 3.3, Climate Change in Vermont 2.5.3) with climate change and habitat alteration, increasing the likelihood of Canada lynx extirpation in Vermont. Both the spruce grouse and black-backed woodpecker are predicted to be extirpated in Vermont with just 2.7°F (1.5°C) of summer warming (Figure 5‑1), with more range gained in Alaska and Canada’s northern territories (Audubon, 2026a, 2026c). Like other animals at the southern extent of their range, American martens in Vermont are facing loss of suitable habitat. Loss of suitable habitat can also lead to population fragmentation and reduced population connectivity, which further harms populations (Aylward et al., 2020; Carroll, 2007; Wasserman et al., 2013).
Species movement out of the state’s ecosystems can have cascading effects, especially if the species is a top predator or keystone species (Mills et al., 1993). Moose are considered a keystone species because of the outsized effects they have on ecosystems. Additionally, in Vermont, moose are an important game mammal and hold cultural significance (Timmermann & Rodgers, 2005). Moose populations are predicted to decrease in the state as the climate warms (Rodenhouse et al., 2009).
Highly mobile species like birds are expanding into Vermont or staying the full year when they have historically been seasonal visitors. For example, eastern bluebirds (Sialia sialis) are normally only in Vermont for their breeding season, but in recent years they have been recorded year round in northern New England (Cornell Lab of Ornithology, 2026; McGuire, 2025). Red-bellied woodpeckers (Melanerpes carolinus) have also become more commonly observed in Vermont, evidence that their range is moving northward (Emmons, 2020; Renfrew, 2013).
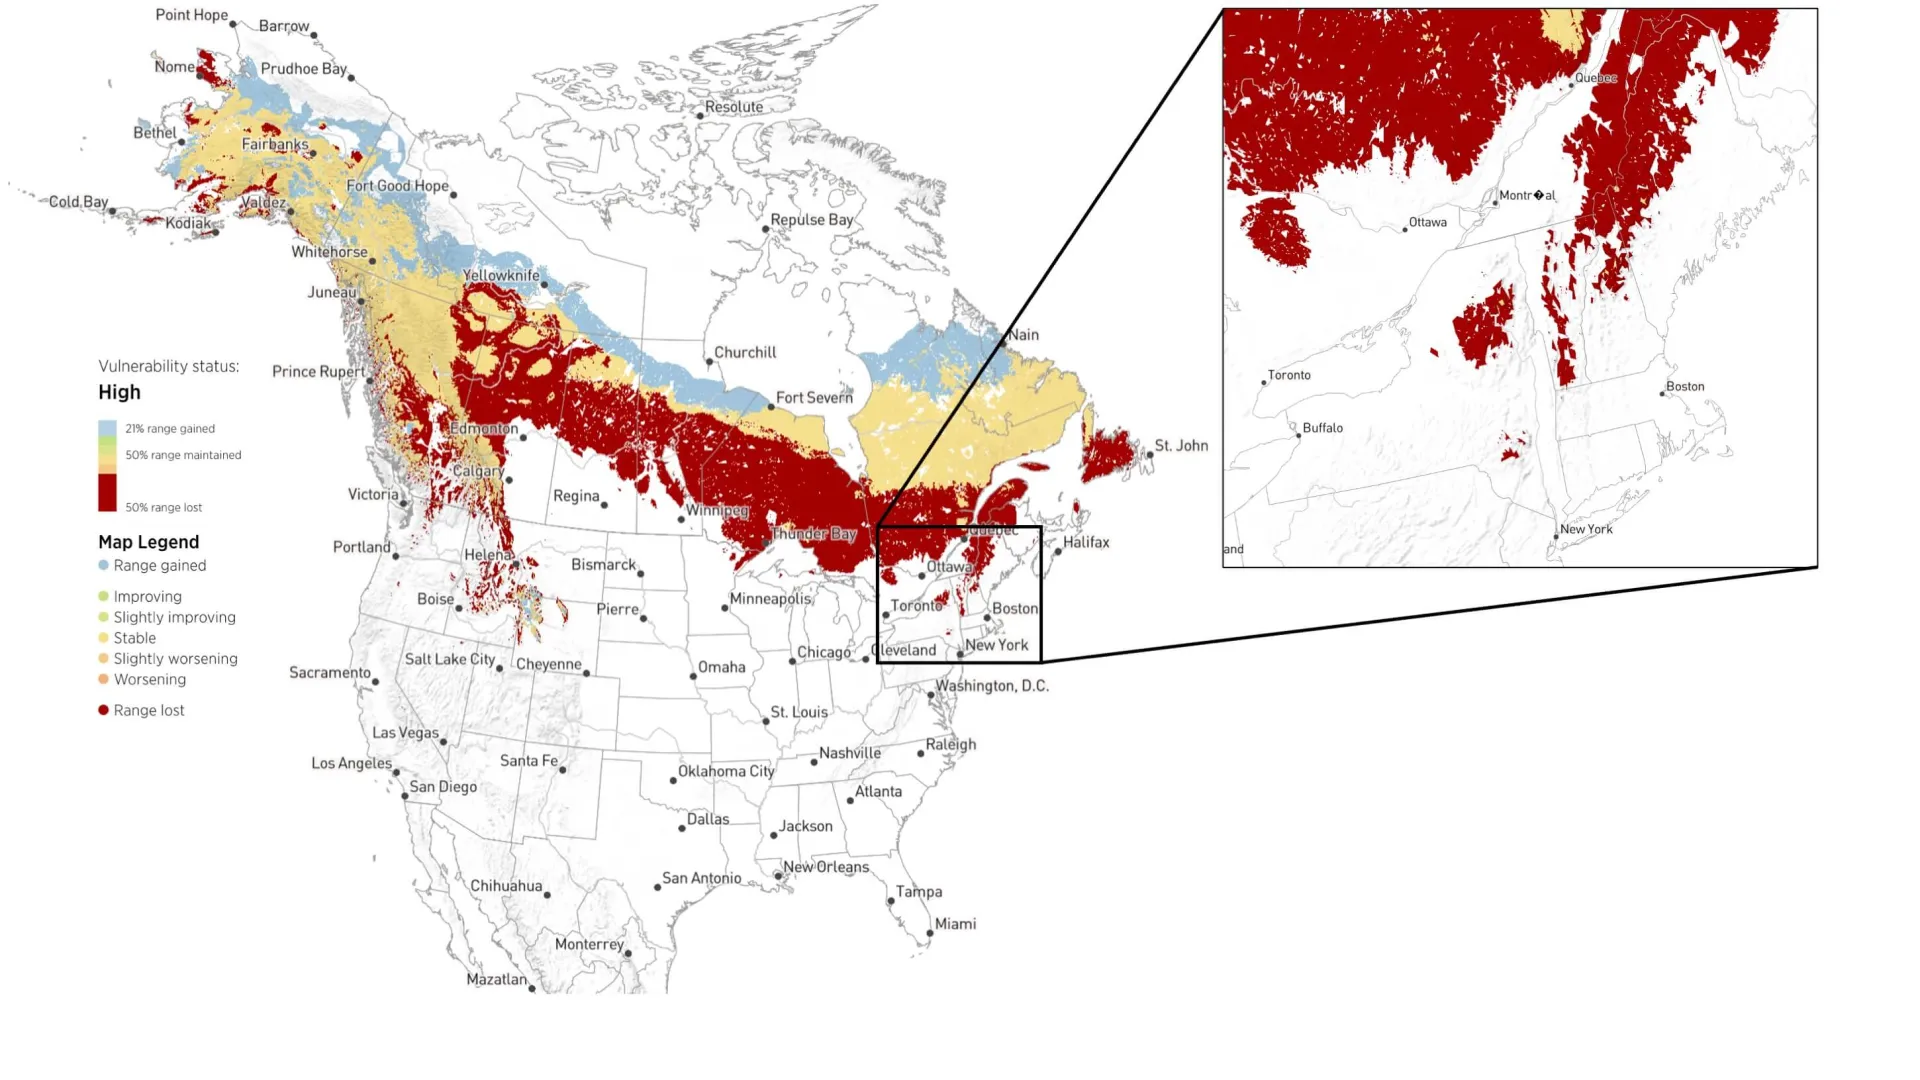
Source: Audubon (2026c)
5.3.2 Changes in elevational distribution
Warming temperatures associated with climate change could push wildlife upslope to areas that increasingly better suit their climatic niche. However, upslope movement for adaptation is not possible for all taxa or organizational groups. Other environmental variables, in addition to temperature, will also change at high elevations. For instance, wind frequency and force, as well as oxygen saturation, are more variable at higher elevations. These characteristics may render this new habitat unsuitable for some bird and insect species that depend on flight as their main method of movement (Moore et al., 2023).
Although the climate conditions upslope can match a species’ niche requirements, habitat also needs to be available. The rate at which a habitat type changes may be different than the climate conditions. This could lead to no observed movement, or even downslope movement, as the species follows available habitat. One study found that due to reforestation efforts, American red squirrels (Tamiasciurus hudsonicus) in the Northeast U.S. moved downslope with the return of their native spruce-fir habitat (Morelli et al., 2025). Even so, as the climate warms, these forests are expected to once again be pushed upslope, and the species dependent on them for survival are likely to follow (Wason & Dovciak, 2017). This exemplifies the need for multi-pronged adaptation and mitigation efforts, as ecosystems are highly complex, and the species within a given ecosystem are highly interdependent.
How a species moves or does not move upslope is further dependent on life history and niche availability. Species that have historically occupied lower elevation areas are more likely to shift upslope in response to climate change than their mid- or high-elevation counterparts (DeLuca & King, 2017; Mamantov et al., 2021). In a recent study on montane bird populations in New Hampshire, nine of 16 low-elevation (<750m) species had evidence of upslope movement between 1993 and 2009 surveys, and five species had significant upslope movement (Table 5-1). In comparison, nine of 11 high-elevation species showed some downslope movement (mean of -19m; DeLuca & King, 2017). Upslope movement can also differ across taxonomic groups. A study conducted across the European Alps, which encompass temperate forests analogous to Vermont, examined the rate of upslope movement in terrestrial insects, ungulates, frogs, and reptiles, all of which demonstrated some upslope movement, though at different rates (Vitasse et al., 2021). Terrestrial insects moved their optimal elevation +36.2 m/decade, and ungulates moved their optimal elevation +37.5 m/decade. In comparison, frogs and reptiles moved their optimal range only +13.9 m/decade and +22.6 m/decade, respectively (Vitasse et al., 2021). While the optimal thermal range for a species may be higher in elevation, its actual range response will also be dependent on available habitat and dispersal ability.
Species | Mean elevation change (m) |
|---|---|
Hermit thrush (Catharus guttatus) | +62.60 |
Black-and-white warbler (Mnioilta varia) | +184.48 |
Black-throated blue warbler (Setophaga caerulescens) | +77.65 |
Blackburnian warbler (Setophaga fusca) | +170.58 |
American redstart (Setophaga ruticilla) | +130.59 |
Source: DeLuca & King (2017)
5.3.3 Changes in connectivity
The movement of animals within and between populations is determined by environmental conditions and landscape connectivity. Climate change combined with anthropogenic activities such as infrastructure development, agriculture, or recreation can lead to lower landscape connectivity and increased habitat fragmentation, reducing species’ movement across space. Reduced population movement can cause resource depletion from increased concentrations of individuals or declines in genetic diversity due to inbreeding. Such stressors diminish a population’s ability to respond to changing climate conditions, leading to potential population declines (Frankham, 2005). The Vermont Conservation Design Plan identifies areas of the state prioritizing conservation activities, including landscape connectivity and wildlife migration pathways, for optimal ecological function (Vermont Fish and Wildlife Department, 2026k).
Changes in temperature and precipitation can also affect habitat suitability for migrating species. Climate change is predicted to more strongly impact temperatures at higher latitudes and will result in more of Vermont becoming uninhabitable for migratory species (see Climate Change in Vermont 2.4.2). As an example, Bicknell’s thrush (Catharus bicknelli) migrate from the tropics to the northeastern United States and Canada for breeding and are typically found at above 2,600 ft (792.5 m; Hill & Williams, 2024). Their breeding habitat consists of high-elevation spruce and balsam fir (National Park Service, 2018), tree species with ranges heavily influenced by climate, namely temperature (Rodenhouse et al., 2008). As temperatures rise, spruce and fir move higher in elevation toward cooler temperatures; hardwood species do the same and end up competing with spruce and balsams (see Forests 3.5.2). Spruce-fir forests in the northeast U.S. provide over 90% of Bicknell’s thrush breeding habitat. Currently, increased habitat fragmentation and diminishing viable range has resulted in a decline in the Bicknell’s thrush population in Vermont of 17.69% from 2010–2024 (Hill & Williams, 2024).
Habitat fragmentation can lead to concentrations of species in an area too small to adequately support them, straining resources and increasing the risk of disease (McCallum & Dobson, 2002). Without movement between populations, genetic diversity decreases, and inbreeding can diminish a population’s ability to respond to changing conditions, leading to population decline (Frankham, 2005).
5.4 Changes in terrestrial species biodiversity
The varied landscape of Vermont is home to many unique ecosystems and animal habitats. Throughout the state, almost every square kilometer has over 500 different species present (Figure 5-2; Table 5-2). The Champlain Valley and Northern and Southern Piedmont regions have particularly high species richness, with over 3,000 species/km2 estimated in some areas. The Champlain Valley has the highest estimated number of bird, insect, and plant species, while the Northeastern Highlands (i.e., the Northeast Kingdom) has the highest estimated number of amphibian, spider, and fungi species (Table 5-2). While annual average temperature and precipitation are increasing across the state, the magnitude of change differs across climate divisions (see Climate Change in Vermont 2.4.2 and 2.5.2 for statewide trends; 2.10.2 and 2.10.6 for division trends), highlighting the unique vulnerabilities fish and wildlife experience due to climate change.
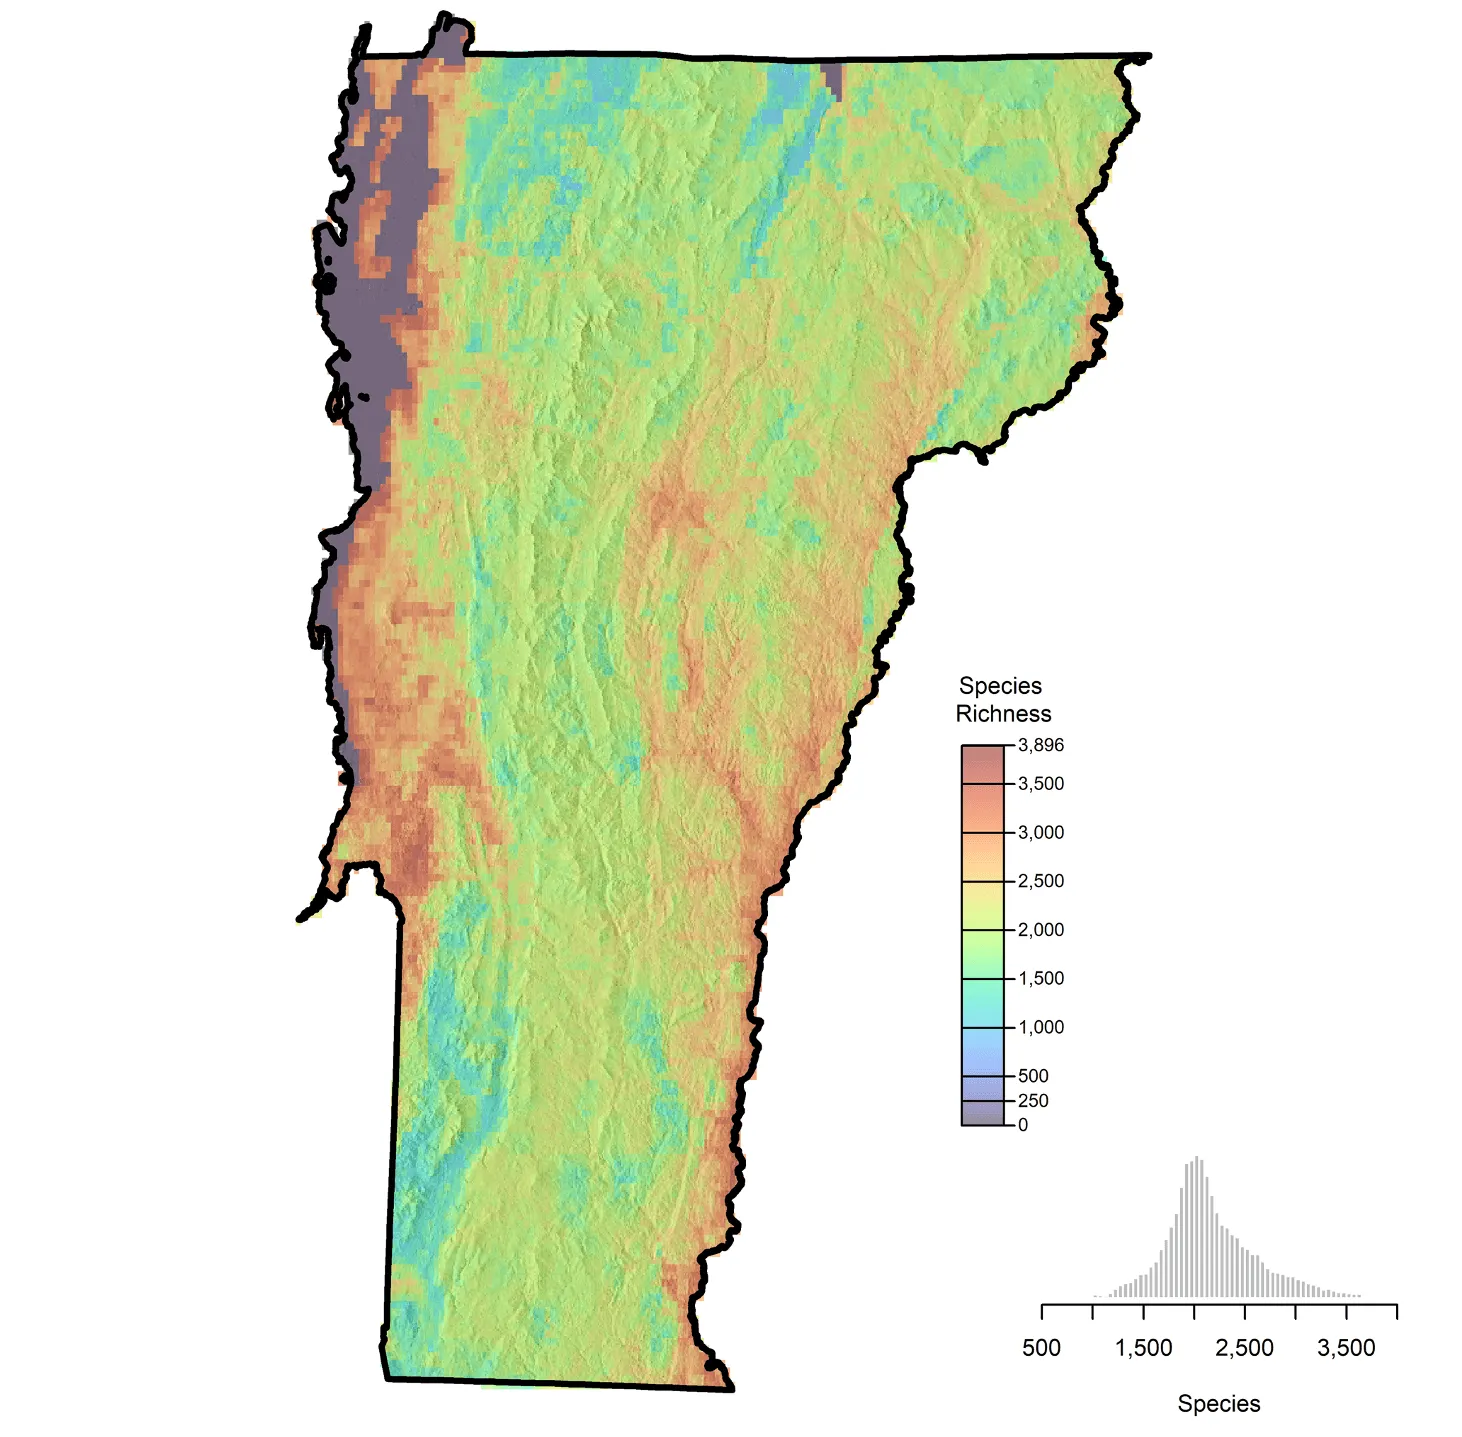
Source: Hallworth et al. (2023)
| Taxonomic Group | Northeastern Highlands | Taconic Mountains | Northern Green Mountains | Champlain Valley | VT Valley | Champlain Hills | Northern VT Piedmont | Southern VT Piedmont | Southern Green Mountains |
|---|---|---|---|---|---|---|---|---|---|
| Amphibians | 29 | 21 | 18 | 19 | 22 | 21 | 17 | 16 | 19 |
| Reptiles | 5 | 31 | 16 | 19 | 23 | 25 | 9 | 12 | 22 |
| Birds | 138 | 161 | 145 | 223 | 151 | 151 | 161 | 188 | 140 |
| Mammals | 46 | 53 | 47 | 36 | 59 | 50 | 34 | 43 | 61 |
| Insects | 332 | 281 | 481 | 581 | 358 | 390 | 514 | 531 | 306 |
| Spiders & allies | 272 | 198 | 124 | 124 | 196 | 122 | 96 | 112 | 127 |
| Mollusks | 242 | 261 | 224 | 216 | 349 | 148 | 112 | 177 | 276 |
| Plants | 428 | 487 | 448 | 661 | 459 | 414 | 449 | 505 | 450 |
| Fungi | 462 | 379 | 393 | 381 | 412 | 373 | 310 | 454 | 430 |
Source: Hallworth et al. (2023)
Environmental stressors can be direct or indirect results of climate change and can cause cascading effects related to shifting ecosystem dynamics, species population numbers, and spatial distribution. Abiotic (physical) stressors include drought, flooding, high temperatures, habitat degradation, and habitat loss. Biotic stressors include invasive species, changes in available food sources, and disease. Both abiotic and biotic stressors contribute to potential decline in Vermont fish and wildlife populations. Such stressors coupled with loss of habitat and introduced species alter ecosystem dynamics within communities and increase competition (Rodenhouse et al., 2009).
5.4.1 Direct and indirect effects
Of Vermont’s more than 23,000 species, 96 are of global conservation concern according to the International Union for Conservation of Nature (IUCN) and seven are federally endangered (Hallworth et al., 2023). The seven federally endangered species are shortnose sturgeon (Acipenser brevirostrum), northern long-eared bat (Myotis septentrionalis), Indiana bat (Myotis sodalis), tricolored bat (Perimyotis subflavus), gray wolf (Canis lupus), rusty-patched bumble bee (Bombus affinis), and dwarf wedgemussel (Alasmidonta heterodon) (Vermont Fish and Wildlife Department, 2023, 2025e). Both temperature and precipitation increases play a role in species vulnerability to climate change (Table 5-3).
Species | Climate-associated threats |
|---|---|
Shortnose sturgeon | Increasing temperatures, habitat degradation, streamflow alteration (NOAA Fisheries, 2025) |
Northern long-eared bat | White-nose syndrome, habitat loss and fragmentation, increasing temperatures (U.S. Fish and Wildlife Service, 2026c) |
Indiana bat | White-nose syndrome, habitat loss (U.S. Fish and Wildlife Service, 2026b) |
Tricolored bat | White-nose syndrome, habitat loss (U.S. Fish and Wildlife Service Core Team, 2021) |
Gray wolf | Habitat degradation (Van Den Bosch et al., 2023) |
Rusty-patched bumble bee | Habitat loss, disease, increasing temperatures (Hatfield et al., 2015) |
Dwarf wedgemussel | Increasing temperatures, nutrient enrichment, sedimentation, road salt, streamflow alteration (U.S. Fish and Wildlife Service, 2019) |
Source: Adapted from Vermont Fish and Wildlife Department (2026a)
Since 2005, the number of Vermont Species of Greatest Conservation Need (SGCN) has increased from 33 to 39 for fish and 192 to 261 for invertebrates (2005 Vermont Wildlife Action Plan, 2005; Table 5-4). Although greater awareness and data collection correlate with this shift, the overall increase to more than 25% of species within some taxonomic groups being classified as SGCN exemplifies there are broader issues at play (Table 5-4). Over the last 20 years, Vermont’s annual temperature has risen by approximately 1.6°F (0.89°C), while annual precipitation has increased by approximately 6.4 in. (approx. 163 mm; Climate Change in Vermont 2.1 and 2.4.1). Simultaneously, the number of species considered “at-risk” has increased by 32.7% (853 to 1,132). To better guide management, the state of Vermont assigns animal species different levels of conservation concern. High-priority species are those experiencing negative population trends, are no longer established in Vermont, or face immediate threat to their survival (Vermont Fish and Wildlife Department, 2015). Low-priority populations face challenges like habitat loss or increased mortality, but they remain well-distributed across Vermont.
Taxon | 2005 SGCN | 2015 SGCN | 2025 SGCN | 2025 Watchlist | Change Notes 2015–2025 |
|---|---|---|---|---|---|
Amphibians & Reptiles | 19 | 19 | 17 | 0 | Added to SGCN: Mink Frog SGCN to Low Priority: Common Watersnake, Dekay’s Brownsnake, Blue-spotted Salamander |
Birds | 58 | 50 | 51 | 0 | Added to SGCN: Cliff Swallow, Barn Swallow, Bank Swallow, Boreal Chickadee, Yellow-bellied Flycatcher, White-throated Sparrow, Northern Saw-whet Owl High to Medium: Bald Eagle, Sedge Wren, Brown Thrasher, and Eastern Towhee Medium to High: Sora SGCN to Low Priority: Short-eared Owl, Red-shouldered Hawk, Great Blue Heron, Chestnut-sided & Bay-breasted Warblers |
Fishes | 33 | 29 | 39 | 0 | Added to SCGN: Allegheny Pearl Dace, Finescale Dace, Rainbow Smelt (native populations), Trout Perch, Slimy Sculpin, Rosyface Shiner, Longnose Sucker, Burbot, Muskellunge, Shortnose Sturgeon |
Invertebrates | 191 | 198 | 257 | 53 | Added to Watchlist: 53 species
|
Mammals | 33 | 33 | 24 | 3 | Medium to High: Snowshoe Hare SGCN to Watchlist: New England Cottontail, Mountain Lion, Wolf SGCN to Low Priority: Big Brown Bat, Bobcat, North American River Otter |
Source: Vermont Fish and Wildlife Department (2026a)
Between the 2015 Vermont Wildlife Action Plan and the 2025 draft SGCN list, nine more species moved from high to medium priority than moved from medium to high priority, which indicates that management and conservation efforts may be working. However, five species have been moved from low to medium or high priority, and 376 species have been added as an SGCN (Vermont Fish and Wildlife Department, 2015, 2026a). New SGCN additions can reflect emerging threats wildlife species face, including climate change and loss of suitable habitat.
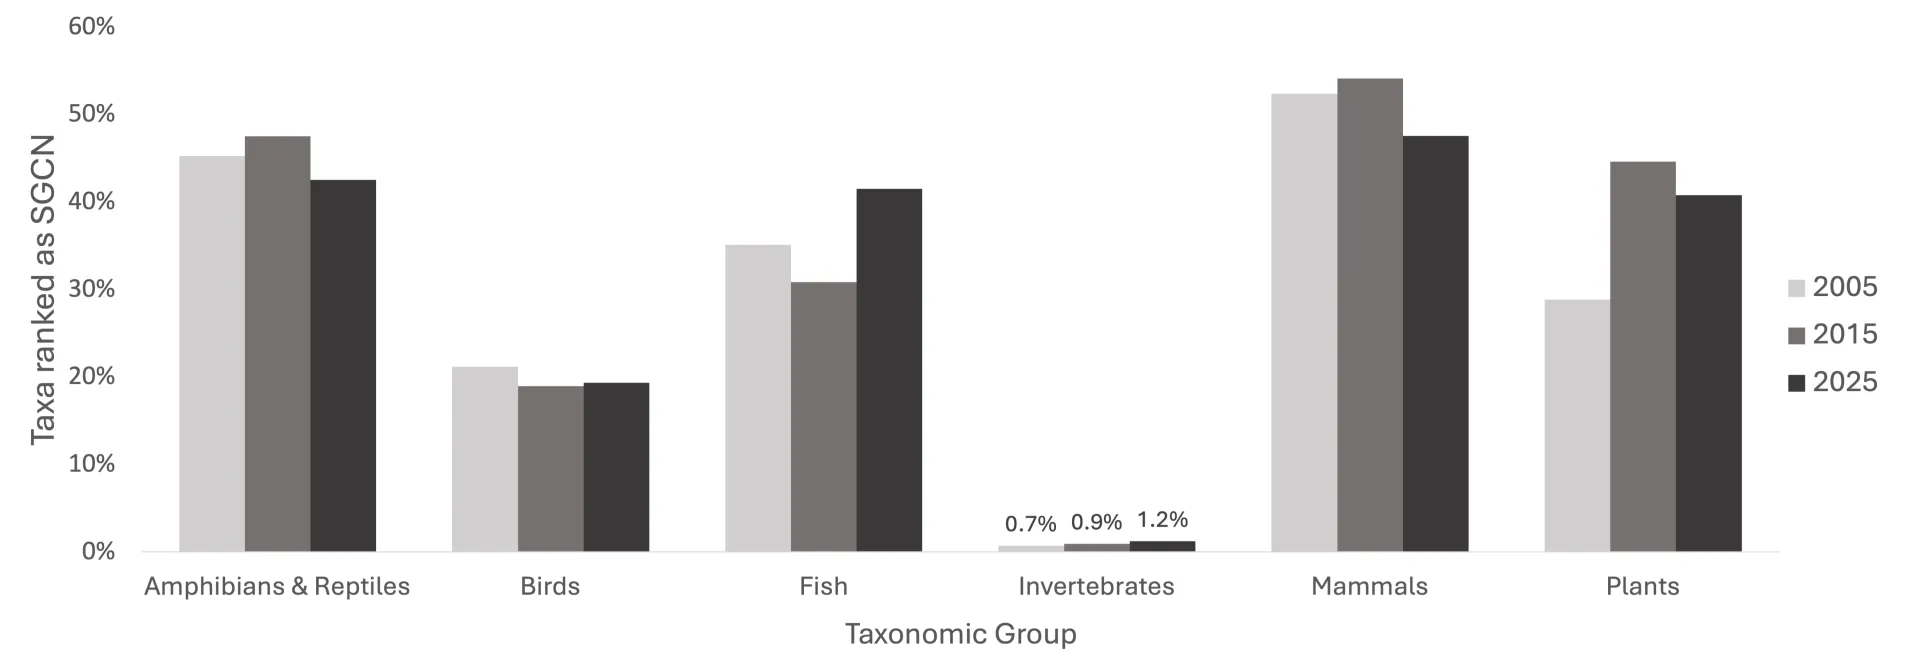
Source: Vermont Fish and Wildlife Department (2005, 2015, 2026a)
The role of climate change as a threat to population persistence and a factor in SGCN status varies across taxa. Of the 34 mammal SGCN from the 2015 Wildlife Action Plan, climate change was identified as a direct concern for the conservation status of 11 species. Climate change was also a direct concern for nine reptile and amphibian species, 10 bird species, seven fish species, and 10 invertebrate taxonomic groups (Vermont Fish and Wildlife Department, 2015).
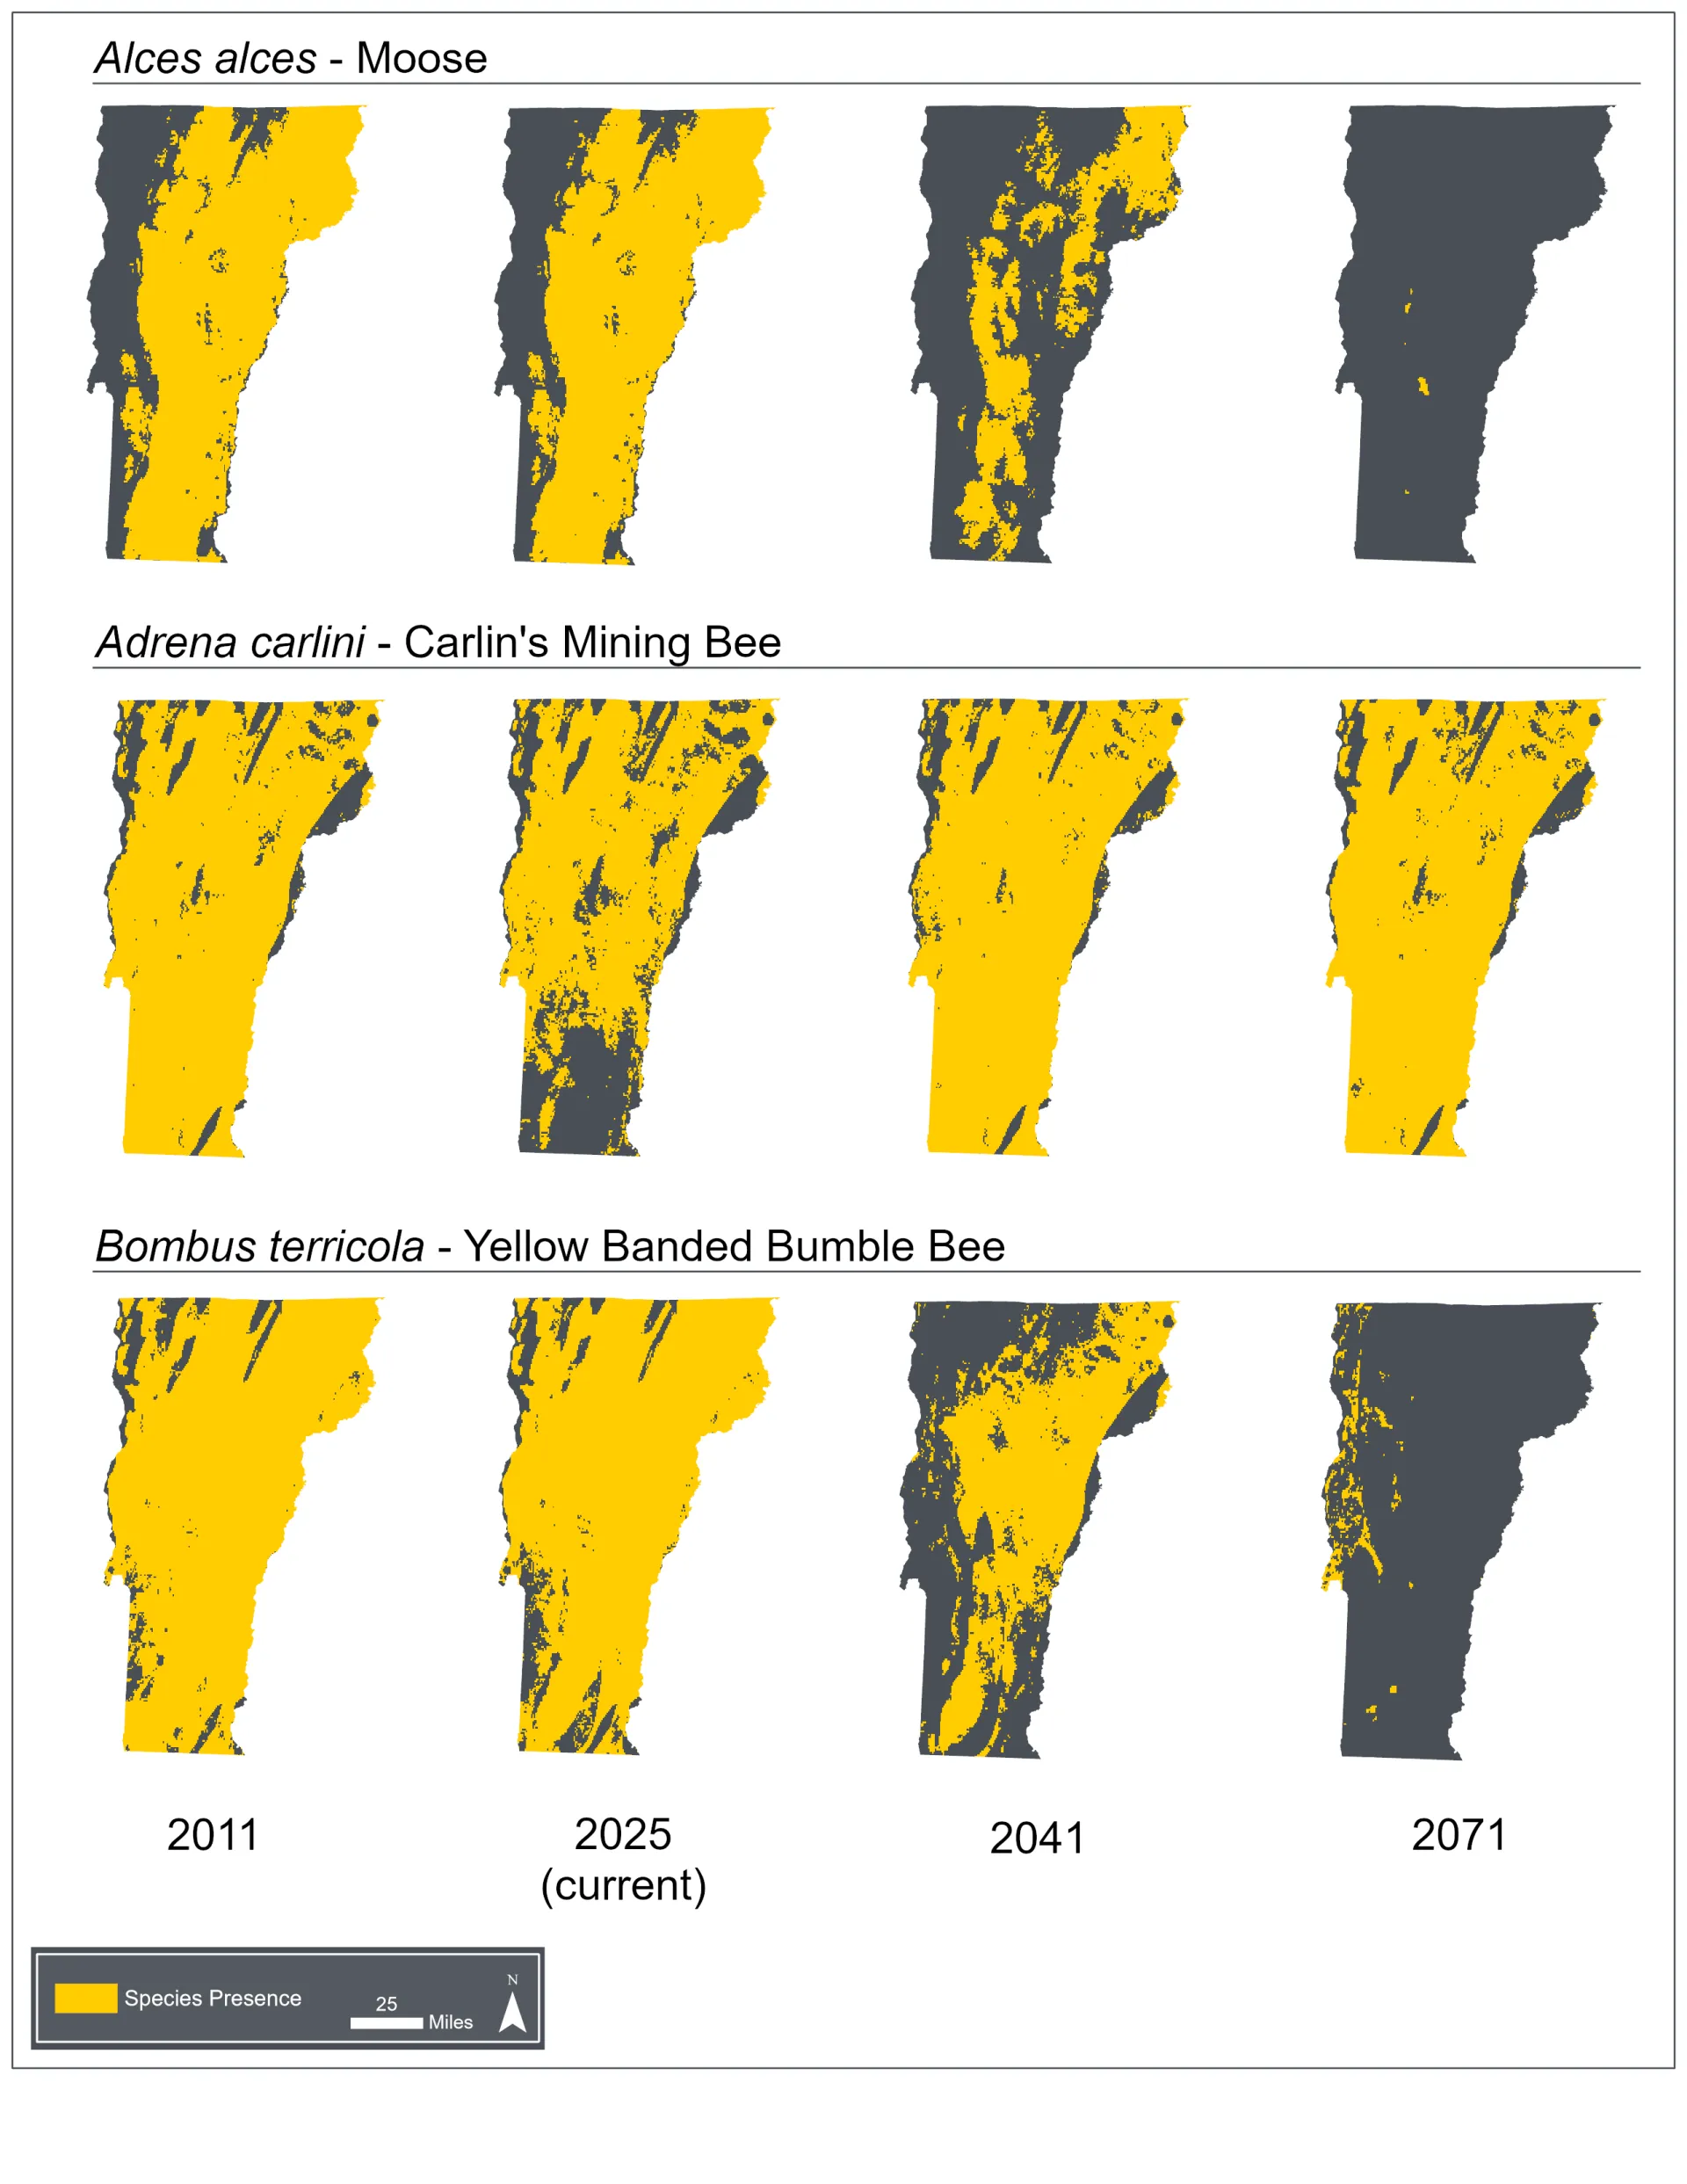
The number of at-risk species is predicted to increase under continuing climate change. Since 1900, average summer temperatures in Vermont have increased a total of 2.7ºF (1.5ºC; See Climate Change in Vermont 2.4.4). Audubon data predicts that this increase in summer temperatures will result in more than 40 Vermont bird species will be vulnerable to population declines (Figure 5‑4). Estimates from the Vermont Center for Ecostudies (Hallworth et al., 2023) predict that by 2100, Vermont will have lost 386 species—or about 6% of all species—under the carbon emission scenario known as representative concentration pathway (RCP) 8.5 (high emission scenario, or “business as usual”). Even under lower emission scenarios like RCP 4.5, the average global temperature is estimated to increase by 4.32°F (2.4°C) by 2100 (Environmental Protection Agency, 2025). Of three representative species—moose, Carlin’s mining bee, and yellow-banded bumble bee—both the moose and bumble bee are predicted to lose most of their suitable habitat in Vermont under the middle future climate scenario RCP 7.0 (Figure 5‑5).
Source: Audubon (2026b)
Source: Vermont Center for Ecostudies (2023)
Note: Data visualization by Hannah C. Turner
Vertebrates
Many vertebrates are at risk with current and future climate change impacts and projections. With 2.7°F (1.5°C) of summer warming, there are two highly vulnerable bird species, spruce grouse (Canachites canadensis) and black-throated green warbler (Setophaga virens), but with 5.4°F (3°C) of warming, there will be 32 highly vulnerable bird species, especially among boreal forest birds (Figure 5‑4). For example, like many of the 32 species, the black-throated blue warbler’s (Setophaga caerulescens) breeding habitat is threatened by warming temperatures, and the loss of suitable breeding habitat will result in population decline (Audubon, 2026b).
Common loons (Gavia immer)—an iconic Vermont species—are considered ecosystem sentinels, and are particularly significant for mercury monitoring (Loon Preservation Committee, 2026). Loons are a medium-priority SGCN in Vermont (Vermont Fish and Wildlife Department, 2025c). Vermont’s loon population is currently stable and at an all-time high, but increased air temperatures, diminishing water quality, high-frequency flooding, and more favorable conditions for mercury bioaccumulation pose threats to their welfare (Wagner, 2025). Loons are sensitive to changes in water quality, which can occur due to excess nutrients, eutrophication, increased precipitation, and acidification. Loons prefer lakes with good water quality for breeding, so decreasing water quality of lakes may restrict loon breeding sites. Mercury is a factor in reduced loon reproductive success (Evers et al., 2008). Mercury has a low-level risk for loons in Vermont (Vermont Center for Ecostudies, 2025), but conditions in certain environments are increasingly favoring the conversion of methylmercury (MeHg), bioaccumulation of which is highly toxic to wildlife, including loons (see 5.5.1). Floods also pose risks, as they threaten loon nests by washing them out from shore thereby resulting in fewer young loon hatchlings. Increased presence of mosquitoes and other vector-carrying organisms, which thrive in warmer and wetter conditions, increase the likelihood of loons contracting avian diseases. Milder springs are further lengthening the window in which these disease vector-carrying insects are active. Finally, environmental conditions may result in increased black fly swarms, which may cause loons to abandon their nests, negatively impacting loons’ reproductive success.
Like other hibernating mammals, bats are very sensitive to changes in temperature during their winter hibernation period. Vermont has three migratory bat species which leave the state during the winter, and six resident species that stay year-round and hibernate in caves (Vermont Center for Ecostudies, 2022). Studies show that bats who experience larger changes in temperature during winter have reduced survivability of white-nose syndrome (WNS) and increased mortality (see 5.7.3). While bats overwinter in deep underground caves that are less sensitive to temperature changes, substantial increases in winter temperatures may impact hibernation, food availability, and reproductive timing (Krivek et al., 2025). Phenological changes vary across bat species, and some species hibernate for different lengths of time across different time periods (Krivek et al., 2025). Milder springs may trigger an early exit from hibernation (Krivek et al., 2025). The more that bats are disturbed during hibernation, the more energy they expend, depleting their fat storage and reducing survivability.
Different species experience warming temperatures differently due to their physiology. While endotherms, like mammals and birds, can self-regulate their body heat, ectotherms, like amphibians and reptiles, are very sensitive to changes in external temperature and depend on external temperatures to regulate physiological processes (Olson & Saenz, 2013). Vermont is home to 40 amphibian and reptile species, 17 of which are SGCN (Vermont Fish and Wildlife Department, 2026a). Many amphibians lay eggs in vernal pools, which are at risk of drying out earlier in the spring because of warming temperatures (Montrone et al., 2019; Tolan, 2026). The common mudpuppy (Necturus maculosus), identified as a SGCN, spends its whole life underwater and is most active in winter when water temperatures are coldest (Phillips, 2023). Mudpuppies are sensitive to temperature changes and pollutants in the environment (Vinick, 2023), meaning warmer temperatures and loss or contamination of aquatic habitat will impact population sizes (Briggs, 2023).
Warmer temperatures pose a unique problem for the state’s turtles. For turtles, sex is determined by the temperature during egg incubation; warm temperatures skew towards female cohorts, and cool temperature skew towards male cohorts (Olson & Saenz, 2013). Higher annual average temperatures could contribute to uneven sex ratios in Vermont populations, potentially contributing to population declines (Janzen, 1994). Spotted turtles (Clemmys guttata) are endangered in Vermont due to loss of suitable habitat from climate change and human development (Vermont Fish and Wildlife Department, 2025f). Spotted turtles reside in a combination of wetlands, uplands, and aquatic habitats (Burgess, 2026). Thirty-five percent of Vermont’s historic wetlands have disappeared or are impaired, and less than 4% of Vermont land is currently classified as wetlands (Parren et al., 2019). Complex and synergistic impacts of climate change are likely to put turtle populations further at risk.
Pollinators
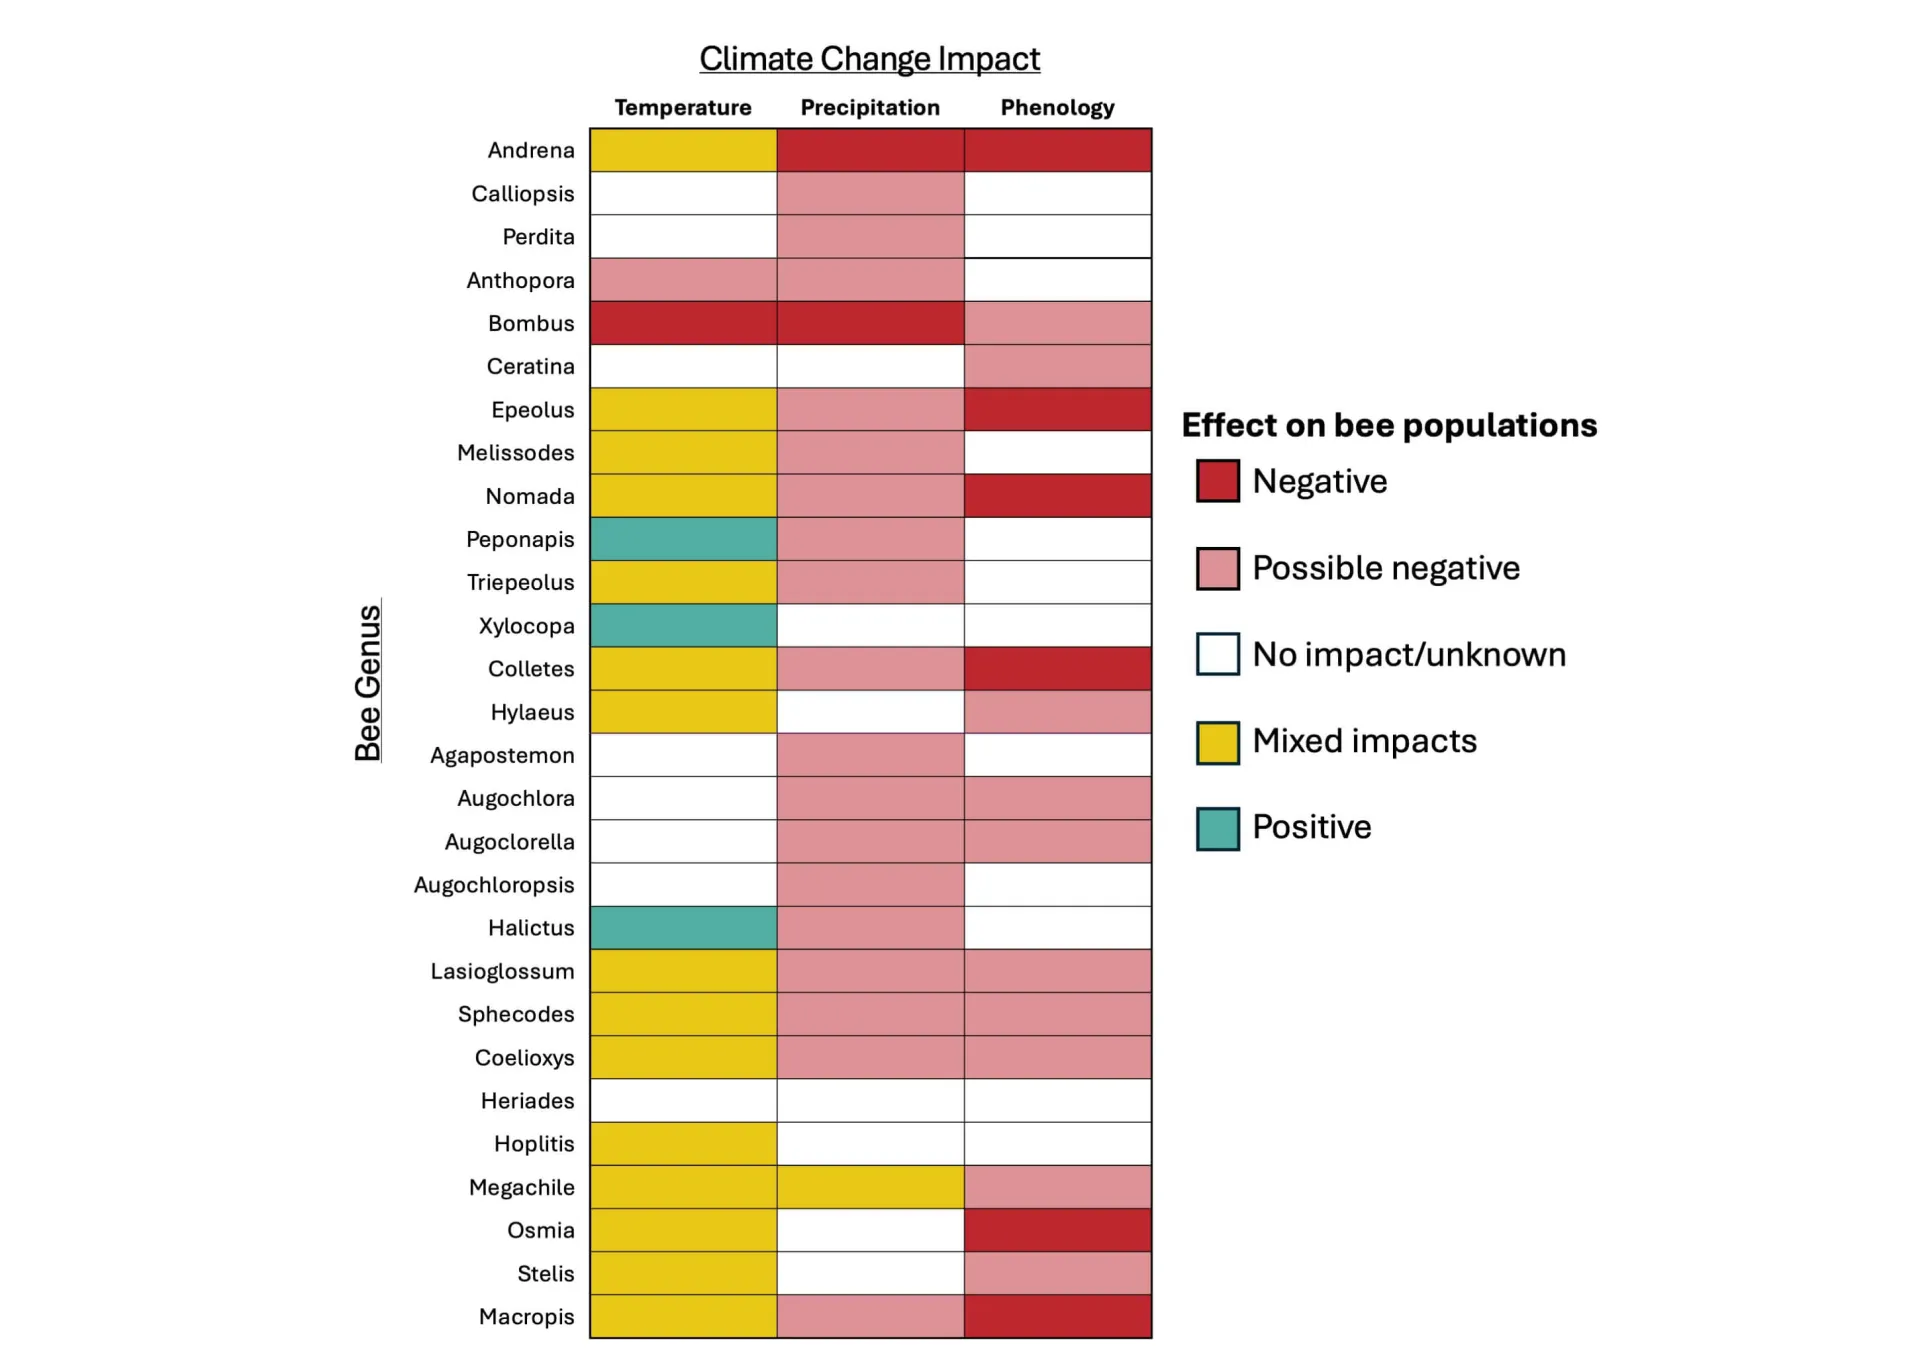
Pollinators play an important role in ecosystems and food production. However, increasing temperatures and changing precipitation due to climate change threaten many pollinator species (Figure 5-6). Of the 28 different bee genera found in Vermont, all are expected to experience some form of negative effect from climate change. Some pollinator species will benefit from longer growing seasons, but others may have increased overwintering mortality due to the metabolic costs of warmer winters. Extreme precipitation, milder winters, increasing summer temperatures and humidity are all affecting bee populations (Rajagopalan et al., 2024). Warmer hives more often experience excessive moisture, and pollen can be washed away by extreme precipitation. Milder temperatures at the beginning of spring lead bees to emerge early from the hive and freeze to death when cold temperatures return (Pirani, 2024). A study in Washington state found that bees that fly later in autumn and early winter have reduced colony sizes come spring. Bees that lived at higher elevations experienced minimal impacts on colony sizes and mortality rates (Rajagopalan et al., 2024). More research is needed to understand how warmer fall and winter temperatures affect bee colonies.
Source: Hardy et al. (2022)
Insect function is directly tied to temperature (Roitberg & Mangel, 2016), and many insect species have complex life cycles that are sensitive to temperature changes. Insects in developing stages may not be able to thermoregulate in the same capacity as adults and can thus experience higher rates of mortality when temperatures spike (Kingsolver et al., 2011). With overall temperatures and rates of extreme weather events increasing, insect populations may decrease during vulnerable life stages. Many insects already live close to their thermal limit, where even a few degrees increase in temperature could impact their survival (Roitberg & Mangel, 2016). However, species with short generation times may be able to adapt to quickly warming temperatures (Kellermann & van Heerwaarden, 2019).
Many insects overwinter in a form called diapause. During diapause, insects reduce metabolic activity to save energy (Harsimran et al., 2017). Higher temperatures during winter increase metabolism, making diapause more costly in terms of energy (Hahn & Denlinger, 2011). Snow cover can buffer insects diapausing underground from temperature extremes, but snowpack is also predicted to continue declining (see Climate Change in Vermont 2.5.3), making these species more vulnerable (Templer et al., 2012; Whitehorn et al., 2025). Alternatively, overwintering survival could increase with less extreme cold temperatures.
Longer growing seasons can also result in phenological mismatch between pollinators and other species (see 5.7.2). Phenological mismatch refers to when the historic timing of interactions between two species is altered, and the resource need of one species no longer aligns with the production and abundance of that resource.
Introduced pollinator species can also increase disease transmission across native bee species (Goulson et al., 2015). When a bee has a long evolutionary history with a pathogen, disease effects are often low, but when that pathogen jumps over to a native species, mortality can be a lot higher.
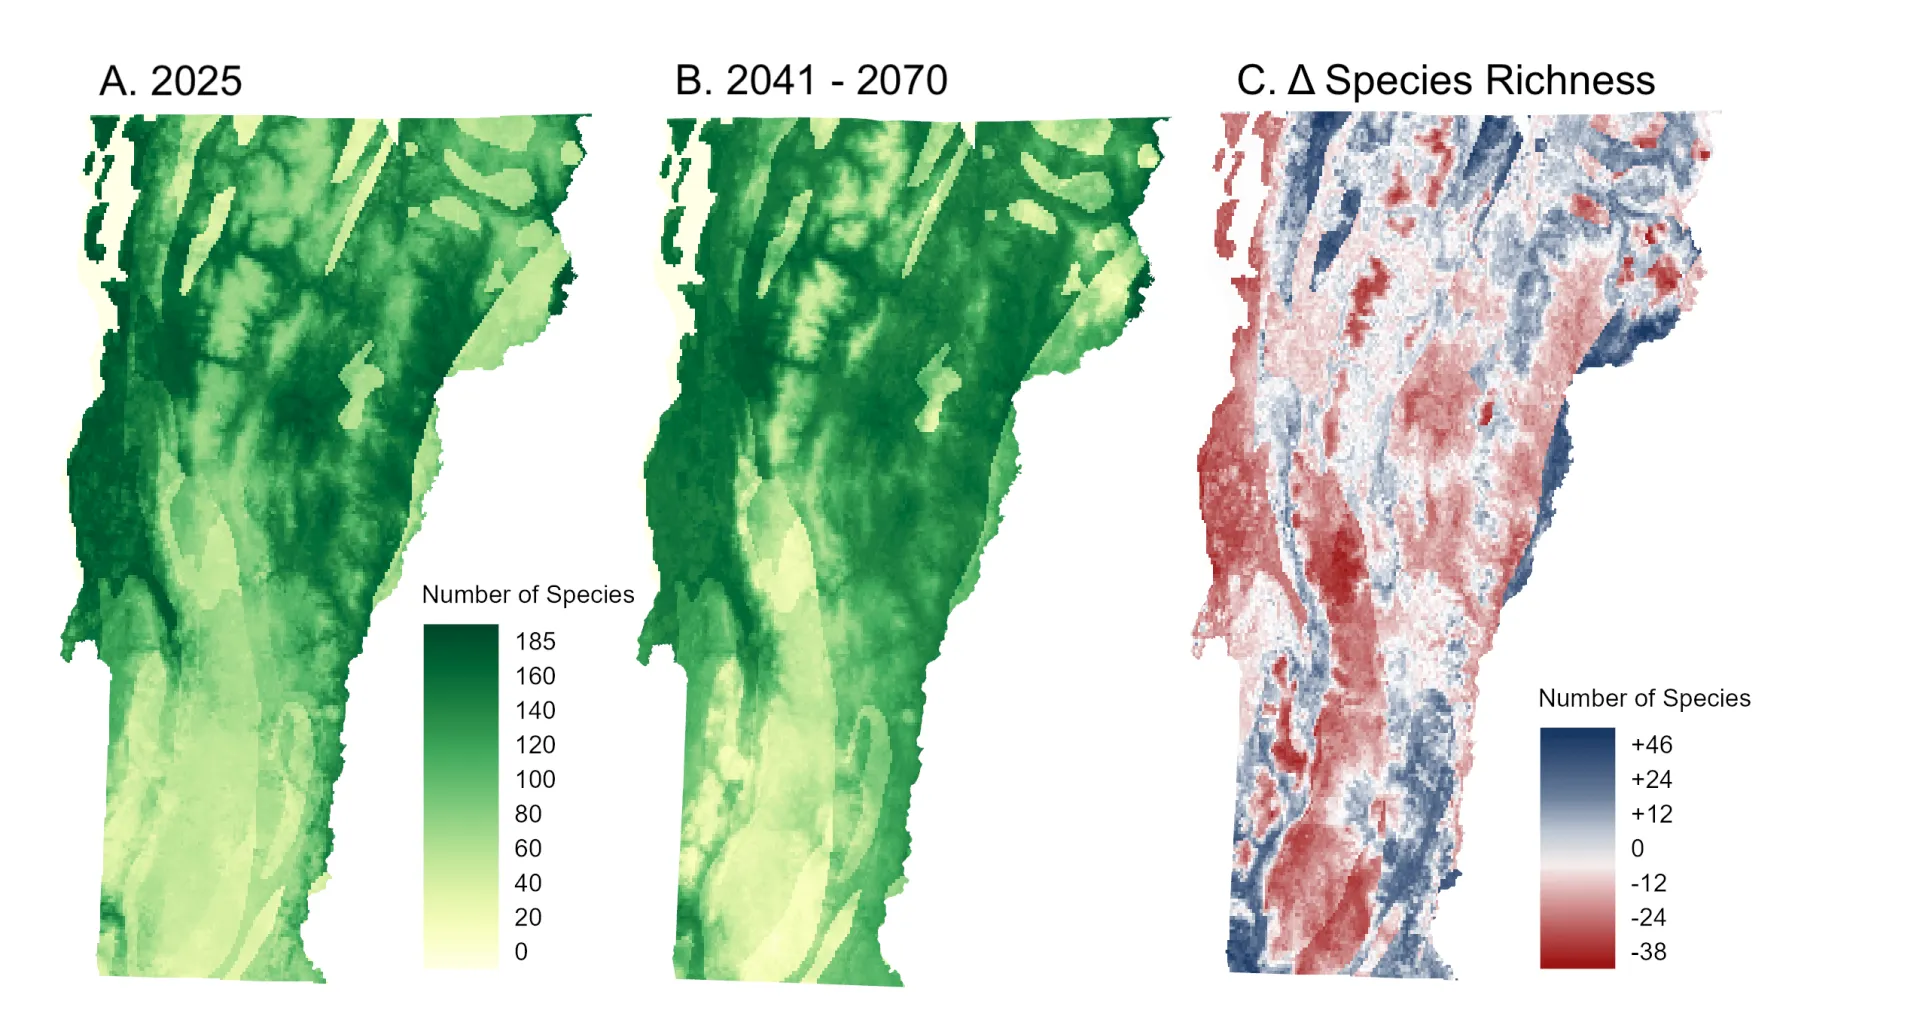
The Vermont Center for Ecostudies has identified 55 bee species that should be of conservation priority (Hallworth et al., 2023). Bee species richness in Vermont is predicted to decrease in the coming years, with the most biodiversity loss at higher elevations (Figure 5‑7). Three bumble bee species are extirpated in Vermont (Bombus affinis, B. ashtoni, B. fernaldae), and four more species have experienced population declines greater than 50% compared to pre-2000 population numbers (Richardson et al., 2019). Comparisons of modern monitoring data (2000–2014) to historic data (pre-2000) reveal that overall bumble bee diversity, distribution, and abundance have decreased. Bumble bee biodiversity is most associated with land use, elevation, and precipitation. Although several Bombus species are considered extirpated or have had significant declines, five other species in the Pyrobombus subgenus have significantly increased in abundance (Richardson et al., 2019).
Source: Hardy et al. (2022); Vermont Center for Ecostudies (2022)
Note: Data visualization by Hannah C. Turner
The first Vermont butterfly survey report was published in 2007. Climate vulnerability was assessed for 14 Vermont species: nine species were moderately to highly vulnerable, three were stable, and two were expected to increase (McFarland & Zahendra, 2013; Vermont Fish and Wildlife Department, 2015). Reports are on a 20-year basis, so the next is expected in 2027. See Box 5-2 for further discussion on climate change impacts on butterflies.
5.4.2 Introduced species, invasives, and pests
Warmer temperatures are likely to contribute to range expansions of historically southern species into Vermont. Additionally, climate change can increase survival rates for species introduced through human movement. Under RCP 8.5 (high emissions, “business as usual”), the ranges of at least 272 insect species are projected to expand into Vermont within the next 75 years (Hallworth et al., 2023). See Box 5-2 regarding the range expansion of the eastern giant swallowtail, the largest known butterfly in North America. With the advancement of climate change, the impacts of new species need to be iteratively researched to determine how Vermont ecosystems and wildlife communities will be affected. A 2025 study found nine new bee species have been introduced in the state (Hardy et al., 2025). Other pollinators, like the red-banded hairstreak (Calycopis cecrops)—a butterfly native to the southeastern United States, have also expanded into Vermont (McFarland, 2025). New pollinators can buffer the effect of lost native pollinator species, but they also may impose competitive pressure on remaining native species.
Two known invasive insects have already established themselves in Vermont, and their detrimental effects on ecosystems could increase with warmer annual temperatures: the emerald ash borer (EAB, Agrilus planipennis) and the spongy moth (Lymantria dispar). EAB, an invasive insect from Asia, causes extensive destruction and mortality of ash tree populations (Commonwealth of Pennsylvania, 2026). In the U.S., over 250 insects, moths, and butterfly species rely on ash trees for food and habitat, and many may face extinction as a result of the disappearance of ash trees (Malinak, 2024; Rice & Klooster, 2014). As of 2024, EAB has been recorded in 13 of 14 Vermont counties (Dockser, 2024). At temperatures below -10 F° (-23.3°C) the beetle has a 34% mortality rate, however warmer winters may result in lower mortality rates of EAB (DeSantis et al., 2013; Gaiss, 2021; see Forests 3.7.1). The number of very cold days (minimum temperatures <0°F or -17.8°C) in Vermont has decreased to 11.5 days/year in the last decade compared to 27.3 days/year in 1900–1909, representing a significant decline of 0.7 days/decade (see Climate Change in Vermont 2.4.3). Fewer very cold days means higher chances of winter survival for EAB, and therefore possible population size increases.
The invasive spongy moth has been established in Vermont for 100 years and causes large swaths of tree defoliation during outbreak years (Vermont Agency of Agriculture Food and Markets, 2026; Vermont Invasives, 2026). Spongy moth populations can be suppressed by a biocontrol fungus Entomophaga maimaiga and has been in the state since 1991. However, E. maimaiga control efficiency is predicted to decrease with warmer and drier weather—which is happening in Vermont due to climate change—leading to more spongy moth outbreaks and defoliation (Liu et al., 2025; Vermont Department of Forests, Parks and Recreation, 2026). The last major outbreak was in 2021–2022, coinciding with 2021’s warm, dry year (Hallenbeck, 2022). More than 50,000 acres were defoliated in 2021 and 42,797 acres in 2022 (U.S. Department of Agriculture, 2023). Annually, defoliation causes an estimated $868 million in damages in the U.S. (Missouri Department of Conservation, 2026). Warmer, drier years could contribute to repeated outbreaks, ultimately causing greater defoliation and greater costs to Vermont.
A known agricultural pest making its way to Vermont is the spotted lanternfly (Lycorma delicatula). First detected in Pennsylvania in 2014, the spotted lanternfly is an invasive species native to China and Vietnam, likely involuntarily introduced through human movement as egg masses attached to objects can be easily transported (U.S. Department of Agriculture, Animal and Plant Health Inspection Service, 2025). Spotted lanternflies feed on at least 65 different plant species, including the economically important common grape vine (Vitis vinifera; Lee et al., 2019). Spotted lanternflies leave behind a sticky substance called honeydew that can harm plants by attracting mold and defoliating insects (U.S. Department of Agriculture, Animal and Plant Health Inspection Service, 2025). Vermont currently contains suitable habitat based on climate data for spotted lanternflies, particularly in the southern Champlain Valley (Figure 5‑8). Establishment of this species in the southern Champlain Valley would be particularly detrimental due to the high concentration of agricultural land. While this species is not yet established in Vermont, longer growing seasons due to climate change may speed up the spotted lanternfly’s spread northward (Keena et al., 2023; O’Connel-Domenech, 2022, 2022; Wakie et al., 2020).
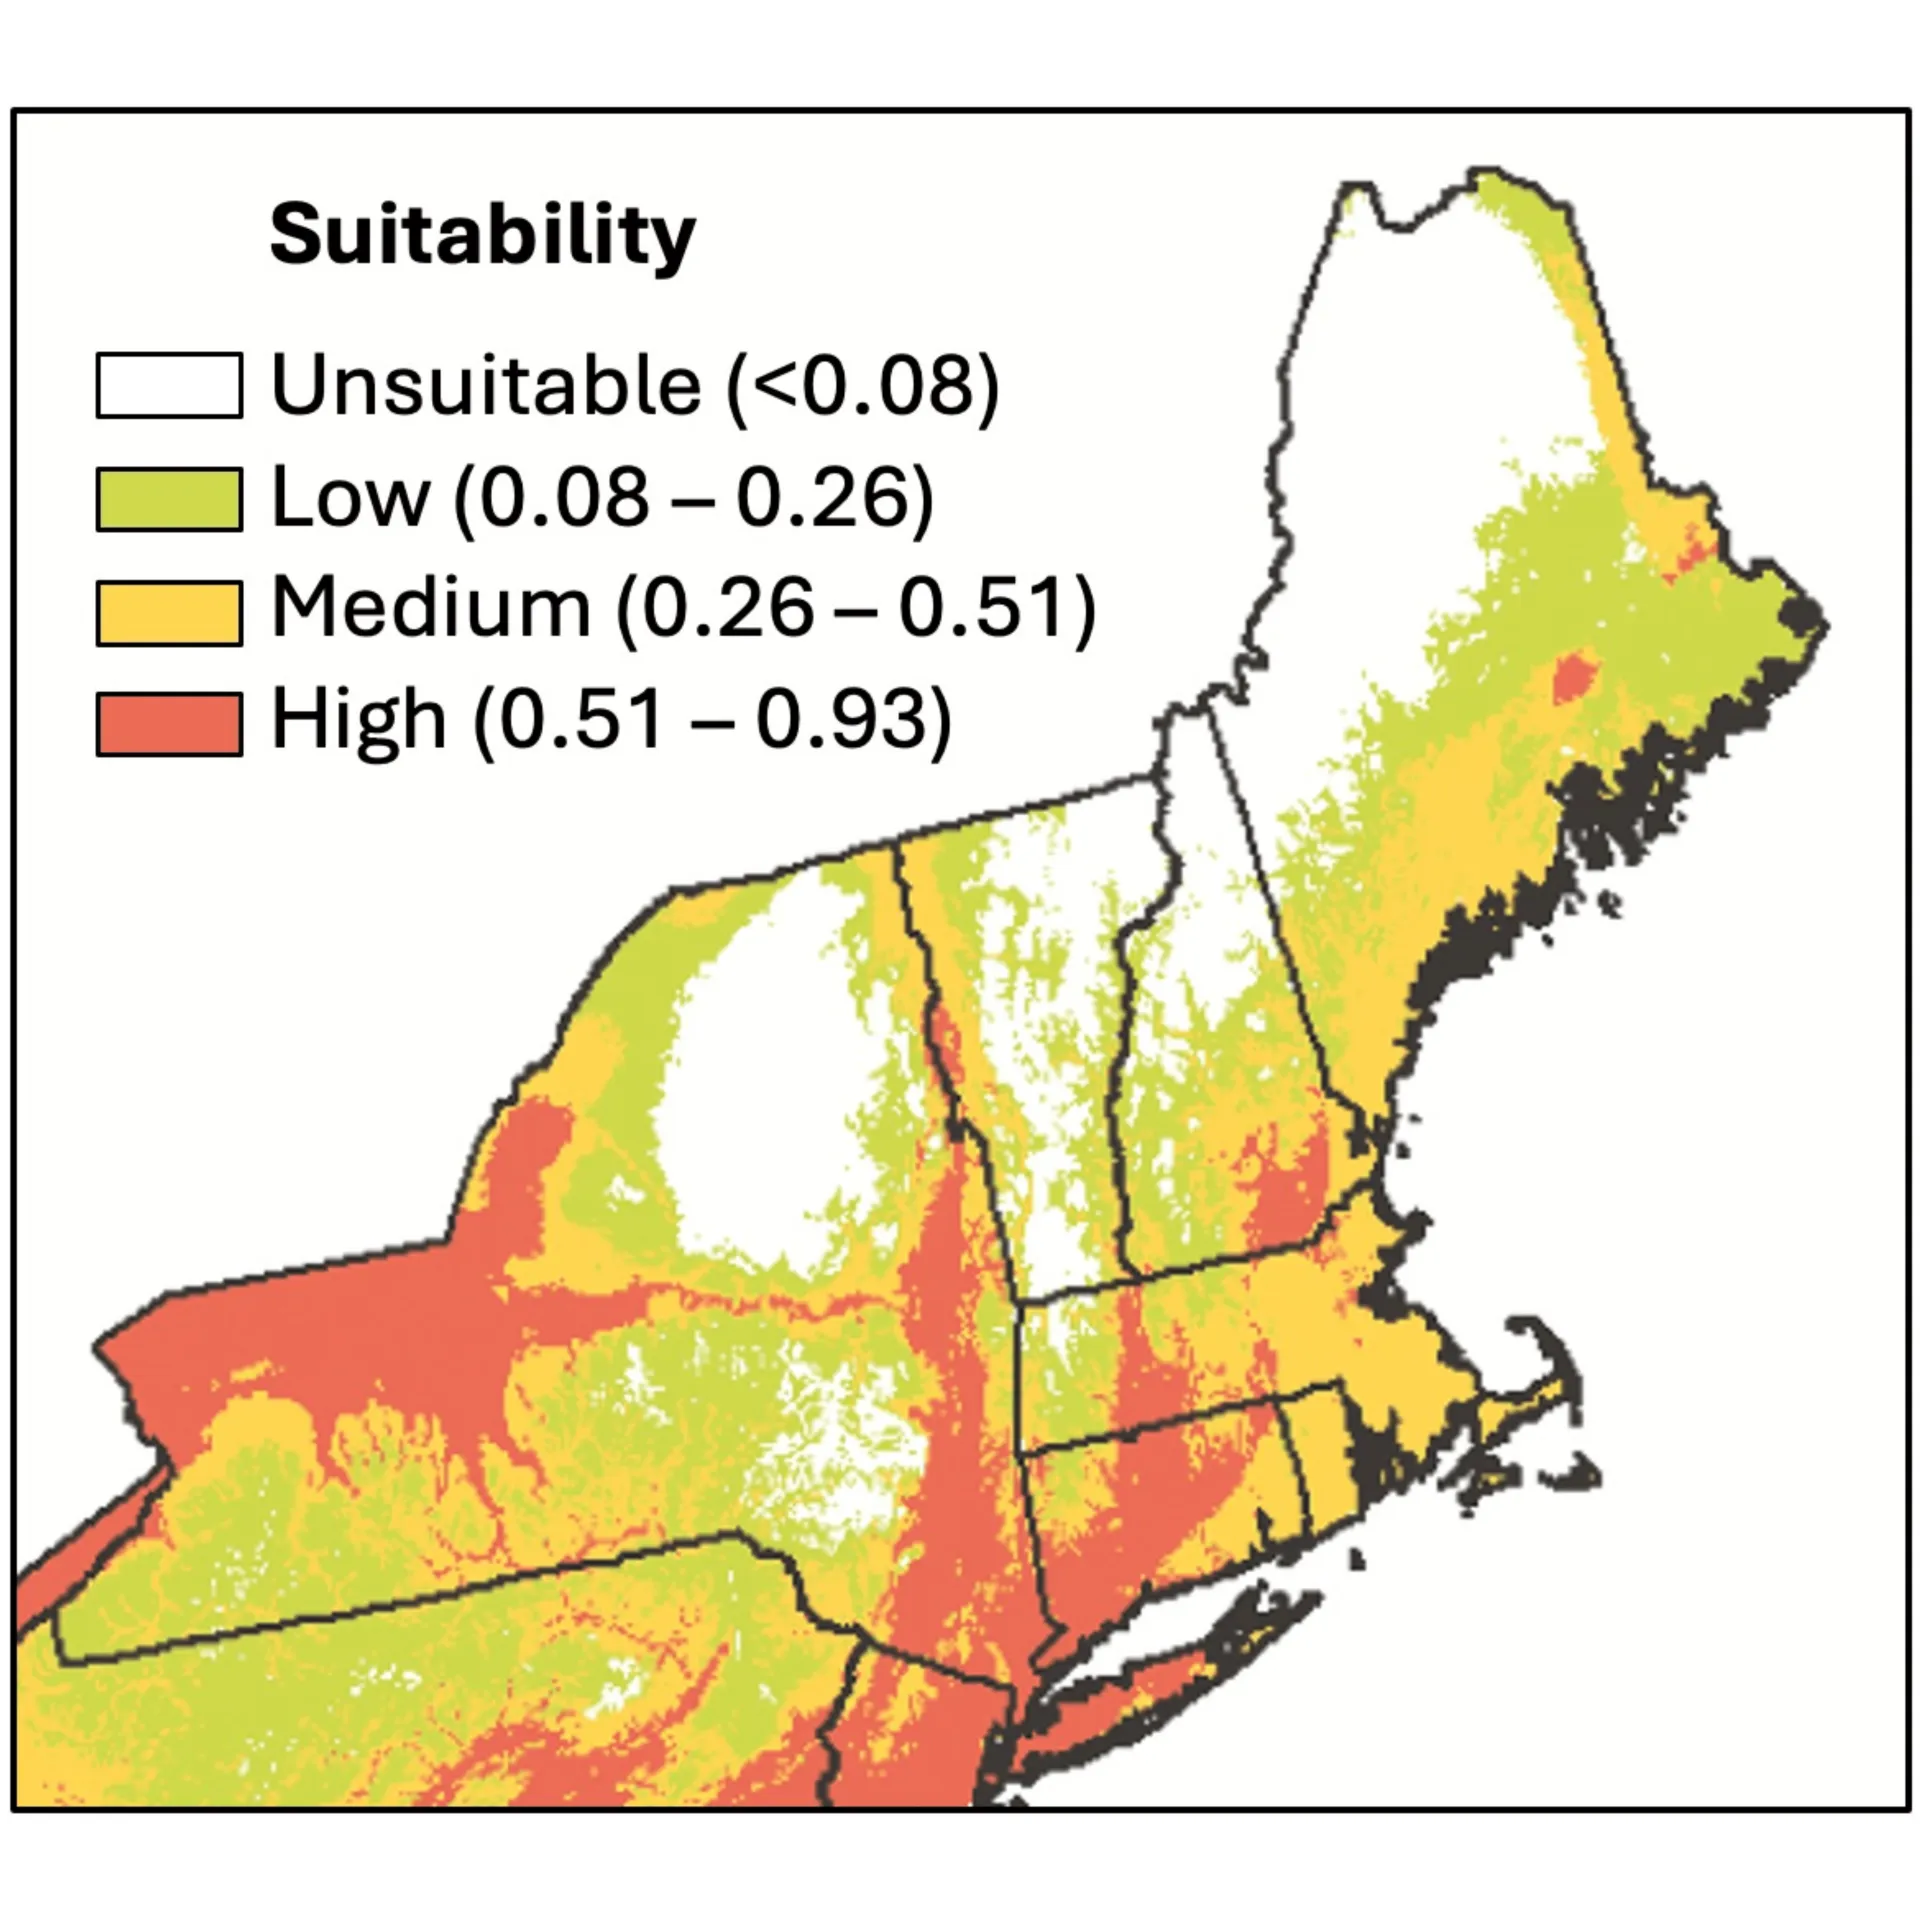
Source: Wakie et al. (2020)
Zebra mussel (Dreissena polymorpha) is an invasive species already present in Lake Champlain. Quagga mussel (D. bugensis) is a more aggressive invasive species that has greater negative impact on aquatic ecosystems and is expected to arrive in Vermont within the next decade. Quagga mussels are filter feeders that feed on phytoplankton and detritus (Hauser & Lynch, 2007). They can reproduce at temperatures as low as 48°F (9°C), while zebra mussels require at least 54°F (12°C) to reproduce (Colorado Parks and Wildlife, 2026). Zebra mussels can survive at depths more than 180 feet (54.9 meters), while quagga mussels can survive at more than 400 feet (122 meters) deep and have greater substrate tolerances, demonstrating quagga mussels’ potential to widely impact ecosystems (California Department of Fish and Wildlife, 2026; Lake Champlain Committee, 2025). These greater ranges of survivability for the quagga mussel make it more aggressive and more likely to have a greater negative impact on aquatic ecosystems than zebra mussels (Lake Champlain Committee, 2025). Quagga and zebra mussels both compete with native mussel populations, reduce food sources for aquatic species by consuming significant volumes of plankton, and limit suitable aquatic habitat by contributing to hypoxic and anoxic (low- and no-oxygen) zones at lake bottoms (Lake Champlain Committee, 2025). Boats, boat trailers, and seaplanes are a few examples of how mussels are transported to new locations (Hauser & Lynch, 2007). Although quagga mussels have not yet reached Vermont water bodies, they have expanded across the Northeast U.S. and into neighboring New York.
Box 5-2 Climate impacts on Vermont butterflies
Written by: Kent McFarland, Vermont Center for Ecostudies
It is hard to miss a giant. In 2010, when the largest butterfly in North America fluttered among a Vermonter’s flowers at the end of July, they knew it was something neat. Photos were shared online, and it later became the first record of an eastern giant swallowtail (Heraclides cresphontes) for the state. That first sighting was a bellwether for things to come. Now, over a decade later, the eastern giant swallowtail is a regular resident butterfly in parts of Vermont.
Thanks to the efforts of thousands of naturalists reporting their sightings to Vermont Atlas of Life projects such as iNaturalist, Vermont and eButterfly.org, scientists were able to track in detail the rapid flight northward by eastern giant swallowtail (Wilson et al. 2021). Over the course of 18 years, the range of the eastern giant swallowtail moved over 200 miles (322 km) north—a rate of expansion more than 27 times faster than an average organism (Wilson et al. 2021). While climatic conditions may allow them to continue their northward expansion, they’re now restricted by the range of their most northern host plant, northern prickly ash (Zanthoxylum americanum), which are not shifting at a similar pace.
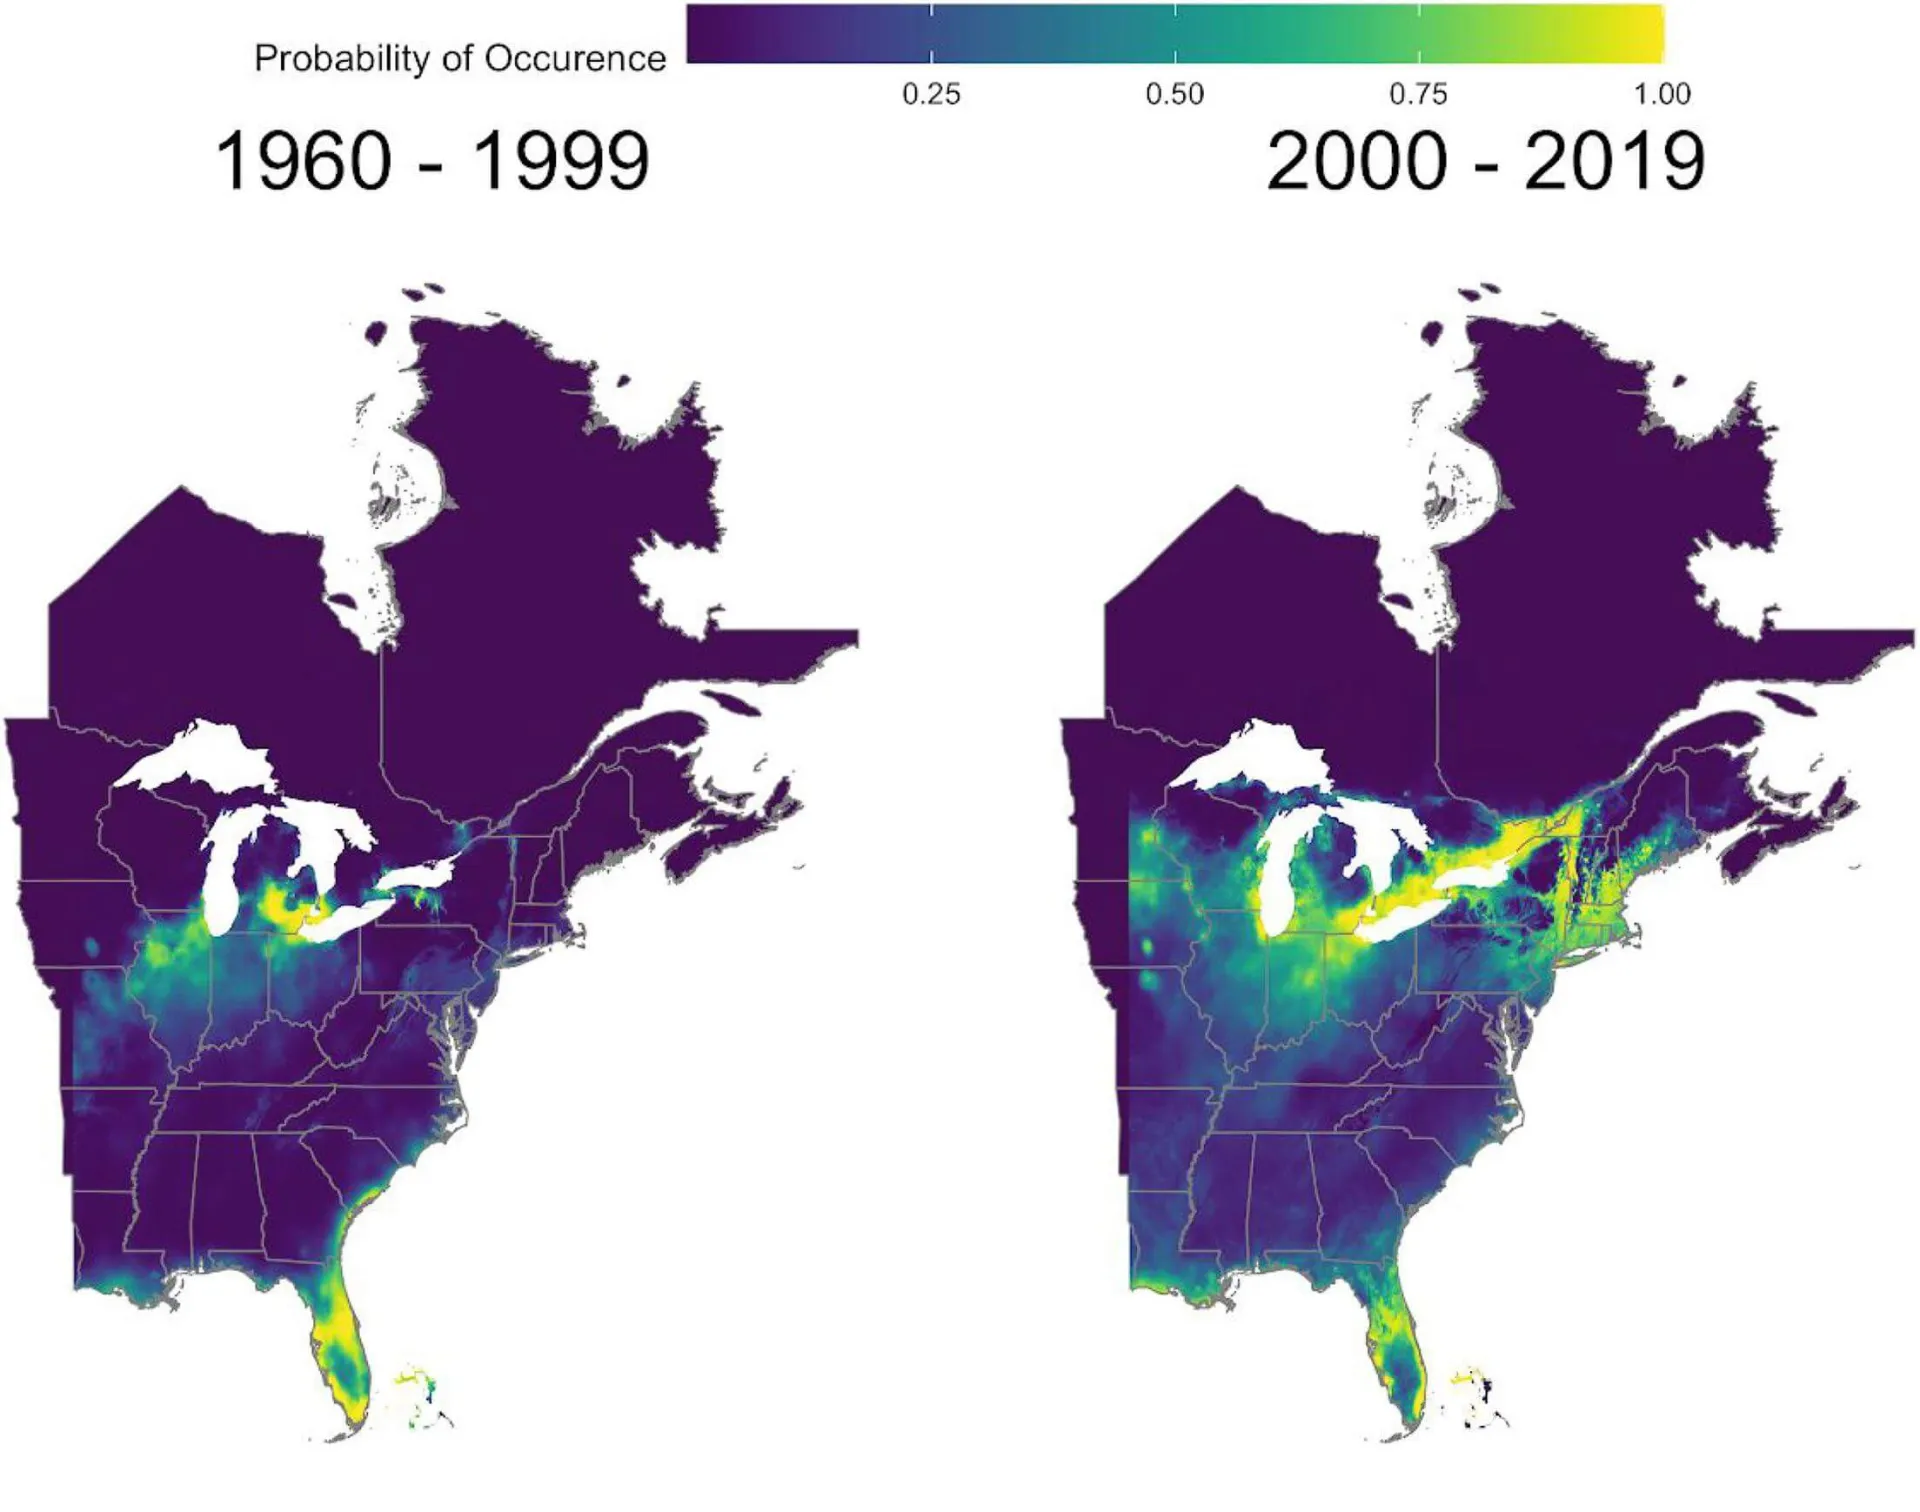
Source: Kent McFarland, Vermont Center for Ecostudies
Though sightings of adult eastern giant swallowtails will likely continue to be seen further north than the naturally occurring host plant range, without a suitable host plant further northward expansion is unlikely outside of horticultural settings. Eastern Giant Swallowtail adults lay eggs, and caterpillars feed on non-native plantings of Garden Rue (Ruta graveolens) and Gas Plant (Dictamnus albus). Common Hoptree (Ptelea trifoliata) is increasingly planted as an ornamental in the Northeast yet is a native of central and southeastern North America. Although these exotic plants are not distributed uniformly across the region, dispersing giant swallowtails have an uncanny ability to find even the smallest plantings, perhaps further enabling them to expand their range in urban and suburban areas as climatic conditions allow.
5.5 Interconnected effects of climate change on aquatic ecosystems
Aquatic ecosystems support and harbor a wide breadth of biodiversity. Climate change may contribute to population declines in aquatic fish and wildlife due to a myriad of factors. Increases in precipitation, drought, and erosion negatively impact stream water quality and their aquatic ecosystems (see Water Resources 4.4 and 4.5). Further, warmer winters cause more precipitation to fall as rain instead of snow and increase snowmelt throughout the winter, all of which will likely result in less snowmelt come spring (see Climate Change in Vermont 2.4.3 and 2.5.3). This alters lake temperatures and the hydrological regimes of streams and further affects nutrient and sediment delivery to both streams and lakes (see Water Resources 4.5).
5.5.1 Temperature effects
Warming temperatures associated with climate change are altering how aquatic ecosystems function. Water properties are often temperature-dependent, and many aquatic species are ectothermic, making them more sensitive to temperature ranges they are not adapted to. Changes in air temperature affect water temperature and the fish and wildlife in water.
In lakes, semi-annual water turnovers help aquatic species by cycling oxygen and nutrients from sediment and within the water column. In Vermont, lakes are stratified during summers and winters (Figure 5‑9) due to differences in water temperature and densities. In the summer, warmer, less dense water is on top of cooler, more dense water. The warmer water is oxygen-rich due to photosynthesis, and dissolved oxygen levels decrease with depth. During fall and spring, differences in densities of water layers decrease due to the cooling or heating of water, and wind is able to mix the water and replenish dissolved oxygen and nutrients throughout the water column (Clean Lakes Alliance, 2026; Jansen & Gabrielsen, 2025). In the winter, ice (which is less dense) floats, and warmer and denser water sinks to the bottom of the lake. Surface water is heated by sunlight in the spring, and the lake turns over again.
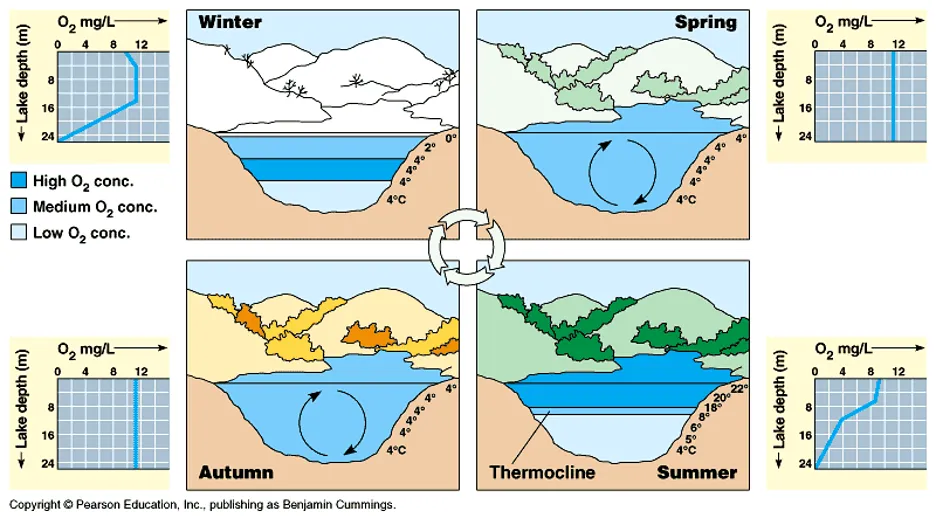
Source: Webb & Zazzara-Yu (2014)
Climate change contributes to warmer surface temperatures, earlier spring warming, and stronger stratification (Jansen & Gabrielsen, 2025). The stronger the stratification, the harder it is for the layers to mix and the longer stratification can last, resulting in lower levels of dissolved oxygen at the bottom of lakes (Fafard, 2018; Jane et al., 2022). Oxygen levels are depleted during the summer and winter at lower depths and are replenished during the fall and spring turnover (Jansen & Gabrielsen, 2025). As water temperatures increase, solubility decreases, and less oxygen is held in the water (Bukaveckas et al., 2023). If surface water temperatures continue to warm with increasing annual temperatures, oxygen levels will not be adequately replenished, resulting in less oxygen available for organisms. Earlier warm temperatures in spring are warming surface water faster, causing a shorter mixing period and resulting in stratification occurring earlier, lasting longer, and more completely depleting oxygen levels (Bukaveckas et al., 2023). A study looking at 423 lakes over the course of 20 years saw that the percentage of the water column that fell below the critical oxygen threshold increased between 0.9% to 1.7% per decade (Jane et al., 2022). The replenishing of dissolved oxygen into lower water levels is a critical source of oxygen for aquatic organisms. Thus, the amount of dissolved oxygen introduced into lakes has a direct impact on the survival of aquatic life. Fish living deep underwater may face critically low levels of oxygen, which can be fatal. Warm water in summer drives fish into cooler, deeper parts of lakes, however lower oxygen levels may limit the depths fish can live in, leaving fish to live in a narrow suitable habitat with nowhere else to go (Tandon, 2021).
Mercury in water systems is increasingly converted into MeHg, the bioavailable and more toxic form of mercury, due to changes in water temperature (Jordan et al., 2019). Mercury is a toxic, heavy metal that can travel hundreds of miles in the air from anthropogenic sources such as gold mining, coal burning, and production of nonferrous metals and cement. Mercury from the air is deposited and collects in runoff and waterways, where microorganisms can then convert mercury into MeHg (Environmental Protection Agency, 2025, 2026; Jordan et al., 2019), a neurotoxin that causes damage to wildlife genes, physiological changes, bioaccumulation, and eventually death (Jeong et al., 2024). Through consumption and bioaccumulation, MeHg concentrations are magnified greatly in organisms at the upper end of food chains (Kotalik et al., 2025). Many different variables, such as the ecosystem's chemical properties, sediment organic carbon, and water temperature, impact the rate at which microbes convert inorganic mercury into MeHg (Buckman et al., 2019). Increased heavy precipitation events create waterlogged conditions in wetlands, which favor this conversion of mercury (Jordan et al., 2019). Increases in water temperature release pollutants from sediments, including MeHg, exposing aquatic organisms (Jeong et al., 2024). Additionally, increased fluctuations in water levels, lower pH, and low dissolved oxygen levels create more favorable conditions for bacteria to convert inorganic mercury into MeHg (Faccio et al., 2019). The substantial variability of such properties and processes makes studying the impact of climate change on MeHg in ecosystems difficult. However, MeHg can persist in aquatic ecosystem sediment for decades, enhancing its effect over time, especially with the advancement of climate change (Jeong et al., 2024; New Hampshire Department of Environmental Services, 2019).
Wetlands, and occasionally vernal pools, often have anoxic conditions and support microbial communities that convert inorganic mercury into MeHg (Faccio et al., 2019; Kifner & Eakin, 2026). Studies measuring MeHg levels in amphibians and plants in wetlands found that the higher the organism is in the food web, the higher the concentration of MeHg present in that organism, indicating the chemical’s bioaccumulative nature. This puts aquatic wildlife at higher trophic levels in greater danger of toxicity from MeHg. Effects of MeHg toxicity in aquatic organisms include neurotoxicity and immunotoxicity, damage to DNA, changes in phenotype, and damage to metabolism. Neurotoxicity caused by MeHg can change organism behaviors, such as the way species swim, and lead to immunotoxicity (Jeong et al., 2024). A study on fathead minnows (Pimephales promelas) examined whether maternal fathead minnow diets containing low and high concentrations of MeHg impact embryo viability and development. It was found that low and high levels of MeHg consumed by adults delayed hatching and increased mortality, as well as affected larval fish behaviors and development. However, no differences were observed in spawning frequency, clutch size, or egg output (Nielsen et al., 2015). It remains unclear how climate change is impacting levels of MeHg in Vermont aquatic systems, however increased levels of mercury have been recorded across most taxa in the Northeast U.S. (Vermont Center for Ecostudies, 2026a). A study on the Chinese weather loach (Misgurnus mizolepis) found that as temperatures increased, the absorption of MeHg increased, and loach survival rates decreased as temperature and MeHg concentration increased (Pack et al., 2014). How exactly temperature affects MeHg adsorption rates is uncertain. However, a clear correlation exists between the two variables. Currently, the Vermont Watershed Management Division is researching which Vermont lakes contain high mercury levels and thus will require monitoring and management (Vermont Department of Environmental Conservation, 2026a).
Early life stages tend to be the most vulnerable to warmer temperatures. Eggs are a thermally sensitive life stage for fish, with higher mortality rates at warmer temperatures (Gagliano et al., 2007). Previous studies on cold-water fish species show that eggs spawned in higher water temperatures had diminished quality and quantity and lower viability (Brown et al., 2006; Wild et al., 2023). Thus, if intense heat occurs during fish spawning, then population sizes may be affected (Pankhurst & Munday, 2011).
5.5.2 Precipitation effects
Increased precipitation and frequency of flooding events from climate change will increase sediment transport and loads into Vermont water bodies (see Water Resources 4.4.4). Agricultural fields, roads, and forests are sources of sediment surface runoff, which carries organic matter, nutrients, animal waste, pesticides, and chemicals. Sedimentation causes damage to fish spawning beds and suspended sediment particles can both diffract light— reducing available sunlight for photosynthesis—and can absorb heat thereby increasing water temperatures (California State Water Resources Board, 2026; Lake James Environmental Association, 2018). Pesticides carried from agricultural fields into water bodies can be toxic to aquatic plants and animals.
Algae blooms occur due to increased nutrient loads in water bodies (see Water Resources 4.5.5). Runoff from agricultural fields containing phosphorus and nitrogen is a primary source of these nutrients. Nutrients increase phytoplankton algae activity, resulting in depleted oxygen levels in the water and subsequent massive die-offs of fish and aquatic organisms that depend on dissolved oxygen. With the added presence of algal blooms, the opportunity for mass die-offs of aquatic species is exacerbated as warmer waters hold even less oxygen. In Vermont, a common type of algal bloom is cyanobacteria, also called blue-green algae. This type of bloom produces cyanotoxins, which are harmful to fish and wildlife as well as humans and their pets (see Human Health 10.7.2) through exposure or consumption. Although there is no evidence that cyanotoxins accumulate and remain in fish over many years (Swinton & Nierzwicki-Baur, 2018), additional research needs to be conducted on the impacts of such algal blooms on the Vermont fishing industry.
Another major pollutant to Vermont’s surface waters is sodium chloride (NaCl), which comes from surface runoff of road salt to rivers, groundwater, and lakes. At high concentrations, sodium chloride is toxic to aquatic organisms. Sodium chloride does not break down over time and contributes to deoxygenation of lakes through creation of an oxygen-deficient layer (Mansberger, 2023; Missouri Department of Natural Resources, 2026). Sodium chloride can also burn fish’s gill tissue, cause neurological issues, and damage sensory organs in fish and amphibians. Larger fish will die faster than smaller fish due to their smaller gill surface area (Brungs, 1973). Increased precipitation with climate change will result in more runoff, carrying with it more sodium chloride and other pollutants from roads into water bodies. Increasing winter daily high temperatures increase frequency of freeze-thaw cycles and ice, which will result in greater usage of road salt and increased chloride runoff throughout the year (Miron et al., 2022).
Lake Champlain lost shallow water habitat during the 2025 drought, negatively impacting habitat suitability for young fish to find food and hide from predators (Finno & Oliver, 2025). As lake water levels decline, water temperatures increase, resulting in surface waters becoming too warm for aquatic species and expanding hypoxic zones at the lake bottom. These conditions force aquatic life to coexist in a narrower range of habitat, increasing competition. Cold-water fish, such as the rainbow smelt (Osmerus mordax), which typically live in bottom of lakes in cold waters, are forced to move upwards into more suitable habitat due to deoxygenation of water at the bottom of the lake. Rainbow smelt and other aquatic species then face increased competition, resulting in rainbow smelt becoming more vulnerable to predators and spawning sites more exposed to anglers, windstorms, and waves (Finno & Oliver, 2025).
5.5.3 Synergistic temperature and precipitation effects and extreme weather events
Increases in air temperature and changing precipitation patterns have altered the streamflow of Vermont’s rivers and tributaries (see Water Resources 4.3.1). Streamflow plays a key role in providing a stable source of oxygen and nutrients to aquatic species. Significant changes in streamflow could dramatically shift many species’ survival. Warming winters and more frequent rain-on-snow events have reduced Vermont’s overall snowpack, resulting in less spring snowmelt and less gradual nutrient runoff into surface waters. Instead, an increasing proportion of nutrient runoff will come from more intense and variable rain events, resulting in more intense and less consistent streamflow (see Water Resources 4.5.2). Increased winter streamflow transports phosphorus during the winter that is typically reserved for spring melt (Lake Champlain Basin Program, 2025). Faster snowmelt also results in more drastic changes in streamflow, meaning water will enter streams in more intense, short outbursts compared to slower and steadier streamflow historically noted. Streams will experience a surplus of flow for a short period, followed by a long stretch of minimal water flow. These changes in streamflow are observed more in rivers at northern latitudes that experience heavy snowfall, most likely due to changing precipitation patterns caused by climate change (Gupta et al., 2023). River flow seasonality is decreasing across the contiguous United States, which indicates the disruption of seasonal flow (Wang et al., 2024).
Vermont’s rainbow trout are dependent on streamflow patterns for habitat and as a spawning cue. Fast spring streamflow and warming water temperatures cue rainbow trout in March to May to begin spawning (Vermont Fish and Wildlife Department, 2026h). Significant changes in streamflow patterns could disrupt rainbow trout survival and spawning behaviors.
Occasional, and moderate flood events can be beneficial to fish populations (Lake Champlain Committee, 2024); however, the occurrence of multiple 100-year or larger floods occurring within short (e.g., five-year) periods may have a negative overall effect on aquatic species. After flood events, adult fish population sizes remain around the same as pre-flood levels due to an abundance of nutrients from the accumulation of dead insects. However, young fish are more sensitive to changes in their environment and have higher mortality rates following flooding, as compared to adult fish who can withstand stronger stream flows (Lake Champlain Committee, 2024). With increased frequency and strength of flooding events, aquatic populations may not have adequate time to rebound between events, increasing population stress.
Droughts reduce the amount of available and suitable habitat for aquatic organisms, especially at higher elevations. As such, connectivity between habitats is reduced, increasing population vulnerability through isolation (Lin et al., 2018; Stoffels et al., 2022). Less suitable habitat can also increase competition between species and individuals, disrupting ecosystem balances and potentially decreasing fish population numbers (see 5.3.3 and 5.5.4). Droughts also interfere with fish reproduction by limiting the habitat available for fish to spawn. Shallower pools heat up faster in the spring and summer, and water temperatures may exceed the temperature ranges for egg survival and decrease oxygen levels in the water (Wild et al., 2023). Warmer stream temperatures, extreme precipitation events, and nutrient loading all enhance stress on aquatic life and ecosystems (Climate Central, 2019).
5.5.4 Aquatic connectivity
For aquatic species, connectivity is maintained by interconnected waterways. Vermont contains 23,000 miles of waterways, which are home to rich vertebrate and invertebrate biodiversity (Vermont Department of Environmental Conservation, 2026b). Climate change impacts water levels that may restrict or promote connectivity in river systems. Climate change in Vermont is predicted to result in increased extreme precipitation events, as well as increased precipitation variability resulting in more frequent and extreme weather events like flooding and droughts (see Climate Change in Vermont 2.5.2 and 2.6). In 2025, drought caused an historic low in water levels (see Water Resources 4.3.2). These conditions lead to dry patches in rivers and streams that restricted fish passage and disrupted aquatic habitat connectivity. In the summer of 2025, 100% of Vermont experienced drought conditions (Sanders, 2025; Figure 5‑10), leading to streamflow that was 15–30% lower than normal for several Vermont streams (Consol, 2025) and the lowest seven-day average streamflow in nearly a century at Otter Creek (New England Water Science Center & United States Geological Survey, 2025). While populations may be able to recover in the short-term when water levels are high, extreme events like the 2025 drought can have lasting effects on population viability. For instance, if drought occurs during a breeding period for a fish species, dried portions of rivers or streams can prevent competitive breeding through habitat fragmentation, thus reducing overall genetic diversity. Several Vermont fish species spawn in early summer when drought is likely, including bowfin (Amia calva), longnose gar (Lepisosteus osseus), rock bass (Ambloplites rupestris), smallmouth bass (Micropterus dolemieui), white perch (Morone americana), and white sucker (Catostomus commersoni) (Vermont Fish and Wildlife Department, 2026b, 2026f, 2026i, 2026j, 2026m, 2026n).
Prolonged droughts may impact streamflow and reduce habitat availability, impacting fish’s ability to reproduce, resulting in negative population trends over time (Espínola et al., 2025). Droughts which change landscapes so much that they cannot return to their original baseline conditions are known as ecological droughts. Ecological droughts can occur when streams have dried out completely, or when species leave and do not come back the following year, impacting aquatic and terrestrial ecosystems (Finno & Oliver, 2025). Alternatively, flooding may promote connectivity by pushing individuals to new areas downstream, wetlands, or oxbow lakes, but could disrupt connectivity when narrow culverts and waterways are blocked by impassable debris (Fischer et al., 2018). Flooding can create new habitat for aquatic species, however heavy flow can also transport contaminants that make areas unsuitable for wildlife (Lake Champlain Committee, 2024).
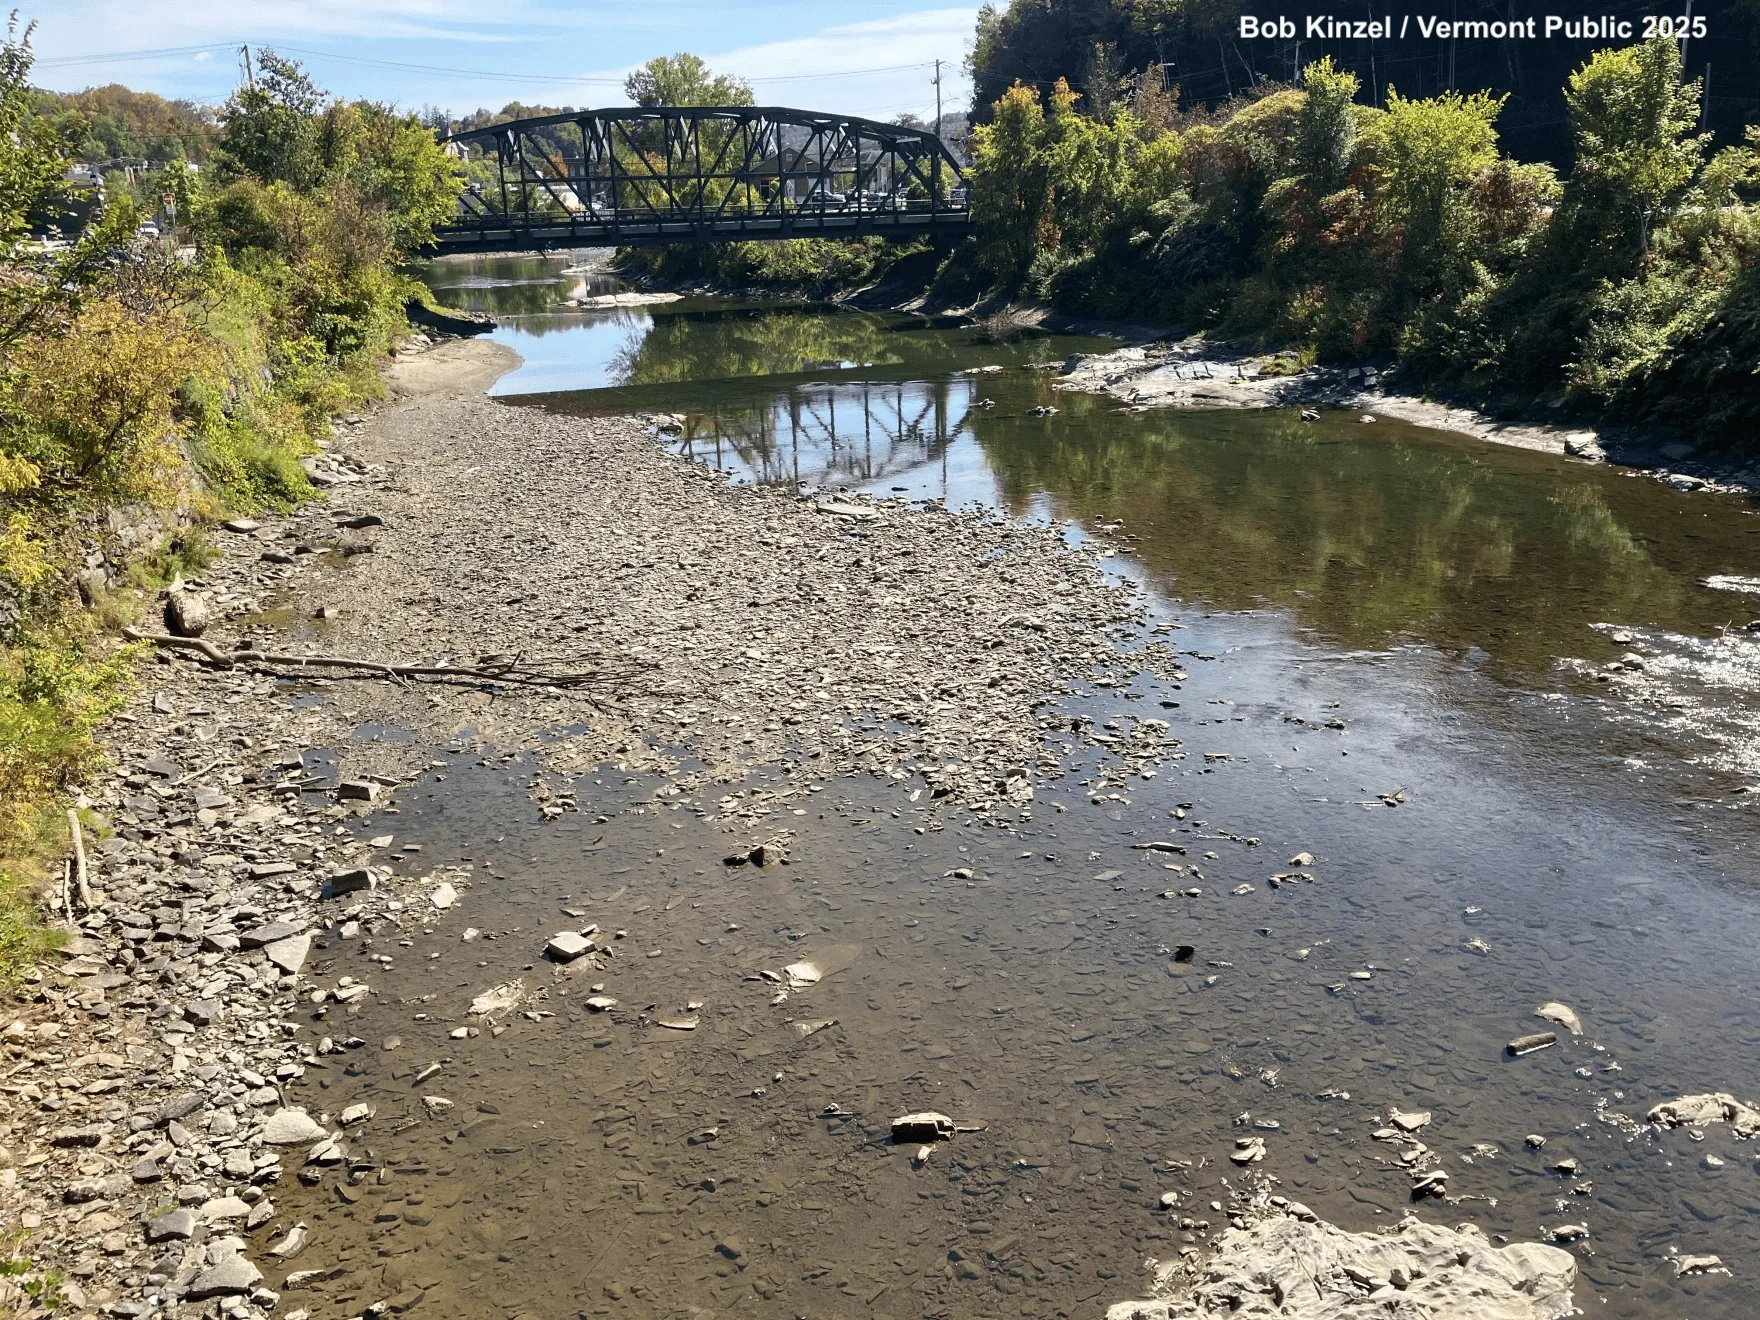
Source: Bob Kinzel for Vermont Public (2025)
5.6 Specific aquatic ecosystem effects
5.6.1 Lakes, ponds, and streams
Fishing is an important livelihood and recreation activity for many Vermonters. A 2020 survey found there were almost 72,000 Vermonters fishing in Vermont’s waters the previous year (Responsive Management, 2020). The most popular fish species for anglers are smallmouth bass (Micropterus dolomieu), largemouth bass (Micropterus nigricans), brook trout (Salvelinus fontinalis), rainbow trout (Oncorhynchus mykiss), and yellow perch (Perca flavescens). Warming temperatures associated with climate change pose a threat to cold-water fish species (Table 5-5). Data from Vermont fisheries biologists suggest that river populations are currently stable. However, increased stream temperatures, flood frequency, and subsequent decreased oxygen levels in water are likely affecting species survival (Nicholson et al., 2018). Many Vermont rivers and streams are shaded, protecting them from some evaporation during droughts and keeping water temperatures cooler (Eldridge, 2021). Although droughts can disconnect populations and habitat, they may be able to recover once water levels return to normal. During a drought, if there is sufficient groundwater, rivers can remain cool. However, prolonged and more frequent drought seasons could minimize this effect, especially where shallow groundwater sources are feeding streams.
Popular fish species for anglers | Temperature classification | Temperature requirements |
|---|---|---|
Smallmouth bass | warm | 68°F to 82°F (20°C to 27.8°C) |
Yellow perch | cool | Optimal range 70°F to 75°F (21°C to 24°C). Spawn at 44°F to 55°F (6.7°C to 12.8°C) in April-May (Brown et al., 2009). Maximum water temperature 78.8°F (26°C). |
Rainbow trout | cold | 54°F to 66°F (12.2°C to 18.9°C) in streams and 45°F to 64°F (7.2°C to 17.8°C) in lakes. Maximum water temperature of 77°F (25°C) |
Brook trout | cold | ~32°F to 65°F (0°C to 18.3°C). Spawning late September to November when stream temperatures are 40°F to 50°F (4.4°C to 10°C). Can survive briefly up to 72°F (22.2°C) but will die at water temperatures above 75°F (23.9°C). |
Rainbow smelt | cold | 28.7°F to 60°F (-1.8°C to 20°C) |
Source: Vermont Fish and Wildlife Department (2026c), Vermont Fish and Wildlife Department (2026j), Vermont Fish and Wildlife Department, (2026h), Fuller et al. (2020)
Increased flooding frequency and precipitation-related sediment runoff from climate change are expected to negatively impact brook trout populations, as this will limit the range of suitable stream habitat (Truong et al., 2017). This species also requires cold stream temperatures for successful reproduction and young survival. Ideal temperature ranges for brook trout are between 55°F to 60°F (12.8°C to 15.5°C), and temperatures exceeding 75°F (23.9°C) will result in death (Vermont Fish and Wildlife Department, 2026c). The combination of expected changes is anticipated to increase stress on the population, potentially reducing fish numbers. Additionally, it is expected that predicted increasing stream temperatures will negatively impact brook trout population numbers (Nicholson et al., 2018). A study conducted in the Shenandoah National Park in Virginia reported that the abundance in brook trout decreased by 50% or more in 70% of the streams located within the park, and streams with higher water temperatures generally had greater population declines (Childress et al., 2024). However, forested watersheds and riparian areas can help to buffer temperature changes in streams (Nicholson et al., 2018; Truong et al., 2017).
5.6.2 Vernal pools
Climate change can threaten local vernal pools and their populations. Hotter, drier summers can reduce the length of time vernal pools hold surface water, called the hydroperiod, and thus the duration they can provide habitat to animals. For species that rely on these pools for breeding, complete loss of the pools could isolate populations and reduce connectivity.
Vernal pools are ephemeral freshwater wetlands that emerge seasonally following wet and dry cycles. Surface water accumulates from winter and spring precipitation in shallow bowls that are at most 5,000 square feet. They dry out during summer and fall, with the hydroperiod dependent on precipitation, groundwater conditions, and temperature (Brooks, 2004). Vernal pool ecosystems are dotted across the Vermont landscape, with over 5,000 probable, potential, or confirmed pools (Vermont Center for Ecostudies, 2026b). Many Vermont vernal pools are protected in conservation areas (Vermont Fish and Wildlife Department, 2026k). The transient nature of vernal pools is necessary to exclude fish as predators, but drying out too early is detrimental for the species that inhabit them.
Vernal pools are critical habitat for many species, from tiny, microscopic aquatic invertebrates that support the food web, to larger vertebrates like amphibians that use them to breed. Vernal pools also provide resources for other wildlife, including birds such as heron and owls and mammals like black bears, bats, and raccoons (Vermont Fish and Wildlife Department, 2026l).
Vernal pools support populations of several amphibian species of conservation concern in Vermont. Of amphibian and reptile species in the state, 27.5% are listed as SGCN (Vermont Fish and Wildlife Department, 2026a), including the spotted salamander (Ambystoma maculatum), Jefferson salamander (Ambystoma jeffersonianum), and four-toed salamander (Hemidactylium scutatum), which all rely on vernal pools. Vernal pools also provide breeding habitat for wood frogs (Lithobates sylvaticus), spring peepers (Pseudacris crucifer), and blue-spotted salamander (Ambystoma laterale). These amphibians are important members of forest food webs and are considered ecosystem sentinels, meaning a decline in their populations may be indicative of deteriorating ecosystem quality (Hopkins, 2007).
Fairy shrimp (Anostraca) live in cold and deep vernal pools and cannot survive at water temperatures exceeding 68°F (20°C) (Aldrich, 2024). As such, increasing temperatures threaten their habitat. Species like fairy shrimp that are unable to migrate to new habitats for better living conditions are faced with increased risk of extinction as temperatures rise.
Climate change is increasing summer temperatures (see Climate Change in Vermont 2.4.4), contributing to shorter vernal pool hydroperiods. Increased winter precipitation (Bauder, 2005; Brooks, 2004, see Climate Change in Vermont 2.5.3)could increase hydroperiod, but it may not be sufficient to compensate for warmer weather, though one study found that precipitation plays a greater role than evapotranspiration in vernal pool hydroperiod and water depth (Brooks, 2004). Spring and summer precipitation is becoming more unpredictable under climate change (see Climate Change in Vermont 2.5), as some years may have extreme rain events and others have prolonged droughts. While a single year of disturbance may not have lasting effects on vernal pool ecosystems, continuing cycles of extreme weather can make it harder for wildlife dependent on vernal pools to recover, especially species that are already at risk.
5.6.3 Wetlands
Wetlands provide habitat, buffers, and natural water filtration for over 290,000 acres in Vermont (Vermont Fish and Wildlife Department, 2015). Wetlands are saturated with surface water for most of the year, but they may be under peril with increased frequency and strength of dry spells and droughts in Vermont (see Climate Change in Vermont 2.6.3). Wetlands compose 4–6% of Vermont’s land area (U.S. Fish and Wildlife Service, 2026d). However, almost 50% of historic wetland areas have been damaged or destroyed through land development for agricultural, industrial, and residential purposes, and an estimated 20 acres of regulated wetlands continue to be lost every year (Vermont Natural Resource Council, 2026). The Vermont Department of Environmental Conservation Watershed Management Division is working on restoring and managing wetlands with the Vermont Wetland Program Plan (2023-2028; Lake Champlain Basin Program, 2026b; Vermont Department of Environmental Conservation Water Management Division, 2023) and have restored almost 4,000 acres of wetlands since 2001. Considering that 35% of endangered and threatened species in Vermont live on or depend on wetlands (Fisher et al., 2021), the large impact of anthropogenic stressors on these ecosystems could prove detrimental to the state’s overall biological diversity.
Wetland areas provide unique habitat for wildlife and are a vital source of surface water. As variable precipitation patterns threaten the size and longevity of wetlands, reliant populations may experience less connectivity (see 5.3.3). Amphibians and aquatic life are most likely to be impacted, as their smaller size and water reliance limit their migratory capacity compared to other populations (Neves et al., 2025). Lake Champlain is part of a large migratory pathway for waterfowl as species travel south for the winter and north again in the spring. Along the way, over 300 bird species migrate through the Lake Champlain basin, using its wetlands, fields, forests, and open waters as sources of food and for shelter (Lake Champlain Basin Program, 2026a, 2026b). The loss of wetlands, which serve as important nesting habitat for migratory birds, could have devastating effects for migrating species (Vermont Department of Environmental Conservation, 2026c).
5.7 Changes in inter-species dynamics
Climate change influences the habitat available to fish and wildlife (see 5.3) as well as what resources they consume, ultimately impacting how species interact with one another. This section will discuss three examples of such interactions relevant to Vermont: 1) two browsing herbivores, white-tailed deer and moose, competing for similar resources, 2) the phenological mismatch between wildlife and their non-animal environment, and 3) changes to wildlife and the pathogens they can be infected with and carry.
5.7.1 Browsing herbivores
Warmer winters may increase white-tailed deer (Odocoileus virginianus) survival and result in the growth of deer populations. Deer are examples of “keystone herbivores,” as their diet impacts vegetation composition and indirectly affects other animals and plants (Weiskopf et al., 2019). Changes in available vegetation impact habitat suitability for other wildlife. Alteration of vegetation in forests can make way for more invasive plant species to take hold and indirectly affect bird populations. As deer populations grow, woody plants are more rapidly consumed in the understory, potentially decreasing woody plant diversity. As a result, forests contain largely older trees which aren’t replenished by younger trees due to overfeeding on saplings by deer (Perea et al., 2014; see Forests 3.7.2). Bird species diversity is tied to tree species diversity—as tree diversity decreases, so does bird diversity (Xu et al., 2022). Milder winters also lead to less snowpack cover, which exposes more brush for deer to eat, and with more access to food, deer populations surge. Winter severity is a primary driver of deer mortality, and less harsh winter conditions can result in reduced deer mortality and greater deer populations.
Alternately, moose thrive in cold winters and high latitudes and have higher respiration rates in warmer temperatures. Moose populations are expected to shrink in southern Vermont due to increased heat stress from warmer temperatures, as they expend more energy to regulate their body temperature and as a result are more at risk for heat stress (Rodenhouse et al., 2009). With less snow cover, moose will also have more browsing opportunities thereby reducing winter feeding stress. Combined, moose and deer can greatly impact forest species composition (Brandner et al 1990; McInnes et al 1992).
As deer and moose habitat overlap, moose are more likely to be infected with new diseases. Deer are carriers of the parasitic nematode Parelaphostrongylus tenuis, and while they themselves are unaffected by it, the parasite targets the nervous system of moose, causing paralysis and death. Deer avoid snow-covered areas, and with decreases in snow cover, this allows for more interactions between deer and moose, resulting in increased moose mortality due to the parasite (Rodenhouse et al., 2009). Moose populations are further at risk from ticks, which deer often carry and spread. A study conducted between 2017 and 2019 showed that 74% of all moose mortalities were caused by winter ticks. If no ticks were present, the study also showed that 90% of moose calves would have survived (DeCesare et al., 2024; Vermont Fish and Wildlife Department, 2026g).
With warmer summers and increased mortality risk during winter, moose face severe stress due to climate change. Conversely, deer populations are expected to benefit and increase with climate change (Rodenhouse et al., 2009). The quality of forest habitat is decreasing, and so deer are increasingly found in suburban environments, increasing deer-human conflicts and complicating hunting. Increasing hunters’ access to suburbanized areas can aid in maintaining deer populations, and incentives could help (Vermont Fish and Wildlife Department, 2020). Extending archery season may allow for increased harvest of antlerless deer, helping to keep populations under control (Vermont Fish and Wildlife Department, 2026d).
Changes in Vermont demographics have resulted in fewer young adult hunters, and fewer younger people interested in hunting, a problem for the management of deer populations. In 1987, more than 90,000 hunting licenses were sold; in 2017, fewer than 50,000 licenses were sold (Trombly, 2019). Target annual buck harvests vary year to year to help maintain a healthy population size (Vermont Fish and Wildlife Department, 2025d), but larger harvest numbers and license sales may be necessary in the face of predicted larger deer population sizes. A total of 174 of 180 available moose licenses were awarded in 2025 to hunters. Managers aim to reduce moose population density and thus winter tick abundance to benefit moose health in the long-term (Vermont Fish and Wildlife Department, 2025a).
5.7.2 Phenology
Species across all taxa follow certain patterns and cycles depending on the season; this is known as phenology and is characterized by environmental factors like temperature and length of daylight. Many ecosystem processes depend on the phenology of different species aligning. However, when different species have different environmental cues for their phenology, phenological mismatch can occur. In such cases, species emerge or arrive in an ecosystem at different times, throwing off the intricate processes that support healthy ecosystems and their functions.
Phenological mismatch is a particular problem for Vermont agriculture and ecosystem function. Flowers in the northeastern U.S. are blooming earlier due to longer growing seasons and warmer temperatures associated with climate change (Miller-Rushing & Primack, 2008). Bee phenology, including time of emergence, is less affected by climate change than flower phenology, so the window for pollinators to interact with flowering plants is shortening (Pyke et al., 2016; Stemkovski et al., 2020). This has negative implications for food production (see Agriculture and Food Systems 6.3.3). Some pollinators may also emerge earlier due to changing temperatures, but other pollinators still emerge later than flowers (Kudo & Ida, 2013). Such phenological mismatch most often occurs when snowmelt comes earlier but ground temperature warms slower (Kudo & Cooper, 2019). Due to climate change, winter precipitation in Vermont is expected to increasingly come in the form of rain or sleet rather than snowfall, with a rising number of rain-on-snow events (see Climate Change in Vermont 2.5.3). Since earlier flower blooming times and earlier snowmelt already exist, phenological mismatch between pollinators and plant recipients is increasingly likely. Studies show that bee emergence is reliant on air temperature, so bees may be able to adapt and emerge earlier as spring temperatures become milder, retaining some synchronicity with flower blooming (Kudo & Cooper, 2019).
Phenological mismatch can also cause problems for vertebrate species. Bird breeding, migration, and nesting are synchronized with the peak occurrence of resources to maximize survival rates (Climate Adaptation Science Centers, 2017). However, the effects of climate change on resource availability vary with its impacts on migration, breeding, and nesting, making it difficult to study. Birds are arriving to their migratory areas earlier than they used to; some nearly two weeks earlier than they did in the 1950s (Clark, 2013). Earlier migration could result in a mismatch with the emergence of food resources like insects and fruits that have different phenological cues.
Phenological mismatch can affect survival rates for other reasons. In the fall, the fur of the snowshoe hare (Lepus americanus) turns from brown to a snowy white, blending in with snow and helping avoid predators during winter. As winters in Vermont become milder with less consistent snow cover and snow depth (see Climate Change in Vermont 2.4.2), snowshoe hares will be more easily seen and exposed to predators (Oli et al., 2023). Hares use temperature and snow depth as cues to change color, and it takes around a month from first registering the colder temperatures and snow to hares becoming fully white. A study on snowshoe hares in the Canadian Yukon found that hares turn white later in the fall due to warm fall temperatures lasting longer. They also found that hares that turned white later in the fall were less likely to survive the winter, as they may not have been white in time for snowfall and became easy targets for predators (Oli et al., 2023). The 2015 Vermont Wildlife Action Plan asserts the snowshoe hare population is stable, but they are listed as a high-priority SGCN due to their role as primary prey for at-risk carnivore species such as the Canada lynx (Lynx canadensis) and American marten (Martes americana; Vermont Fish and Wildlife Department, 2015). Their population numbers will likely decrease with climate change in part due to phenological mismatch, but to what extent their population faces decline is unknown (Jones et al., 2018). Snowshoe hares are prey for many species in forests, so if their population numbers dwindle, so will their predators’ numbers making them keystone species and vital for the stability of their habitat (Oli et al., 2023).
5.7.3 Disease dynamics
Climate change’s influence on temperature and precipitation impacts the distribution and persistence of pathogen hosts and pathogen vectors. Warmer annual temperatures open Vermont to species expansions from historically lower latitudes, resulting in new vector and pathogen introductions. These expansions are particularly important for arthropod-borne viruses (i.e., arboviruses) and bird pathogens, as arthropods and birds have some of the greatest changes in population sizes, species ranges, and migratory behaviors. Pathogens that cause zoonotic diseases (i.e., diseases that can be transmitted from animals to people) are a concern for both humans and wildlife (see Human Health 10.6).
Warm temperatures can increase developmental speed and annual generation number for invertebrate pathogen vectors, potentially increasing population size (Buttke et al., 2021). Warmer temperatures and longer growing seasons can also increase the length of time pathogen vectors are active (Gilbert et al., 2014; Giles, 2024). Over the past three decades, the season in New England for Babesia, the tickborne pathogen that causes Babesiosis, has lengthened, and there has been a 1,602% increase in cases from 2011 to 2019 in Vermont (Pickrel et al., 2023; Ross et al., 2025). While white-tailed deer cannot be infected with tickborne pathogens like Borrelia burgdorferi (the causative agent of Lyme disease) and Babesia, deer are an important host for adult ticks. An increase in deer population (see 5.7.1) can thus also increase tick populations and number of tickborne pathogen infections (Centers for Disease Control and Prevention, 2025; Vermont Department of Health, 2025). Lone star ticks (Amblyomma americanum), the tick species that can transmit tularemia, ehrlichiosis, and Heartland virus, are not currently believed to have a stable population in Vermont (Molaei Goudarz et al., 2019; Vermont Department of Health, 2025). However, as white-tailed deer populations increase and Vermont winters become milder, the Center for Disease Control predicts that lone star ticks could be distributed in the southern half of the state in coming years (Centers for Disease Control and Prevention, 2025). In addition, another arbovirus-carrying tick could make its way to Vermont: the Asian longhorned tick (Haemaphysalis longicornis). In 2017–2018, the Asian longhorned tick was found in several eastern states, including New York (Beard et al., 2018). Warming conditions could make Vermont favorable for this introduced tick species in coming years (Okely et al., 2025).
In addition to hosting ticks and tickborne pathogens, white-tailed deer can also host arthropod pathogens, such as those transmitted through mosquitoes (Centers for Disease Control and Prevention, 2024). Vermont reported its first human case of the mosquito-borne pathogen Jamestown Canyon virus in September 2025 (Soucheray, 2025). Mosquitoes can also carry West Nile virus and Eastern Equine Encephalitis virus, which infect both humans and wildlife (Vermont Department of Health, 2023). The Asian tiger mosquito (Aedes albopictus) has a population in Windham County and can transmit Zika, dengue, and other viruses, though not all these pathogens are currently well-established in the contiguous United States. While the Asian tiger mosquito was likely introduced to Vermont through human transport rather than range expansion, a warming climate could mean an increasing or stable population (Rochlin et al., 2013). Vermont mosquito season typically lasts from April to October, but warmer transitional periods could extend this period (Futterman, 2023). As previously mentioned, increasing summer precipitation also leads to more standing water, which are breeding grounds for mosquitoes.
Climate change and extreme weather events impact the ecology and migration of birds and avian influenza (Prosser et al., 2023; Figure 5‑11). Migratory bird behavior can change due to temperature (Romano et al., 2022). One study found that migratory birds in the northeastern hemisphere shifted towards higher latitudes during winter and their breeding season (Tian et al., 2015). This changes what bird populations are found together and can increase H5N1 transmission, the most prominent strain of highly pathogenic avian influenza (HPAI). There are currently no cases of H5N1 in Vermont, but it has been detected in the state five times since 2022, with the most recent being in January 2025.
Warmer temperatures, shifting ranges, and environmental degradation can increase infectious disease risk for fish and wildlife. Wildlife diseases that threaten populations include ranavirus and chytridiomycosis in amphibians, WNS in bats, chronic wasting disease in deer, and meningeal parasites in moose. These infectious diseases can cause population decline, and declines may be exacerbated by the effects of a changing landscape and a changing climate.
As ranges shift, populations are exposed to novel pathogens and novel community compositions that can increase the spread of disease (Gallana et al., 2013). Thus, climate change can decrease biodiversity (Bellard et al., 2012) and simultaneously increase contact rates between viable and nonviable host animals (Daszak et al., 2001; Plowright et al., 2012). Increased contact expands the prevalence and transmission of infectious disease in less biodiverse communities with altered species composition. Even within the same species, climate change affects the geographic distribution of populations, potentially introducing diseases that are endemic in other populations to new ranges. For example, although chronic wasting disease has not been detected in Vermont yet, it has been detected in nearby Quebec and New York (Evans et al., 2024). Changing climate conditions will change how and where deer herds move, which could introduce chronic wasting disease to local populations, including wild and captive herds in Vermont (Rodenhouse et al., 2009).
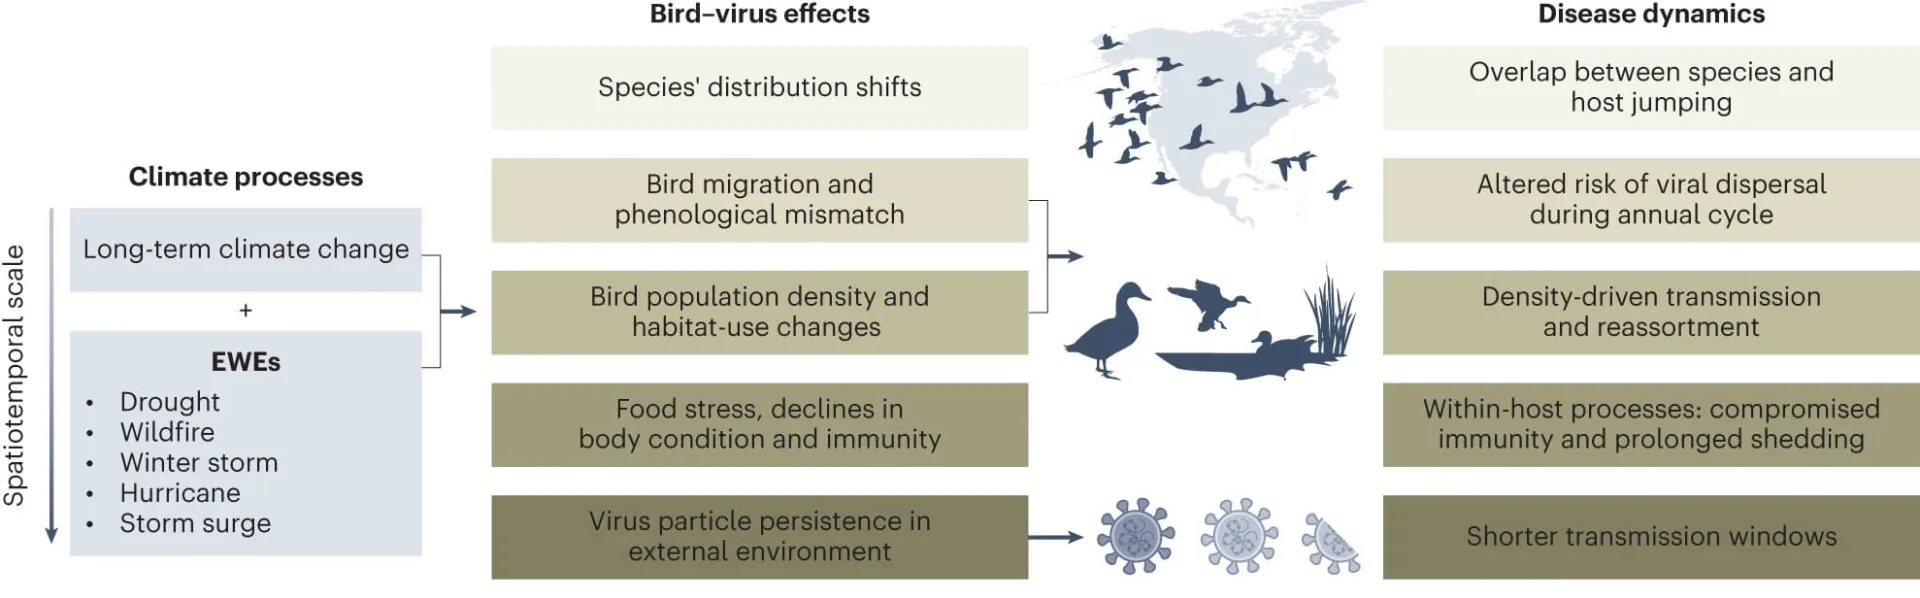
Source: Prosser et al. (2023)
Amphibians face potential population decline in part due to two emerging pathogens—chytridiomycosis, caused by the chytrid fungus (Batrachochytrium dendrobatidis), and ranavirus. Impacts of these diseases may be exacerbated by changing environmental conditions. For example, ranavirus is more harmful to frogs under heat stress (Price et al., 2019). With a predicted increase in rain-on-snow events (see Climate Change in Vermont 2.5.3), there may be increased salinity in wetlands and riparian habitats from road salt runoff, and high salinity worsens the effects of ranavirus (Albecker & McCoy, 2017).
Winter can be considered a protective factor for wildlife disease. Now, with less snowfall and warmer temperatures (see Climate Change in Vermont 2.4.3 and 2.5.3), there are new risks for Vermont animal populations. Less snow can mean more contact between deer and moose populations, increasing the transmission risk of meningeal parasites to moose (Rodenhouse et al., 2009). Cold winters directly kill disease vectors, such as ticks. Warmer winters are more energetically costly than cold winters to animals, which could reduce an individual’s ability to have a proper immune response to pathogens (Humphries et al., 2004). There is mixed evidence of how temperature interacts with some diseases due to the complexity of multiple interactions. Chytrid fungus in amphibians and WNS in bats both proliferate in cold temperatures, so warming winter temperatures may help prevent transmission (Flory et al., 2012). In Vermont, WNS caused widespread population declines when first introduced (Vermont Fish and Wildlife Department, 2026e). As WNS spread south from New York, even lower latitude populations in the southern part of the United States had large-scale declines, indicating that warmer winters likely will not meaningfully lower WNS rates (Flory et al., 2012; Leivers et al., 2025).
5.8 Climate-minded management strategies
To provide a framework to support and preserve the state’s biodiversity, the Vermont Legislature passed Act 59—the Community Resilience and Biodiversity Protection Act—in June 2023 (H.126, 2023). Also known as “30 by 30,” the framework aims to conserve 30% of Vermont lands by 2030 and 50% by 2050. By preserving a connected landscape of high-quality habitat for a variety of native species, biodiversity and ecosystem services can be maintained for future generations. While multiple adaptation and management strategies across scales and communities are required to minimize the effects of climate change, protected habitats help to ensure the resilience of Vermont wildlife populations and their ecosystems.
5.8.1 Co-benefits of climate mitigation and adaptation
Climate change mitigation and adaptation are necessary for a resilient Vermont. Mitigation strategies aim to reduce the progression of climate change (e.g., by reducing greenhouse gas emissions) whereas adaptation strategies aim to minimize the current and anticipated impacts of climate change. Examples of adaptation strategies that benefit people and biodiversity include wider culverts to prevent road washout during flooding and improve fish passage and movement, conservation of floodplains and wetlands as critical habitat for many species, and crop rotation to minimize soil degradation and maintain soil microbes. Climate change mitigation and adaptation directly and indirectly benefit communities through biodiversity conservation and preservation of ecosystem services. While some efforts can be expensive, they often have a multitude of valuable results when employed properly. Typically, conservation efforts are state- or federally-funded, and now new opportunities are opening in the nonprofit space, for example the Vermont Biodiversity Protection Fund from The Nature Conservancy.
Conserved land can provide habitat to wildlife, act as a carbon sink, and reduce the impacts of flooding. Conserved lands can also function as education centers, informing the public on the species that live there and the importance of wildlife habitat conservation. Climate change mitigation and adaptation benefits vary based on the type of ecosystem conserved. Conserving forests provides habitat for mammals, birds, insects, and plants and sequesters carbon. Conserving wetlands provides critical wildlife habitat, sequesters carbon in soil organic matter, promotes biodiversity, and filters water of nutrients and pollutants before they reach larger water bodies or groundwater pools. Riparian areas link terrestrial and aquatic habitats, provide habitats for animals that live in wetlands and vernal pools (Tinkers Creek Watershed Partners, 2016), slow water movement, help control floods and erosion, and mediate fluctuations in stream temperatures and streamflow (Bigman & Williams, 2021; Tinkers Creek Watershed Partners, 2016). Preserving multiple ecosystem types allows for the widest variety of benefits for wildlife and people.
Successful climate change adaptation efforts are already taking place in Vermont. A partnership through Vermont Audubon and Vermont Department of Forests, Parks, and Recreation called the “Foresters for Birds” project has developed silvicultural practices that maintain forest productivity, preserve critical bird habitat, and help offset climate change impacts (Climate Change Response Framework, 2024). The two sites at Mud Pond Forest in Greensboro and the Cold Hollow to Canada Woodlots region in Northern Vermont use a variety of tools to increase forest resilience, including introducing species that are predicted to fare better under future climate conditions and promoting variation in stand structure and age (see Forests 3.10.1). Results from this project are forthcoming, but preliminary results show an increase in gap-foraging birds in the Mud Pond Forest. Ongoing evaluation of this project will reveal how innovative silvicultural practices that increase forest resilience and benefit wildlife can be implemented across Vermont.
5.8.2 River restoration, fish habitat, and climate resilience
Climate change increases the risk of historic flooding events and the frequency and intensity of droughts, putting stress on ecosystems and threatening functionality. With two 100-year floods occurring in the past five years, substantial destruction occurred alongside streams, shorelines, and other habitats in Vermont. Strategic management of riparian ecosystems can mitigate this destruction. Floodplains slow water movement, reducing the likelihood of damage to homes and habitats, and they provide new habitat and new food sources for aquatic life after floods (Krupp & Giles, 2024; Lake Champlain Committee, 2024). In Northfield, Vermont, a five-acre floodplain lowered expected flood levels by six inches, highlighting how even relatively small amounts of preserved or protected floodplains can have an outsized impact on the surrounding area (Krupp & Giles, 2024).
A common method for flood mitigation, dredging, can end up doing more harm than good. Dredging (i.e., the removal of sediment from the bottom of water bodies) disrupts ecosystems by destroying habitats, releasing contaminants, and increasing turbidity. Dredging creates deeper river channels, allowing them to carry a larger volume of water and increasing streamflow during a flooding event. Fast streamflow can cause more erosion along streambanks (Caduto, 2024; see Water Resources 4.4.4). Dredging also removes shelter and habitats used by fish thereby exposing them and making them more vulnerable to predators. The channel's bottom is flattened and widened, which results in shallow areas that allow water to warm quickly. Warmer water temperatures make those areas of rivers uninhabitable for many aquatic species (Blair, 2024). Un-dredged waterways often feature rocks and trees or shrubs, that provide habitat for aquatic organisms and slow down water flow thereby minimizing flooding impacts and benefiting stream biodiversity. A great example of river restoration in Vermont is the “Strategic Wood Addition” initiative by Vermont Department of Fish and Wildlife, which focuses on adding large woody debris to steams to restore important habitat for trout since 2011(Kratzer, 2021). As of 2024, approximately 50 miles of stream habitat have been improved, contributing to an increase of 60,000 book trout in northeastern Vermont since the start of the initiative (Vermont Fish and Wildlife Department, 2024a).
Large culverts are another important adaptation measure for decreasing flood effects and improving fish passage and mobility (see Infrastructure 7.3). Larger culverts allow more water to pass under roads and thus allow fish and other aquatic species to have access to wider habitat, minimizing habitat fragmentation (2025 Lake Champlain Action Plan, 2025). Of Vermont culverts spanning perennial rivers, 58.6% of culverts significantly restrict streamflow, and 34.6% provide very little to no passage for aquatic organisms. Increasing culvert size and ensuring proper placement can allow for adequate water flow and better aquatic organism passage, promoting connectivity between habitats (Mazzacavallo, 2024). A best management practice recommends that culverts are 1.2 times the size of the stream width, which will ensure culverts have adequate water-carrying capacity and facilitate aquatic organism passage (see Infrastructure 7.3.1).
5.9 Traceable accounts
5.11 References
Albecker, M. A., & McCoy, M. W. (2017). Adaptive responses to salinity stress across multiple life stages in anuran amphibians. Frontiers in Zoology, 14(1), 40. https://doi.org/10.1186/s12983-017-0222-0
Aldrich, B. (2024, March 7). Forestry Friday: Fairy Shrimp: The Sea Monkeys of Vernal Pools. Forest Society. https://www.forestsociety.org/blog-post/forestry-friday-fairy-shrimp-sea-monkeys-vernal-pools
Audubon. (2026a). Black-backed Woodpecker. https://www.audubon.org/field-guide/bird/black-backed-woodpecker
Audubon. (2026b). How Climate Change Will Affect Birds in Vermont. https://www.audubon.org/climate/survivalbydegrees/state/us/vt
Audubon. (2026c). Spruce Grouse. https://www.audubon.org/field-guide/bird/spruce-grouse?adm1=VT&country=US#bird-climate-vulnerability
Aylward, C. M., Murdoch, J. D., & Kilpatrick, C. W. (2020). Multiscale landscape genetics of American marten at their southern range periphery. Heredity, 124(4), 550–561. https://doi.org/10.1038/s41437-020-0295-y
Bauder, E. T. (2005). The effects of an unpredictable precipitation regime on vernal pool hydrology. Freshwater Biology, 50(12), 2129–2135. https://doi.org/https://doi.org/10.1111/j.1365-2427.2005.01471.x
Beard, C. B., Occi, J., & Bonilla, D. L. (2018). Multistate Infestation with the Exotic Disease–Vector Tick Haemaphysalis longicornis—United States, August 2017–September 2018. MMWR and Morbidity and Mortality Weekly Report, 67, 1310–1313. https://doi.org/http://dx.doi.org/10.15585/mmwr.mm6747a3
Bellard, C., Bertelsmeier, C., Leadley, P., Thuiller, W., & Courchamp, F. (2012). Impacts of climate change on the future of biodiversity. Ecology Letters, 15(4), 365–377. https://doi.org/10.1111/j.1461-0248.2011.01736.x
Bigman, M., & Williams. (2021). Riparian Restoration Experiment in Vermont. U.S. Fish and Wildlife Service, CART. https://www.fws.gov/project/riparian-restoration-experiment-vermont
Blair, J. (2024, April 18). Understanding Dredging and Other River Management Options. Sea Grant Lake Champlain. https://www.uvm.edu/seagrant/2024/04/18/understanding-dredging-and-other-river-management-options/
Briggs, K. (2023, January 4). Mudpuppies: The Winter Salamander. The Orianne Society. https://www.oriannesociety.org/faces-of-the-forest/mudpuppies-winter-salamander/?v=f69b47f43ce4#:~:text=Mudpuppies%2C%20large%2….
Brooks, R. T. (2004). Weather-related effects on woodland vernal pool hydrology and hydroperiod. Wetlands, 24, 104–114. https://doi.org/https://doi.org/10.1672/0277-5212(2004)024[0104:WEOWVP]2.0.CO;2
Brown, N. P., Shields, R. J., & Bromage, N. R. (2006). The influence of water temperature on spawning patterns and egg quality in the Atlantic halibut (Hippoglossus hippoglossus L.). Aquaculture, 261(3), 993–1002. https://doi.org/10.1016/j.aquaculture.2006.08.025
Brown, T. G., Runciman, B., Bradford, M. J., & Pollard, S. (2009). A Biological Synopsis of Yellow Perch (Perca flavescens). 2883(28). https://publications.gc.ca/collections/collection_2010/mpo-dfo/Fs97-4-2883-eng.pdf
Brungs, W. A. (1973). Effects of Residual Chlorine on Aquatic Life. Journal (Water Pollution Control Federation), 45(10), 2180–2193. JSTOR. https://doi.org/https://www.jstor.org/stable/25038016
Buck, J. (2021). Searching for Spruce Grouse. Estuary. https://estuarymagazine.com/searching-for-spruce-grouse/
Buckman, K. L., Seelen, E. A., Mason, R. P., Balcom, P., Taylor, V. F., Ward, J. E., & Chen, C. Y. (2019). Sediment organic carbon and temperature effects on methylmercury concentration: A mesocosm experiment. The Science of the Total Environment, 666(1316–1326). https://pmc.ncbi.nlm.nih.gov/articles/PMC6461384/
Bukaveckas, P. A., Buikema, L., & Stewart, C. (2023). Effects of climate change and variability on thermal regime and dissolved oxygen resources of oligotrophic lakes in the Adirondack Mountain region. Aquatic Sciences, 86(1), 9. https://doi.org/10.1007/s00027-023-01021-2
Burgess, A. K. (2026). Spotted Turtle. Vermont Herp Atlas. https://www.vtherpatlas.org/herp-species-in-vermont/clemmys-guttata/
Buttke, D., Wild, M., Monello, R., Schuurman, G., Hahn, M., & Jackson, K. (2021). Managing Wildlife Disease Under Climate Change. EcoHealth, 18(4), 406–410. https://doi.org/10.1007/s10393-021-01542-y
Caduto, M. J. (2024, June 10). How Severe Flooding Impacts Aquatic Life. Northern Woodlands. https://northernwoodlands.org/outside_story/article/flooding-aquatic-life
California Department of Fish and Wildlife. (2026). Quagga / Zebra Mussel Fact Sheet. https://wildlife.ca.gov/Conservation/Invasives/Mussels/Mobile/Fact-Sheet
California State Water Resources Board. (2026). Sediment Fact Sheet. https://www.waterboards.ca.gov/water_issues/programs/swamp/docs/cwt/guidance/3610.pdf
Carroll, C. (2007). Interacting Effects of Climate Change, Landscape Conversion, and Harvest on Carnivore Populations at the Range Margin: Marten and Lynx in the Northern Appalachians. Conservation Biology, 21(4), 1092–1104. https://doi.org/https://doi.org/10.1111/j.1523-1739.2007.00719.x
Centers for Disease Control and Prevention. (2024, May 15). About Jamestown Canyon. https://www.cdc.gov/jamestown-canyon/about/index.html
Centers for Disease Control and Prevention. (2025, July 30). Lone Star Tick Surveillance. https://www.cdc.gov/ticks/data-research/facts-stats/lone-star-tick-surveillance.html
Childress, E. S., Demarest, E. D., Wofford, J. E. B., Hitt, N. P., & Letcher, B. H. (2024). Strong variation in Brook Trout trends across geology, elevation, and stream size in Shenandoah National Park. Transactions of the American Fisheries Society, 153(2), 250–263. https://doi.org/10.1002/tafs.10460
Clark, A. (2013, June 24). Climate change threatens migratory birds and bird-dependent economy, NWF warns. VT Digger. https://vtdigger.org/2013/06/24/climate-change-birds/
Clean Lakes Alliance. (2026). Lake Turnover. https://www.cleanlakesalliance.org/lake-turnover/
Climate Adaptation Science Centers. (2017, February 10). When Timing is Everything: Migratory Bird Phenology in a Changing Climate. USGS. https://www.usgs.gov/news/when-timing-everything-migratory-bird-phenology-changing-climate
Climate Central. (2019, June 26). Warming Waters and Fish. https://www.climatecentral.org/climate-matters/warming-waters-and-fish
Climate Change Response Framework. (2024, July 9). Audubon Vermont: Protecting Forest Bird Habitats in a Changing Climate. https://forestadaptation.org/adapt/demonstration-projects/audubon-vermont-protecting-forest-bird-habitats-changing-climate
Cohen, J. M., Sauer, E. L., Santiago, O., Spencer, S., & Rohr, J. R. (2020). Divergent impacts of warming weather on wildlife disease risk across climates. Science, 370(6519), eabb1702. https://doi.org/10.1126/science.abb1702
Colorado Parks and Wildlife. (2026). Zebra and Quagga Mussels. https://cpw.state.co.us/species/zebra-and-quagga-mussels
Commonwealth of Pennsylvania. (2026). Agrilus planipennis (Emerald Ash Borer). https://www.pa.gov/agencies/dcnr/conservation/forests-and-tree/insects-and-diseases/emerald-ash-borer
Consol, G. (2025, September 16). Streamflows reach record lows as drought worsens. WCAX. https://www.wcax.com/2025/09/16/low-streamflow-plagues-new-england-severe-drought-worsens/
Cornell Lab of Ornithology. (2026). Eastern Bluebird. CornellLab. https://www.allaboutbirds.org/guide/Eastern_Bluebird/overview
Daszak, P., Cunningham, A. A., & Hyatt, A. D. (2001). Anthropogenic environmental change and the emergence of infectious diseases in wildlife. Acta Tropica, 78(2), 103–116. https://doi.org/10.1016/S0001-706X(00)00179-0
DeCesare, N. J., Harris, R. B., Atwood, M. P., Bergman, E. J., Courtemanch, A. B., Cross, P. C., Fralick, G. L., Hersey, K. R., Hurley, M. A., Koser, T. M., Levine, R. L., Monteith, K. L., Newby, J. R., Peterson, C. J., Robertson, S., & Wise, B. L. (2024). Warm places, warm years, and warm seasons increase parasitizing of moose by winter ticks. Ecosphere, 15(3). https://esajournals.onlinelibrary.wiley.com/doi/full/10.1002/ecs2.4799
DeLuca, W. V., & King, D. I. (2017). Montane birds shift downslope despite recent warming in the northern Appalachian Mountains. Journal of Ornithology, 158(2), 493–505. https://doi.org/10.1007/s10336-016-1414-7
DeSantis, R. D., Moser, W. K., Gormanson, D. D., Bartlett, M. G., & Vermunt, B. (2013). Effects of climate on emerald ash borer mortality and the potential for ash survival in North America. Special Issue:Drought Inner Asia, 178–179, 120–128. https://doi.org/10.1016/j.agrformet.2013.04.015
Dockser, C. (2024, July 3). MAP: Emerald ash borer is now killing trees in at least 68 Vermont towns. Vermont Public. https://www.vermontpublic.org/local-news/2024-07-03/map-emerald-ash-borer-is-now-killing-trees-in-at-least-68-vermont-towns
Eldridge, W. (2021, March 10). Fish Grow on Trees Communicating the importance of forested riparian areas for Brook Trout. Riparian Buffer Practioners’ Meeting, Virtual. https://www.uvm.edu/seagrant/sites/default/files/uploads/VFWD%20Riparian%20Day%202%20Fish%20Grow%20on%20Trees..pdf
Emmons, L. (2020, August 6). Red-Bellied Woodpeckers Make The Move North into Vermont. The Herald. https://www.ourherald.com/articles/red-bellied-woodpeckers-make-the-move-north-into-vermont/
Environmental Protection Agency. (2025, July 14). EnviroAtlas: Changes over time. https://www.epa.gov/enviroatlas/changes-over-time
Environmental Protection Agency. (2026). Mercury Emissions: The Global Context. https://www.epa.gov/international-cooperation/mercury-emissions-global-context
Espínola, L. A., Simōes, N. R., Rabuffetti, A. P., Contreras, F. I., Saucedo, G. I., Abrial, E., Garelo, N., Stachiotti, L., Baigún, C. R. M., Blettler, M. C. M., & Santos, L. N. (2025). Impact of Extreme Droughts on Fish Assemblages in a Large South American Floodplain River. Ecohydrology, 18(5), e70062. https://doi.org/10.1002/eco.70062
Evans, T. S., Schuler, K. L., & Walter, W. D. (2024). Surveillance and Monitoring of White-Tailed Deer for Chronic Wasting Disease in the Northeastern United States. Journal of Fish and Wildlife Management, 5(2), 387–393. https://doi.org/https://doi.org/10.3996/032014-JFWM-021
Evers, D. C., Savoy, L. J., DeSorbo, C. R., Yates, D. E., Hanson, W., Taylor, K. M., Siegel, L. S., Cooley, J. H., Bank, M. S., Major, A., Munney, K., Mower, B. F., Vogel, H. S., Schoch, N., Pokras, M., Goodale, M. W., & Fair, J. (2008). Adverse effects from environmental mercury loads on breeding common loons. Ecotoxicology, 17(2), 69–81. https://doi.org/10.1007/s10646-007-0168-7
Faccio, S. D., Buckman, K. L., Lloyd, J. D., Curtis, A. N., & Taylor, V. F. (2019). Bioaccumulation of methylmercury in wood frogs and spotted salamanders in Vermont vernal pools. Ecotoxicology, 28(7), 717–731. https://doi.org/10.1007/s10646-019-02068-4
Fafard, P. (2018, May 16). How and Why Lakes Stratify and Turn Over: We explain the science behind the phenomena. IISD Experimental Lakes Area. https://www.iisd.org/ela/blog/lakes-stratify-turn-explain-science-behind-phenomena/
Finno, A., & Oliver, C. (2025a, September 28). Vermont’s drought is straining communities and leading residents to suffer. VT Digger. https://vtdigger.org/2025/09/28/vermonts-drought-is-straining-communities-and-leading-residents-to-suffer/
Finno, A., & Oliver, C. (2025b, September 28). Vermont’s drought is straining communities and leading residents to suffer. VT Digger. https://vtdigger.org/2025/09/28/vermonts-drought-is-straining-communities-and-leading-residents-to-suffer/
Fischer, J. R., Bakevich, B. D., Shea, C. P., Pierce, C. L., & Quist, M. C. (2018). Floods, drying, habitat connectivity, and fish occupancy dynamics in restored and unrestored oxbows of West Central Iowa, USA. Aquatic Conservation: Marine and Freshwater Ecosystems, 28(3), 630–640. https://doi.org/10.1002/aqc.2896
Fisher, L., Mears, D., Urferr, K., O’Neill, J., Frankel, E., Hierl, L., & Groveman, J. (2021, October 25). Wetlands are a Nature-Based Solution to Climate Change Op-Ed. Lake Champlain Committee. https://www.lakechamplaincommittee.org/learn/news/item/wetlands-are-a-nature-based-solution-to-climate-change-op-ed
Flory, A. R., Kumar, S., Stohlgren, T. J., & Cryan, P. M. (2012). Environmental conditions associated with bat white-nose syndrome mortality in the north-eastern United States. Journal of Applied Ecology, 49(3), 680–689. https://doi.org/https://doi.org/10.1111/j.1365-2664.2012.02129.x
Forrest, J. R. (2016). Complex responses of insect phenology to climate change. Current Opinion in Insect Science, 17, 49–54. https://doi.org/10.1016/j.cois.2016.07.002
Frankham, R. (2005). Genetics and extinction. Biological Conservation, 126(2), 131–140. https://doi.org/10.1016/j.biocon.2005.05.002
Fuller, P., Maynard, E., Larson, J., Fusaro, A., Makled, T. H., Neilson, M., & Bartos, A. (2020, September 25). Osmerus mordax (Mitchill, 1814). U.S. Geological Survey, Nonindigenous Aquatic Species Database. https://nas.er.usgs.gov/queries/factsheet.aspx?SpeciesID=796#:~:text=Rainbow%20Smelt%20can%20survive%20in,2019).
Futterman, K. (2023, August 7). The Buzz: Mosquitoes Are Prolific This Year in Vermont. Seven Days. https://www.sevendaysvt.com/news/the-buzz-mosquitoes-are-prolific-this-year-in-vermont-38836526/
Gagliano, M., McCormick, M. I., & Meekan, M. G. (2007). Temperature-induced shifts in selective pressure at a critical developmental transition. Oecologia, 152(2), 219–225. https://doi.org/10.1007/s00442-006-0647-1
Gaiss, K. (2021, September 9). A warming Vermont gives way to more invasive species. WCAX. https://www.wcax.com/2021/09/09/warming-vermont-gives-way-more-pests/
Galford, G. L., Faulkner, J., Dupigny-Giroux, L.-A., Posner, S., & Edling, L. (2021). The Vermont Climate Assessment 2020. Gund Institute of Environment University of Vermont. https://site.uvm.edu/vtclimateassessment/files/2022/08/VCA-entire-8-3-22-web.pdf
Gallana, M., Ryser-Degiorgis, M.-P., Wahli, T., & Segner, H. (2013). Climate change and infectious diseases of wildlife: Altered interactions between pathogens, vectors and hosts. Current Zoology, 59(3), 427–437. https://doi.org/https://doi.org/10.1093/czoolo/59.3.427
Gilbert, L., Aungier, J., & Tomkins, J. L. (2014). Climate of origin affects tick (Ixodes ricinus) host-seeking behavior in response to temperature: Implications for resilience to climate change? Ecology and Evolution, 4(7), 1186–1198. https://doi.org/https://doi.org/10.1002/ece3.1014
Giles, A. (2024, June 28). Climate change is bringing more ticks and tick-borne disease to Vermont. But it’s not the full story. Vermont Public. https://www.vermontpublic.org/local-news/2024-06-28/climate-change-more-ticks-tick-borne-disease
Goulson, D., Nicholls, E., Botías, C., & Rotheray, E. L. (2015). Bee declines driven by combined stress from parasites, pesticides, and lack of flowers. Science, 347(6229), 1255957. https://doi.org/10.1126/science.1255957
Gupta, A., Carroll, R. W. H., & McKenna, S. A. (2023). Changes in streamflow statistical structure across the United States due to recent climate change. Journal of Hydrology, 620, 129474. https://doi.org/10.1016/j.jhydrol.2023.129474
H.126 (Act 59), General Assembly of the State of Vermont (2023). https://legislature.vermont.gov/bill/status/2024/H.126
Hahn, D. A., & Denlinger, D. L. (2011). Energetics of Insect Diapause. Annual Review of Entomology, 56, 103–121. https://doi.org/https://doi.org/10.1146/annurev-ento-112408-085436
Hallenbeck, B. (2022, January 4). Weather trend for 2021 in Burlington area was warm and dry, National Weather Service says. Burlington Free Press. https://www.burlingtonfreepress.com/story/news/2022/01/04/burlington-vermont-area-weather-2021-warm-dry/9077249002/
Hallworth, M., McFarland, K., Hardy, S., Sharp, N., Anderson, E., & Loomis, J. (2023). 10th Anniversary Vermont Atlas of Life Report. Vermont Center for Ecostudies. https://val.vtecostudies.org/wp-content/uploads/2023/06/VAL-10th-Anniversary-State-of-Biodiversity-Report.pdf
Hardy, S., Hallworth, M. T., Ferguson, M., Sharp, N., Loomis, J., Anderson, E., & McFarland, K. (2022). State of Vermont’s Wild Bees. Vermont Center for Ecostudies. https://threats.stateofbees.vtatlasoflife.org/
Hardy, S. P., Veit, M., Milam, J., Ascher, J. S., Sharp, N., Hallworth, M. T., Ferguson, M., Richardson, L., Nicholson, C., Ricketts, T. H., Gibbs, J., & McFarland, K. P. (2025). An Annotated Checklist of the Bees (Hymenoptera: Apoidea) of Vermont with Conservation Status and Natural History Notes. Northeastern Naturalist, 32(mo27), 1–76. https://doi.org/10.1656/045.032.m2701
Harsimran, K. G., Goyal, G., & Chahil, G. (2017). Insect Diapause: A Review. Journal of Agricultural Science and Technology. https://davidpublisher.com/Public/uploads/Contribute/5a5c6c5a389c3.pdf
Hatfield, R., Jepsen, S., Thorp, R., Richardson, L., Colla, S., Foltz Jordan, S., & Evans, E. (2015). Rusty patched bumble bee (E. T44937399A46440196). IUCN. https://doi.org/10.2305/IUCN.UK.2015-2.RLTS.T44937399A46440196.en
Hauser, M., & Lynch, M. (2007, January). Zebra Mussel & Quagga Mussel. Lake Champlain Basin Program. https:/www.lcbp.org/wp-content/uploads/2013/03/Zebra2007.pdf
Hill, J. M., & Williams, D. M. (2024). The State of the Mountain Birds Report: Northeast 2024. Vermont Center for Ecostudies. https://mountainbirds.vtecostudies.org/birds/bicknells-thrush/
Hoegh-Guldberg, O., Jacob, D., Taylor, M., Bindi, M., Brown, S., Camilloni, I., Diedhiou, A., Djalante, R., Ebi, K. L., Engelbrecht, F., Guiot, J., Hijioka, Y., Mehrotra, S., Payne, A., Seneviratne, S. I., Thomas, A., Warren, R., & Zhou, G. (2018). Impacts of 1.5oC Global Warming on Natural and Human Systems. In Global Warming of 1.5°C. An IPCC Special Report on the impacts of global warming of 1.5°C above pre-industrial levels and related global greenhouse gas emission pathways, in the context of strengthening the global response to the threat of climate change, sustainable development, and efforts to eradicate poverty (pp. 175–312). Cambridge University Press. https://doi.org/10.1017/9781009157940
Hopkins, W. A. (2007). Amphibians as Models for Studying Environmental Change. ILAR Journal, 48(3), 270–277. https://doi.org/10.1093/ilar.48.3.270
Humphries, M. M., Umbanhowar, J., & McCann, K. S. (2004). Bioenergetic Prediction of Climate Change Impacts on Northern Mammals. Integrative and Comparative Biology, 44(2), 152–162. https://doi.org/https://doi.org/10.1093/icb/44.2.152
Jane, S. F., Mincer, J. L., Lau, M. P., Lewis, A. S. L., Stelter, J. T., & Rose, K. C. (2022). Longer duration of seasonal stratification contributes to widespread increases in lake hypoxia and anoxia. Global Change Biology, 29(4). https://doi.org/https://doi.org/10.1111/gcb.16525
Jansen, J., & Gabrielsen, P. (2025, September 15). How climate change alters lake oxygen levels [Interview]. https://www.pnas.org/post/podcast/climate-change-alters-lake-oxygen-levels
Janzen, F. J. (1994). Climate change and temperature-dependent sex determination in reptiles. Proceedings of the National Academy of Sciences, 91(16), 7487–7490. https://doi.org/10.1073/pnas.91.16.7487
Jeong, H., Ali, W., Zinck, P., Souissi, S., & Lee, J.-S. (2024). Toxicity of methylmercury in aquatic organisms and interaction with environmental factors and coexisting pollutants: A review. Science of The Total Environment, 943, 173574. https://doi.org/10.1016/j.scitotenv.2024.173574
Jones, M. R., Mills, L. S., Alves, P. C., Callahan, C. M., Alves, J. M., Lafferty, D. J. R., Jiggins, F. M., Jensen, J. D., Melo-Ferreira, J., & Good, J. M. (2018). Adaptive introgression underlies polymorphic seasonal camouflage in snowshoe hares. Science, 360(6395), 1355–1358. https://doi.org/10.1126/science.aar5273
Jordan, M. P., Stewart, A. R., Eagles-Smith, C. A., & Strecker, A. L. (2019). Nutrients mediate the effects of temperature on methylmercury concentrations in freshwater zooplankton. Science of The Total Environment, 667, 601–612. https://doi.org/10.1016/j.scitotenv.2019.02.259
Keena, M. A., Hamilton, G., & Kreitman, D. (2023). The potential climatic range of spotted lanternfly may be broader than previously predicted. Inscect Science, 3. https://www.frontiersin.org/journals/insect-science/articles/10.3389/finsc.2023.1092189/full
Kellermann, V., & van Heerwaarden, B. (2019). Terrestrial insects and climate change: Adaptive responses in key traits. Physiological Entomology, 44(2), 99–115. https://doi.org/10.1111/phen.12282
Kifner, L., & Eakin, C. (2026). Why is there Mercury in that Vernal Pool? Of Pools and People. https://www.vernalpools.me/why-is-there-mercury-in-that-vernal-pool/
Kingsolver, J. G., Arthur Woods, H., Buckley, L. B., Potter, K. A., MacLean, H. J., & Higgins, J. K. (2011). Complex Life Cycles and the Responses of Insects to Climate Change. Integrative and Comparative Biology, 51(5), 719–732. https://doi.org/10.1093/icb/icr015
Kotalik, C. J., Willacker, J. J., Wesner, J. S., Johnson, B. L., Flanagan Pritz, C. M., Nelson, S. J., Walters, D. M., & Eagles-Smith, C. A. (2025). Ecosystem Drivers of Freshwater Mercury Bioaccumulation Are Context-Dependent: Insights from Continental-Scale Modeling. Environmental Science & Technology, 59(3), 1780–1789. https://doi.org/10.1021/acs.est.4c07280
Krivek, G., Meier, F., Grosche, L., Kerth, G., & van Schaik, J. (2025). One Species Hibernates Shorter, the Other Longer: Rapid but Opposing Responses to Warming Climate in Two Sympatric Bat Species. Global Change Biology, 31. https://pmc.ncbi.nlm.nih.gov/articles/PMC12491832/#gcb70531-sec-0001
Krupp, L., & Giles, A. (2024, August 2). Dredging makes flooding more dangerous—But sometimes it’s the only option. Vermont Public. https://www.vermontpublic.org/local-news/2024-08-02/dredging-makes-flooding-more-dangerous-sometimes-only-option
Kudo, G., & Cooper, E. J. (2019). When spring ephemerals fail to meet pollinators: Mechanism of phenological mismatch and its impact on plant reproduction. Proceedings of the Royal Society B: Biological Sciences, 286(1904), 20190573. https://doi.org/10.1098/rspb.2019.0573
Kudo, G., & Ida, T. Y. (2013). Early onset of spring increases the phenological mismatch between plants and pollinators. Ecology,94(10), 2311–2320. https://doi.org/https://doi.org/10.1890/12-2003.1
Lake Champlain Basin Program. (2024). 2024 Lake Champlain State of the Lake and Ecosystem Indicators Report. Lake Champlain Basin Program. https://www.lcbp.org/wp-content/uploads/2024/06/2024-State-of-the-Lake-Report.pdf
Lake Champlain Basin Program. (2025, January 3). New research on winter nutrient loading fills important data gaps for Lake Champlain. https://www.lcbp.org/2025/01/new-research-on-winter-nutrient-loading-fills-important-data-gaps-for-lake-champlain/
Lake Champlain Basin Program. (2026a). Fish and Wildlife. https://www.lcbp.org/our-goals/healthy-ecosystems/biodiversity/fish-and-wildlife/
Lake Champlain Basin Program. (2026b). Wetlands. https://www.lcbp.org/our-goals/healthy-ecosystems/habitat/wetlands/
Lake Champlain Committee. (2024). How the Floods of 2023 Affected Fish. https://www.lakechamplaincommittee.org/learn/lake-look/how-the-floods-of-2023-affected-fish
Lake Champlain Committee. (2025, December). December 2025 Lake Look. https://www.lakechamplaincommittee.org/learn/lake-look/dont-move-a-mussel-the-growing-threat-of-invasives-from-zebra-to-quagga
Lake James Environmental Association. (2018). Importance of Erosion and Sedimentation to Water Quality. https://www.ljea.org/2018-state-lake-james-watershed/erosion-and-sedimentation/importance-erosion-and-sedimentation-water-quali…
Lee, D.-H., Park, Y.-L., & Leskey, T. C. (2019). A review of biology and management of Lycorma delicatula (Hemiptera: Fulgoridae), an emerging global invasive species. Journal of Asia-Pacific Entomology, 22(2), 589–596. https://doi.org/10.1016/j.aspen.2019.03.004
Leivers, S. J., Evans, J. W., Moreno, M. R., Buckel, A. J., & Fuller, N. W. (2025). WHITE NOSE SYNDROME IMPACTS ON MYOTIS VELIFER POPULATIONS IN CENTRAL TEXAS. The Southwestern Naturalist, 69(4), 1–7. https://doi.org/10.1894/0038-4909-69.4.12
Lin, H., Brown, C. J., Dwyer, R. G., Harding, D. J., Roberts, D. T., Fuller, R. A., Linke, S., & Possingham, H. P. (2018). Impacts of fishing, river flow and connectivity loss on the conservation of a migratory fish population. Aquatic Conservation: Marine and Freshwater Ecosystems, 28(1), 45–54. https://doi.org/10.1002/aqc.2831
Liu, J., Kyle, C., Wang, J., Kotamarthi, R., Koval, W., Dukic, V., & Dwyer, G. (2025). Climate change drives reduced biocontrol of the invasive spongy moth. Nature Climate Change, 15(2), 210–217. https://doi.org/10.1038/s41558-024-02204-x
Loon Preservation Committee. (2026). Loons as Biomonitors. https://loon.org/lpc-work/research/loons-as-biomonitors/
Malinak, E. (2024, July 25). As Vermont loses its ash trees, towns race to stop the beetle that’s the culprit. VT Digger. https://vtdigger.org/2024/07/25/as-vermont-loses-its-ash-trees-towns-race-to-stop-the-beetle-thats-the-culprit/
Mamantov, M. A., Gibson-Reinemer, D. K., Linck, E. B., & Sheldon, K. S. (2021). Climate-driven range shifts of montane species vary with elevation. Global Ecology and Biogeography, 30(4), 784–794. https://doi.org/https://doi.org/10.1111/geb.13246
Mansberger, J. (2023, October 27). Environmental Hazards of Road Salt. PennState Extension. https://extension.psu.edu/environmental-hazards-of-road-salt
Mantyka-Pringle, C. S., Visconti, P., Di Marco, M., Martin, T. G., Rondinini, C., & Rhodes, J. R. (2015). Climate change modifies risk of global biodiversity loss due to land-cover change. Biological Conservation, 187, 103–111. https://doi.org/10.1016/j.biocon.2015.04.016
Mazzacavallo, M. (2024). Better Culverts are Fish Friendly. Alaska Department of Fish and Game. https://www.adfg.alaska.gov/index.cfm?adfg=wildlifenews.view_article&articles_id=1090
McCallum, H., & Dobson, A. (2002). Disease, habitat fragmentation and conservation. Proceedings of the Royal Society B: Biological Sciences, 269(1504), 2041–2049. https://doi.org/10.1098/rspb.2002.2079
McElwee, P. D., Carter, S. L., Hyde, K. J. W., West, J. M., Akamani, K., Babson, A. L., Bowser, G., Bradford, J. B., Costanza, J. K., Crimmins, T. M., Goslee, S. C., Hamilton, S. K., Helmuth, B., Hoagland, S., Hoover, F.-A. E., Hunsicker, M. E., Kashuba, R., Moore, S. A., Muñoz, R. C., … Wilkening, J. L. (2023). Chapter 8: Ecosystems, Ecosystem Services, and Biodiversity. Fifth National Climate Assessment (A. R. Crimmins, C. W. Avery, D. R. Easterling, K. E. Kunkel, B. C. Stewart, & T. K. Maycock, Eds.). U.S. Global Change Research Program. https://nca5.climate.us/chapter/8
McFarland, K. (2025, August 28). New Butterfly Species Discovered for Vermont. Vermont Center for Ecostudies. https://val.vtecostudies.org/newsfeed/new-butterfly-species-discovered-for-vermont/
McFarland, K., & Zahendra, S. (2013). Vermont Butterfly Survey 2002-2007. 0 Bytes. https://doi.org/10.6084/M9.FIGSHARE.827269.V1
McGuire, P. (2025, August 10). Birds are changing their ranges in response to warming climate. New Hampshire Public Radio. https://www.nhpr.org/2025-04-10/birds-are-changing-their-ranges-in-response-to-warming-climate
Miller-Rushing, A. J., & Primack, R. B. (2008). Global Warming and Flowering Times in Thoreau’s Concord: A Community Perspective. Ecology, 89(2), 332–341. https://doi.org/10.1890/07-0068.1
Mills, L. S., Soulé, M. E., & Doak, D. F. (1993). The Keystone-Species Concept in Ecology and Conservation. BioScience, 43(4), 219–224. JSTOR. https://doi.org/10.2307/1312122
Miron, J., Millward, A. A., Vaziriyehaneh, M., Zwiazek, J. J., & Urban, J. (2022). Winter Climate Variability, De-Icing Salt and Streetside Tree Vitality. Frontiers in Ecology and Evolution, 10. https://doi.org/https://doi.org/10.3389/fevo.2022.749168
Missouri Department of Conservation. (2026). Spongy Moth and Missouri. https://mdc.mo.gov/wildlife/invasive-animals/spongy-moth-missouri
Missouri Department of Natural Resources. (2026). Chloride. https://dnr.mo.gov/water/hows-water/pollutants-sources/chloride
Molaei Goudarz, Little Eliza A.H., Williams Scott C., & Stafford Kirby C. (2019). Bracing for the Worst—Range Expansion of the Lone Star Tick in the Northeastern United States. New England Journal of Medicine, 381(23), 2189–2192. https://doi.org/10.1056/NEJMp1911661
Montrone, A., Saito, L., Weisberg, P. J., Gosejohan, M., Merriam, K., & Mejia, J. F. (2019). Climate change impacts on vernal pool hydrology and vegetation in northern California. Journal of Hydrology, 574, 1003–1013. https://doi.org/10.1016/j.jhydrol.2019.04.076
Moore, M. P., Shaich, J., & Stroud, J. T. (2023). Upslope migration is slower in insects that depend on metabolically demanding flight. Nature Climate Change, 13(10), 1063–1066. https://doi.org/10.1038/s41558-023-01794-2
Morelli, T. L., Hallworth, M. T., Duclos, T., Ells, A., Faccio, S. D., Foster, J. R., McFarland, K. P., Nislow, K., Ralston, J., Ratnaswamy, M., Deluca, W. V., & Siren, A. P. K. (2025). Does habitat or climate change drive species range shifts? Ecography, 2025(6), e07560. https://doi.org/10.1111/ecog.07560
National Park Service. (2018). Citizen Scientists Help Track America’s Rarest Thrush. https://www.nps.gov/articles/citizen-scientists-help-track-america-s-rarest-thrush.htm
Neves, M. O., Broennimann, O., Mod, H. K., Bolochio, B. E., Santana, D. J., Guisan, A., & Moura, M. R. (2025). Climate change threatens amphibians and species representation within protected areas in tropical wetlands. The Journal of Applied Ecology, 62(2), 290–302. https://doi.org/https://doi.org/10.1111/1365-2664.14846
New England Water Science Center & United States Geological Survey. (2025, September 18). “Extreme Drought” Hits Northern New England States. https://www.usgs.gov/centers/new-england-water-science-center/news/extreme-drought-hits-northern-new-england-states
New Hampshire Department of Environmental Services. (2019). Mercury: Sources, Transport, Deposition and Impacts. https://www.des.nh.gov/sites/g/files/ehbemt341/files/documents/2020-01/ard-28.pdf
New York State Department of Environmental Conservation. (2026). Canada Lynx. https://dec.ny.gov/nature/animals-fish-plants/canada-lynx
Nicholson, C., Duncan, J., Kosiba, A., Truong, J., & Pontius, J. (2018). FEMC Long-Term Monitoring Update 2017. Forest Ecosystem Monitoring Cooperative. https://doi.org/10.18125/vermont2017
Nielsen, K. M., Soulen, B. K., Overturf, C. L., Drevnick, P. E., & Roberts, A. P. (2015). Embryotoxicity of maternally transferred methylmercury to fathead minnows (Pimephales promelas). Environmental Toxicology and Chemistry, 35(6). https://academic.oup.com/etc/article-abstract/35/6/1436/7741821?redirectedFrom=fulltext
NOAA Fisheries. (2025). Shortnose Sturgeon. https://www.fisheries.noaa.gov/species/shortnose-sturgeon/overview
O’Connel-Domenech, A. (2022, August 23). Could climate change mean the spotted lanternfly is here to stay? Changing America. https://thehill.com/changing-america/sustainability/climate-change/3612764-could-climate-change-mean-the-spotted-lanternfly-is-…?
Okely, M., Chen, Z., Adly, E., & Kamal, M. (2025). Climate change influences on the potential geographic distribution of the invasive Asian longhorned tick, Haemaphysalis longicornis. Scientific Reports, 15(1), 2266. https://doi.org/10.1038/s41598-025-86205-6
Oli, M. K., Kenney, A. J., Boonstra, R., Boutin, S., Murray, D. L., Peers, M. J. L., Gilbert, B. S., Jung, T. S., Chaudhary, V., Hines, J. E., & Krebs, C. J. (2023). Does coat colour influence survival? A test in a cyclic population of snowshoe hares. Proceedings of the Royal Society B: Biological Sciences, 290(1996), 20221421. https://doi.org/10.1098/rspb.2022.1421
Oliver, T. H., Heard, M. S., Isaac, N. J. B., Roy, D. B., Procter, D., Eigenbrod, F., Freckleton, R., Hector, A., Orme, C. D. L., Petchey, O. L., Proença, V., Raffaelli, D., Suttle, K. B., Mace, G. M., Martín-López, B., Woodcock, B. A., & Bullock, J. M. (2015). Biodiversity and Resilience of Ecosystem Functions. Trends in Ecology & Evolution, 30(11), 673–684. https://doi.org/10.1016/j.tree.2015.08.009
Olson, D. H., & Saenz, D. (2013). Reptiles and Climate Change. U.S. Department of Agriculture, Forest Service, Climate Change Resource Center. www.fs.usda.gov/ccrc/topics/wildlife/reptiles/
Pack, E. C., Kim, C. H., Lee, S. H., Lim, C. H., Sung, D. G., Kim, M. H., Park, K. H., Hong, S.-S., Lim, K. M., Choi, D. W., & Kim, S. W. (2014). Effects of Environmental Temperature Change on Mercury Absorption in Aquatic Organisms with Respect to Climate Warming. Journal of Toxicology and Environmental Health, Part A, 77(22–24), 1477–1490. https://doi.org/10.1080/15287394.2014.955892
Pankhurst, N. W., & Munday, P. L. (2011). Effects of climate change on fish reproduction and early life history stages. Marine and Freshwater Research, 62(9). https://doi.org/https://doi.org/10.1071/MF10269
Parren, M., Mikula, T., & Parren, S. (2019). Vermont Spotted Turtle Recovery Plan. Vermont Fish and Wildlife Department. https://www.vtfishandwildlife.com/sites/fishandwildlife/files/documents/Learn%20More/Library/REPORTS%20AND%20DOCUMENTS/NONGAME%…
Perea, R., Girardello, M., & San Miguel, A. (2014). Big game or big loss? High deer densities are threatening woody plant diversity and vegetation dynamics. Biodiversity and Conservation, 23(5), 1303–1318. https://doi.org/10.1007/s10531-014-0666-x
Peterson, G., Allen, C. R., & Holling, C. S. (1998). Ecological Resilience, Biodiversity, and Scale. Ecosystems, 1(1), 6–18. https://doi.org/10.1007/s100219900002
Phillips, C. . A. (2023). Conservation guidance for the Muddpuppy (Necturus maculosus). Illinois Department of Natural Resources, Division of Natural Heritage. https://naturalheritage.illinois.gov/content/dam/soi/en/web/naturalheritage/speciesconservation/speciesguidance/documents/speci…
Pickrel, A., Swanson, M., Williamson, J., & Montgomery, S. (2023). Trends in Reported Babesiosis Cases—United States, 2011–2019. MMWR and Morbidity and Mortality Weekly Report, 72, 273–277. https://doi.org/http://dx.doi.org/10.15585/mmwr.mm7211a1
Pirani, A. (2024, August 9). NH beekeepers say climate change is stressing out their bees. New Hampshire Public Radio. https://www.vermontpublic.org/2024-08-09/nh-beekeepers-say-climate-change-is-stressing-out-their-bees
Plowright, R. K., Cross, P. C., Tabor, G. M., Almberg, E., Bienen, L., & Hudson, P. J. (2012). Climate Change and Infectious Disease Dynamics. In New Directions in Conservation Medicine: Applied Cases of Ecological Health. Oxford University Press. https://books.google.com/books?hl=en&lr=&id=sHzb1eTu4n0C&oi=fnd&pg=PA111&dq=climate+change+wildlife+disease+contact+rates&ots=o…
Price, S. J., Leung, W. T. M., Owen, C. J., Puschendorf, R., Sergeant, C., Cunningham, A. A., Balloux, F., Garner, T. W. J., & Nichols, R. A. (2019). Effects of historic and projected climate change on the range and impacts of an emerging wildlife disease. Global Change Biology, 25(8), 2648–2660. https://doi.org/https://doi.org/10.1111/gcb.14651
Prosser, D. J., Teitelbaum, C. S., Yin, S., Hill, N. J., & Xiao, X. (2023). Climate change impacts on bird migration and highly pathogenic avian influenza. Nature Microbiology, 8(12), 2223–2225. https://doi.org/10.1038/s41564-023-01538-0
Pyke, G. H., Thomson, J. D., Inouye, D. W., & Miller, T. J. (2016). Effects of climate change on phenologies and distributions of bumble bees and the plants they visit. Ecosphere, 7(3). https://esajournals.onlinelibrary.wiley.com/doi/10.1002/ecs2.1267
Rajagopalan, K., DeGrandi-Hoffman, G., Pruett, M., Jones, V. P., Corby-Harris, V., Pireaud, J., Curry, R., Hopkins, B., & Northfield, T. D. (2024). Warmer autumns and winters could reduce honey bee overwintering survival with potential risks for pollination services. Scientific Reports, 14(1), 5410. https://doi.org/10.1038/s41598-024-55327-8
Renfrew, R. (2013). Red-bellied Woodpecker (Melanerpes carolinus). Vermont Center for Ecostudies. https://val.vtecostudies.org/projects/vermont-breeding-bird-atlas/red-bellied-woodpecker/
Responsive Management. (2020). 2020 Vermont Angler Survey Report. https://www.vtfishandwildlife.com/sites/fishandwildlife/files/documents/Learn%20More/Library/REPORTS%20AND%20DOCUMENTS/FISHERIE…
Rice, Kevin. B., & Klooster, W. (2014). Emerald Ash Borer Invasion of North American Forests. Ohio Agricultural Research and Development Center, Ohio State University Extension. https://cpb-us-w2.wpmucdn.com/u.osu.edu/dist/b/3829/files/2014/05/EAB-impact-on-forests-2in13le.pdf
Richardson, L. L., McFarland, K. P., Zahendra, S., & Hardy, S. (2019). Bumble bee (Bombus) distribution and diversity in Vermont, USA: A century of change. Journal of Insect Conservation, 23(1), 45–62. https://doi.org/10.1007/s10841-018-0113-5
Rochlin, I., Ninivaggi, D. V., Hutchinson, M. L., & Farajollahi, A. (2013). Climate Change and Range Expansion of the Asian Tiger Mosquito (Aedes albopictus) in Northeastern USA: Implications for Public Health Practitioners. PLoS ONE, 8. https://doi.org/https://doi.org/10.1371/journal.pone.0060874
Rodenhouse, N. L., Christenson, L. M., Parry, D., & Green, L. E. (2009). Climate change effects on native fauna of northeastern forests. Canadian Journal of Forest Research, NE Forests 2100: A Synthesis of Climate Change Impacts on Forests of the Northeastern US and Eastern Canada., 39(2), 249–263. https://doi.org/10.1139/X08-160
Rodenhouse, N. L., Matthews, S. N., McFarland, K. P., Lambert, J. D., Iverson, L. R., Prasad, A., Sillett, T. S., & Holmes, R. T. (2008). Potential effects of climate change on birds of the Northeast. Mitigation and Adaptation Strategies for Global Change, 13(5), 517–540. https://doi.org/10.1007/s11027-007-9126-1
Roitberg, B. D., & Mangel, M. (2016). Cold snaps, heatwaves, and arthropod growth. Ecological Entomology, 41(6), 653–659. https://doi.org/10.1111/een.12324
Romano, A., Garamszegi, L. Z., Rubolini, D., & Ambrosini, R. (2022). Temporal shifts in avian phenology across the circannual cycle in a rapidly changing climate: A global meta-analysis. Ecological Monograhs, 93(1). https://doi.org/https://doi.org/10.1002/ecm.1552
Ross, J. J., Carlile, N., & Ard, K. L. (2025). Increasing Length of the Babesia Season in New England in the Climate Change Era. Open Forum Infectious Diseases, 12(8), ofaf458. https://doi.org/10.1093/ofid/ofaf458
Rubenstein, M. (2017, February 10). When Timing is Everything: Migratory Bird Phenology in a Changing Climate. The Wildlife Society. https://wildlife.org/migratory-bird-phenology-in-a-changing-climate/
Rustad, L., Campbell, J., Dukes, J. S., Huntington, T., Fallon Lambert, K., Mohan, J., & Rodenhouse, Nicholas. (2012). Changing climate, changing forests: The impacts of climate change on forests of the northeastern United States and eastern Canada(NRS-GTR-99; p. NRS-GTR-99). U.S. Department of Agriculture, Forest Service, Northern Research Station. https://doi.org/10.2737/NRS-GTR-99
Samuels, F. M. D. (2022, July 5). How Climate Change Is Leaving Some Species with “Nowhere Left to Go.” Scientific American. https://www.scientificamerican.com/article/how-climate-change-is-leaving-some-species-with-nowhere-left-to-go/
Sanders, J. (2025, September 24). Vermont’s 2025 Drought and Cover Cropping: Stay the Course. University of Vermont Extension. https://www.uvm.edu/extension/nwcrops/news/vermonts-2025-drought-and-cover-cropping-stay-course#:~:text=Vermont’s%202025%20drought%20has%20pushed,)%E2%80%94the%20worst%20since%202000.
Schwartz, M. D., & Karl, T. R. (1990). Spring Phenology: Nature’s Experiment to Detect the Effect of “Green-Up” on Surface Maximum Temperatures. Monthly Weather Review, 118(4), 883–890. https://doi.org/10.1175/1520-0493(1990)118%3C0883:SPNETD%3E2.0.CO;2
Skendžić, S., Zovko, M., Živković, I. P., Lešić, V., & Lemić, D. (2021). The Impact of Climate Change on Agricultural Insect Pests. Insects, 12(5), 440. https://doi.org/10.3390/insects12050440
Soucheray, S. (2025, September 11). Vermont reports its first human Jamestown Canyon case. Center for Infectious Disease Research and Policy. https://www.cidrap.umn.edu/misc-emerging-topics/vermont-reports-its-first-human-jamestown-canyon-case
Stemkovski, M., Pearse, W. D., Griffin, S. R., Pardee, G. L., Gibbs, J., Griswold, T., Neff, J. L., Oram, R., Rightmyer, M. G., Sheffield, C. S., Wright, K., Inouye, B. D., Inouye, D. W., & Irwin, R. E. (2020). Bee phenology is predicted by climatic variation and functional traits. Ecology Letters, 23(11), 1589–1598. https://doi.org/https://doi.org/10.1111/ele.13583
Stoffels, R. J., Humphries, P., Bond, N. R., & Price, A. E. (2022). Fragmentation of lateral connectivity and fish population dynamics in large rivers. Fish and Fisheries, 23(3), 680–696. https://doi.org/10.1111/faf.12641
Swinton, M., & Nierzwicki-Baur, S. (2018). Survey of mercury and cyanotoxin concentrations in fish tissues in Lake Champlain. Darrin Fresh Water Institute, Lake Champlain Basin Program. https://www.lcbp.org/wp-content/uploads/2020/01/93_Survey-of-mercury-and-cyanotoxin-concentrations-in-fish-tissues-in-Lake-Cham…
Tandon, A. (2021, April 19). Climate change could cause ‘irreversible impacts’ to lake ecosystems. CarbonBrief. https://www.carbonbrief.org/climate-change-could-cause-irreversible-impacts-to-lake-ecosystems/
Templer, P. H., Schiller, A. F., Fuller, N. W., Socci, A. M., Campbell, J. L., Drake, J. E., & Kunz, T. H. (2012). Impact of a reduced winter snowpack on litter arthropod abundance and diversity in a northern hardwood forest ecosystem. Biology and Fertility of Soils, 48(4), 413–424. https://doi.org/10.1007/s00374-011-0636-3
Thomas, C. D. (2010). Climate, climate change and range boundaries. Diversity and Distributions, 16(3), 488–495. https://doi.org/10.1111/j.1472-4642.2010.00642.x
Tian, H., Zhou, S., Dong, L., Van Boeckel, T. P., Pei, Y., Wu, Q., Yuan, W., Guo, Y., Huang, S., Chen, W., Lu, X., Liu, Z., Bai, Y., Yue, T., Grenfell, B., & Xu, B. (2015). Climate change suggests a shift of H5N1 risk in migratory birds. Special Issue: Ecological Modelling for Ecosystem Sustainability: Selected Papers Presented at the 19th ISEM Conference, 28-31 October 2013, Toulouse, France, 306, 6–15. https://doi.org/10.1016/j.ecolmodel.2014.08.005
Timmermann, H. R., & Rodgers, A. R. (2005). Moose: Competing and Complementary Values. Alces, 41. https://doi.org/https://alcesjournal.scholasticahq.com/article/156635.pdf
Tinkers Creek Watershed Partners. (2016, January 9). Importance of Protecting Riparian Areas. https://www.tinkerscreek.org/importance-protecting-riparian-areas/
Tolan, K. (2026, February 10). VT Vernal Pool Monitoring Project. Vermont Center for Ecostudies. https://storymaps.arcgis.com/stories/9a03a50f5ba344d193ba2ec57dd559fd
Trombly, J. (2019, December 29). Vermont tradition in decline: Hunting falls victim to demographic shifts. VT Digger. https://vtdigger.org/2019/12/29/vermont-tradition-in-decline-hunting-falls-victim-to-demographic-shifts/
Truong, J., Parnapy, C., Ladago, B., & McHugh, P. (2017). Wild Brook Trout Monitoring in the West Branch of the Little River and Ranch Brook. Forest Ecosystem Monitoring Cooperative. https://www.uvm.edu/femc/products/long_term_update/2017/vermont/trout
U.S. Department of Agriculture. (2023). Forest Health Highlights Vermont 2023. https://www.fs.usda.gov/foresthealth/docs/fhh/VT_FHH_2023.pdf
U.S. Department of Agriculture, Animal and Plant Health Inspection Service. (2025, October 26). Spotted Lanternfly. https://www.aphis.usda.gov/plant-pests-diseases/slf
U.S. Fish and Wildlife Service. (2019). Dwarf Wedgemussel 5-Year Review: Summary and Evaluation. https://ecosphere-documents-production-public.s3.amazonaws.com/sams/public_docs/species_nonpublish/2774.pdf
U.S. Fish and Wildlife Service. (2026a). Canada Lynx. https://www.fws.gov/species/canada-lynx-lynx-canadensis
U.S. Fish and Wildlife Service. (2026b). Indiana bat. https://www.fws.gov/species/indiana-bat-myotis-sodalis
U.S. Fish and Wildlife Service. (2026c). Northern long-eared bat (Myotis septentrionalis). https://www.fws.gov/species/northern-long-eared-bat-myotis-septentrionalis
U.S. Fish and Wildlife Service. (2026d). Wetland Resources: Vermont. https://www.fws.gov/media/wetland-resources-vermont
U.S. Fish and Wildlife Service Core Team. (2021). Species Status Assessment Report for the Tricolored Bat (Perimyotis subflavus)(Species Status Assessment (SSA) Report 1.1; p. 166). U.S. Fish and Wildlife Service. https://www.fws.gov/sites/default/files/documents/Tricolored_Bat_SSA.pdf
USGCRP. (2023). Fifth National Climate Assessment (No. 5th). U.S. Global Change Research Program. https://nca5.climate.us/downloads/NCA5_2023_FullReport.pdf
Van Den Bosch, M., Kellner, K. F., Beyer, D. E., Erb, J. D., MacFarland, D. M., Norton, D. C., Price Tack, J. L., Roell, B. J., & Belant, J. L. (2023). Gray wolf range in the western Great Lakes region under forecasted land use and climate change. Ecosphere, 14(8), e4630. https://doi.org/10.1002/ecs2.4630
Vermont Agency of Agriculture Food and Markets. (2026). Spongy Moth. https://agriculture.vermont.gov/public-health-agricultural-resource-management-division/plant-health-and-pest-management/vermon…
Vermont Center for Ecostudies. (2022, October 3). Field Guide to October 2022. https://vtecostudies.org/blog/field-guide-to-october-2022
Vermont Center for Ecostudies. (2025). Loon Research at VCE. https://vtecostudies.org/what-we-do/projects/loon-conservation/research
Vermont Center for Ecostudies. (2026a). Mercury in the Mountains. https://vtecostudies.org/projects/mountains/mountain-songbird-research/mercury/
Vermont Center for Ecostudies. (2026b). Vermont Vernal Pool Atlas. https://vpatlas.org/
Vermont Citizens Advisory Committee. (2025). 2025 Lake Champlain Action Plan. https://legislature.vermont.gov/Documents/2026/Workgroups/House%20Agriculture/Land%20Management/Vermont%20Champlain%20Advisory%…’s%20Future%20Action%20Plan%20Presentation~1-23-2025.pdf
Vermont Department of Environmental Conservation. (2026a). Mercury and Other Persistent Pollutants. https://dec.vermont.gov/watershed/lakes-ponds/learn/mercury
Vermont Department of Environmental Conservation. (2026b). Watershed Management Division. https://dec.vermont.gov/watershed#:~:text=The%20Watershed%20Management%20Division%20is,and%20300%2C000%20acres%20of%20wetlands.
Vermont Department of Environmental Conservation. (2026c). Wetland Functions and Values: Wildlife Habitat. https://dec.vermont.gov/watershed/wetlands/functions/wildlife
Vermont Department of Environmental Conservation Water Management Division. (2023). Vermont Wetlands Program Plan 2023-2028. https://www.epa.gov/system/files/documents/2023-04/VT%20WPP%202023-2027.pdf
Vermont Department of Forests, Parks and Recreation. (2026). Spongy Moth. https://fpr.vermont.gov/spongy-moth
Vermont Department of Health. (2023). 2022 Arbovirus Surveillance Report. https://healthvermont.org/sites/default/files/document/HS-ID-ArbovirusSurveillanceReport2022.pdf
Vermont Department of Health. (2025). Tick Activity in Vermont. https://www.healthvermont.gov/disease-control/tick-bite-illnesses/tick-activity-vermont
Vermont Fish and Wildlife Department. (2005, November 22). 2005 Vermont Wildlife Action Plan. https://www.vtfishandwildlife.com/sites/fishandwildlife/files/documents/About%20Us/Budget%20and%20Planning/VT_Willdife_Action_P…
Vermont Fish and Wildlife Department. (2015). Vermont Wildlife Action Plan 2015 (p. 1502). Vermont Fish and Wildlife Department. https://www.vtfishandwildlife.com/sites/fishandwildlife/files/documents/About%20Us/Budget%20and%20Planning/WAP2015/__2015-VT-Wi…
Vermont Fish and Wildlife Department. (2020, October 5). 2020 – 2030 DRAFT Big Game Plan Public Comment Meeting. http://vtfishandwildlife.com/sites/fishandwildlife/files/documents/Learn%20More/Library/REPORTS%20AND%20DOCUMENTS/HUNTING/BIG-G…
Vermont Fish and Wildlife Department. (2023). A Landowner’s Guide to Indiana Bat Habitat Stewardship. https://vtfishandwildlife.com/sites/fishandwildlife/files/documents/Learn%20More/Library/FACTSHEETS/NONGAME%20WILDLIFE/BATS/Ind…
Vermont Fish and Wildlife Department. (2024a). Fishing Guide and Regulations. https://anrweb.vt.gov/PubDocs/FWD/FisheriesLibrary/Fisheries/Historic%20Fish%20Documents/Fish%20and%20Wildlife%20Historic%20Doc…
Vermont Fish and Wildlife Department. (2024b, October 4). Rare Canada Lynx Sightings Continue, Evidence of Habitat Conservation Success. https://www.vtfishandwildlife.com/press-releases/rare-canada-lynx-sightings-continue-evidence-habitat-conservation-success
Vermont Fish and Wildlife Department. (2025a). 2025 Vermont Moose Hunt Results. https://www.vtfishandwildlife.com/press-releases/2025-vermont-moose-hunt-results
Vermont Fish and Wildlife Department. (2025b). Animal Inventory. https://www.vtfishandwildlife.com/conserve/conservation-planning/animal-inventory
Vermont Fish and Wildlife Department. (2025c). Bird SGCN Conservation Reports (Appendix A.2; Vermont Wildlife Action Plan). https://www.vtfishandwildlife.com/sites/fishandwildlife/files/documents/About%20Us/Budget%20and%20Planning/WAP2025/A.2%20Bird%2…
Vermont Fish and Wildlife Department. (2025d). Vermont’s Preliminary Report on 2024 Deer Seasons. https://www.vtfishandwildlife.com/press-releases/vermonts-preliminary-report-2024-deer-seasons
Vermont Fish and Wildlife Department. (2025e, September 9). Endangered and Threatened Animals of Vermont. https://www.vtfishandwildlife.com/sites/fishandwildlife/files/documents/Learn%20More/Library/REPORTS%20AND%20DOCUMENTS/Natural-…
Vermont Fish and Wildlife Department. (2025f, December 26). Amphibian & Reptile SGCN Conservation Reports. https://www.vtfishandwildlife.com/sites/fishandwildlife/files/documents/About%20Us/Budget%20and%20Planning/WAP2025/A.1%20Amphib…
Vermont Fish and Wildlife Department. (2026a). 2025 Vermont Wildlife Action Plan. https://www.vtfishandwildlife.com/about-us/budget-and-planning/wildlife-action-plan
Vermont Fish and Wildlife Department. (2026b). Bowfin. https://www.vtfishandwildlife.com/learn-more/vermont-critters/fish/bowfin
Vermont Fish and Wildlife Department. (2026c). Brook Trout. https://www.vtfishandwildlife.com/learn-more/vermont-critters/fish/brook-trout
Vermont Fish and Wildlife Department. (2026d). Deer Regulation Changes FAQ. https://vtfishandwildlife.com/sites/fishandwildlife/files/documents/Hunt/deer/Deer-Reg-Changes-FAQs.pdf
Vermont Fish and Wildlife Department. (2026e). Got Bats? https://www.vtfishandwildlife.com/learn-more/living-with-wildlife/got-bats#:~:text=White%2Dnose%20Syndrome%20is%20a,to%20humans….
Vermont Fish and Wildlife Department. (2026f). Longnose Gar. https://www.vtfishandwildlife.com/learn-more/vermont-critters/fish/longnose-gar
Vermont Fish and Wildlife Department. (2026g). Moose Research. https://vtfishandwildlife.com/conserve/conservation-planning/animal-inventory/mammals/moose-research
Vermont Fish and Wildlife Department. (2026h). Rainbow Trout. https://www.vtfishandwildlife.com/learn-more/vermont-critters/fish/rainbow-trout
Vermont Fish and Wildlife Department. (2026i). Rock Bass. https://www.vtfishandwildlife.com/learn-more/vermont-critters/fish/rock-bass
Vermont Fish and Wildlife Department. (2026j). Smallmouth Bass. https://www.vtfishandwildlife.com/learn-more/vermont-critters/fish/smallmouth-bass
Vermont Fish and Wildlife Department. (2026k). Vermont Conservation Design. https://www.vtfishandwildlife.com/conserve/vermont-conservation-design
Vermont Fish and Wildlife Department. (2026l). Vernal Pool. https://www.vtfishandwildlife.com/conserve/conservation-planning/natural-community-fact-sheets/vernal-pool
Vermont Fish and Wildlife Department. (2026m). White Perch. https://www.vtfishandwildlife.com/learn-more/vermont-critters/fish/white-perch
Vermont Fish and Wildlife Department. (2026n). White Sucker. https://www.vtfishandwildlife.com/learn-more/vermont-critters/fish/white-sucker
Vermont Invasives. (2026). Spongy Moth (formally gypsy moth). https://vtinvasives.org/invasive/spongy-moth-formally-gypsy-moth
Vermont Natural Resource Council. (2026). Protecting Vermont’s wetlands. https://vnrc.org/clean-water/wetlands/
Vinick, G. (2023, March 20). Wisconsin’s only fully aquatic salamander, the mudpuppy, is the focus of new DNR research effort. Wisconsin Public Radio. https://www.wpr.org/animals/wisconsins-aquatic-salamander-mudpuppy-focus-new-dnr-research-effort
Vitasse, Y., Ursenbacher, S., Klein, G., Bohnenstengel, T., Chittaro, Y., Delestrade, A., Monnerat, C., Rebetez, M., Rixen, C., Strebel, N., Schmidt, B. R., Wipf, S., Wohlgemuth, T., Yoccoz, N. G., & Lenoir, J. (2021). Phenological and elevational shifts of plants, animals and fungi under climate change in the European Alps. Biological Reviews, 96(5), 1816–1835. https://doi.org/https://doi.org/10.1111/brv.12727
Wagner, I. (2025, June 22). Vermont’s adult loon population is at an all-time high, but fewer chicks are surviving. VT Digger. https://vtdigger.org/2025/06/22/vermonts-adult-loon-population-is-at-an-all-time-high-but-fewer-chicks-are-surviving/
Wakie, T. T., Neven, L. G., Yee, W. L., & Lu, Z. (2020). The Establishment Risk of Lycorma delicatula (Hemiptera: Fulgoridae) in the United States and Globally. Journal of Economic Entomology, 113(1), 306–314. https://doi.org/10.1093/jee/toz259
Wang, H., Liu, J., Klaar, M., Chen, A., Gudmundsson, L., & Holden, J. (2024). Anthropogenic climate change has influenced global river flow seasonality. Science, 383(6686), 1009–1014. https://doi.org/10.1126/science.adi9501
Wason, J. W., & Dovciak, M. (2017). Tree demography suggests multiple directions and drivers for species range shifts in mountains of Northeastern United States. Global Change Biology, 23(8), 3335–3347. https://doi.org/10.1111/gcb.13584
Wasserman, T. N., Cushman, S. A., Littell, J. S., Shirk, A. J., & Landguth, E. L. (2013). Population connectivity and genetic diversity of American marten (Martes americana) in the United States northern Rocky Mountains in a climate change context. Conservation Genetics, 14(2), 529–541. https://doi.org/10.1007/s10592-012-0336-z
Webb, J., & Zazzara-Yu, I. (2014). Physical Characteristics. Lake Ecosystem in the Land Between. https://lakeecosystems2014.wordpress.com/lake-data/physical-characteristics/
Weiskopf, S. R., Ledee, O. E., & Thompson, L. M. (2019). Climate change effects on deer and moose in the Midwest. The Journal of Wildlife Management, 83(4), 769–781. https://doi.org/https://doi.org/10.1002/jwmg.21649
Whitehorn, P. R., Rehschuh, R., Rehschuh, S., Hayward, S. A. L., & Brown, C. (2025). Climate Change Impacts on Diapause Outcomes in Bombus terrestris Across an Environmental Gradient. Journal of Applied Entomology, 149(7), 1023–1033. https://doi.org/https://doi.org/10.1111/jen.13432
Wild, R., Nagel, C., & Geist, J. (2023). Climate change effects on hatching success and embryonic development of fish: Assessing multiple stressor responses in a large-scale mesocosm study. Science of The Total Environment, 893, 164834. https://doi.org/10.1016/j.scitotenv.2023.164834
Wilson, J. K., Casajus, N., Hutchinson, R. A., McFarland, K. P., Kerr, J. T., Berteaux, D., Larrivée, M., & Prudic, K. L. (2021). Climate Change and Local Host Availability Drive the Northern Range Boundary in the Rapid Expansion of a Specialist Insect Herbivore, Papilio cresphontes. Frontiers in Ecology and Evolution, 9. https://doi.org/10.3389/fevo.2021.579230
Xu, W., Yu, J., Huang, P., Zheng, D., Lin, Y., Huang, Z., Zhao, Y., Dong, J., Zhu, Z., & Fu, W. (2022). Relationship between Vegetation Habitats and Bird Communities in Urban Mountain Parks. Animals, 12. https://pmc.ncbi.nlm.nih.gov/articles/PMC9495260/