Authors
Madeline Winer
Gund Institute for Environment, University of Vermont, Burlington, VT
Rae Taylor-Burns
Gund Institute for Environment, University of Vermont, Burlington, VT
Henry L. Motes
Hannah C. Turner
About
Recommended citation for chapter
Winer, M., Taylor-Burns, R., Motes, H. L, Turner, H.C. 2026. Chapter 4: Water Resources. In Galford, G.L., Balerna, J.A., Turner H.C., Sardonis, A., Peplinski, H. (Eds), The Vermont Climate Assessment 2025. Burlington, Vermont: Climate Measurements Center of Excellence, Gund Institute for Environment at the University of Vermont. DOI: 10.5281/zenodo.20272849. Accessed online at https://vtclimate.org.
Author Contributor Roles Taxonomy (CRediT) statement
Madeline Winer: Conceptualization, Data curation, Formal analysis, Investigation, Resources, Validation, Writing – original draft, Writing – review & editing; Rae Taylor-Burns: Conceptualization, Data curation, Formal analysis, Investigation, Resources, Validation, Writing – original draft, Writing – review & editing; Henry L. Motes: Conceptualization, Data curation, Formal analysis, Investigation, Validation, Writing – original draft, Writing – review & editing; Hannah Turner: Data curation, Resources
Acknowledgements
The thoughtful reviews and contributions efforts of Kristen Underwood, Peter Isles, Eric Roy, Beverley Wemple, Tiffany Chin, Rebecca Diehl, Anne Jefferson, Blaine Hastings, Sille Larsen, Ben Montross, Andrew Schroth, Appala Raju Badireddy, Paige Brochu, Samantha Grant, Ryan van der Heijden, Sonya Vogel, and Matthew Vaughan helped refine and strengthen this chapter.
Downloads
Please use the following accessible downloads for your own needs.To find downloads of other chapters in VCA 2025, please go to Downloads.
- Water Resources (high resolution PDF)
- Water Resources (low resolution PDF)
- Water Resources brief (PDF)
- Water Resources slidedeck (PPTX)
- alt-text is attached to each figure.
- alt-text is attached to each figure.
4.0 Executive summary
Climate change is making Vermont warmer and wetter and is reshaping its water resources. Annual rainfall is increasing and becoming more concentrated, and warmer winters are shifting precipitation to fall as rain instead of snow. Heavy rain can overwhelm surface waters, increase stream discharge, and trigger floods. Floods transport sediment, nutrients, and debris downstream, eroding stream banks, damaging infrastructure, and degrading water quality. These changes to water resources are creating new challenges for water managers, planners, and communities. Vermont needs to proactively support coordinated water resource planning, long-term monitoring of water resource supply, use, and quality, and invest in nature-based solutions that enhance community resilience to extreme events like droughts and floods.
Available data on water resources in Vermont show the following trends:
- Streamflow has increased an average of 19% across almost all of Vermont’s streams, largely due to increases in flows during winter (December, January, February) and summer (June, July, and August)
- Frequency of streams exhibiting “abnormal” streamflow conditions (>70th percentile) and “severe” conditions (>90th percentile) increased, on average, by approximately nine and five days per year, respectively.
- Frequency of streams exhibiting extreme drought conditions (i.e., streamflow <30th percentile) have not significantly changed in most places across Vermont; however, future climate assessments should continue to monitor these trends as future climate change may increase the frequency of prolonged dry spells leading to extreme drought conditions in streams.
- Approximately 75% of rivers surveyed in Vermont have lost the ability to inundate their floodplains due to historic channelization and development. During high streamflow events, water remains confined within channels, increasing erosion and flood damage potential downstream.
- Among the five most damaging floods in Vermont (November 1927, August 2011, July and December 2023, July 2024), the towns of Montpelier and Waterbury were consistently the most impacted, and the towns of Montpelier, Barre, and St. Albans consistently experienced landslides from extreme events.
- Both extreme weather events and warming winters degrade water quality. Following flooding in July 2023, sediment and pollution transport from upstream waters caused reduced water clarity in Lake Champlain. Increased winter runoff from midseason melt events contributes 30–65% of the annual nitrogen load and 15–55% of annual phosphorus load in Lake Champlain. Lake Morey, Lake Carmi, and Missisquoi Bay of Lake Champlain all increasingly experience harmful algal blooms, which negatively affects plants, wildlife, outdoor recreators, and businesses.
- Warmer winters are changing the average surface temperature of large water bodies. Since monitoring began in 1964, Lake Champlain surface temperatures have increased by 6.8 °F (3.8°C). Lake Champlain completely freezes over approximately once every five years compared to annually. These changes disrupt wildlife, promote growth of harmful algal blooms, and limit access to winter activities like ice fishing, ice skating, and snowmobiling.
Other chapters in this report provide additional context for understanding the full scope of climate change impacts on water resources, including: impacts to wildlife, such as cold-adapted fish (see 5 Fish and Wildlife), impacts to water-users, like farmers (see 6 Agriculture and Food Systems), impacts to outdoor activities (see 9 Outdoor Recreation and Tourism), impacts to water-related infrastructure, like culverts and dams (see 7 Infrastructure), and impacts to communities near floodplains (see 11 Community Development).
Vermont implemented several strategies to address climate-related water challenges. Programs (e.g., Functioning Floodplains Initiative) and legislation (e.g., Flood Safety Act of 2024) support floodplain restoration and other nature-based solutions to flooding. Since 2016, Vermont has invested more than $600 million in clean water projects aimed at reducing pollution and improving watershed health. More long-term data on water resource supply, use, and quality can help identify specific vulnerabilities across the state and inform priorities for funding and resource allocation. While flood risk mapping is currently being updated by the U.S. Federal Emergency Management Agency, additional resources are required to ensure mapping products consider projected climate-driven changes in precipitation, streamflow, and future flood risks across Vermont communities.
4.1 Key messages
- Streamflow in Vermont is significantly increasing, driven primarily by increased streamflow in winter (December, January, and February) and summer (June, July, and August).
- Floods are becoming more common in Vermont as evidenced by significant increases in streamflow that is either severe (>90th percentile) or abnormally high (>70th percentile); low flow conditions are not more frequent to date.
- Nature-based solutions, such as floodplain and wetland conservation and restoration, are a cost-effective approach to adapt to increased stream flow caused by climate change; these same solutions also enhance river ecosystem services including providing habitat and cleaner water.
- Flooding from heavy summer precipitation and mid-winter rain-on-snow or rain often transport large portions of the annual nutrient and sediment load to downstream waterbodies, resulting in a greater potential for algal blooms during summer months.
4.2 Background
4.2.1 Water resources in Vermont
Water resources are impacted differently across watersheds due to factors such as climate (Chivambo et al., 2025), topography (Gnann et al., 2025), watershed size (National Oceanic and Atmospheric Administration, 2024), population density (McDonald et al., 2014), and landcover (Li et al., 2020). Vermont is divided into four major drainage basins: the Hudson River, Lake Champlain, Connecticut River, and Lake Memphremagog (Vermont Department of Environmental Conservation, 2017; Figure 4-1). The National Weather Service specifies three climate divisions in Vermont based on the boundaries of these four drainage basins and other geographical properties such as topography (National Centers for Environmental Information (NCEI), 2026; Figure 4-1). The Lake Memphremagog basin is completely enclosed in the northeastern climate division, and the Hudson River basin is primarily enclosed in the southern climate division. The Lake Champlain Basin spans the western and northeastern climate divisions, and the Connecticut River basin spans the northeastern and southern climate divisions (Figure 4-1).
For the four major drainage basins, there are 15 tactical basin plans (TBP) produced by the Vermont Agency of Natural Resources (VT ANR) that address areas for surface water restoration and monitoring. The TBPs contain monitoring and assessment plans for improving water quality, maintaining recreational activity, and identifying stakeholders and local partners involved in watershed-specific planning (Vermont Department of Environmental Conservation, 2017, 2022). While these TBPs do not directly address climate change, they discuss important links between climate, water quantity, and water quality and are an important resource for those seeking to understand and address climate change impacts to water resources across the state (Vermont Department of Environmental Conservation, 2022; 4.7 Resources).
Vermont’s water resources include groundwater (i.e., saturated soils and the water table below the land surface) and surface water (i.e., lakes, ponds, rivers, and wetlands; U.S. Geological Survey, 2026d; Vermont Department of Environmental Conservation Watershed Management Division, 2025). In terms of mapped areas, Vermont features approximately 7,100 miles (11,400 km) of rivers and streams, 470 miles2 (1,220 km2) of freshwater wetlands, and 370 miles2 (970 km2) of lakes and ponds from 812 water bodies (Vermont Department of Environmental Conservation Watershed Management Division, 2025). Water resources have important ties to recreation, agriculture, infrastructure, human health, and biodiversity (Vermont Department of Environmental Conservation, 2025b; Vermont Department of Health, 2025a).
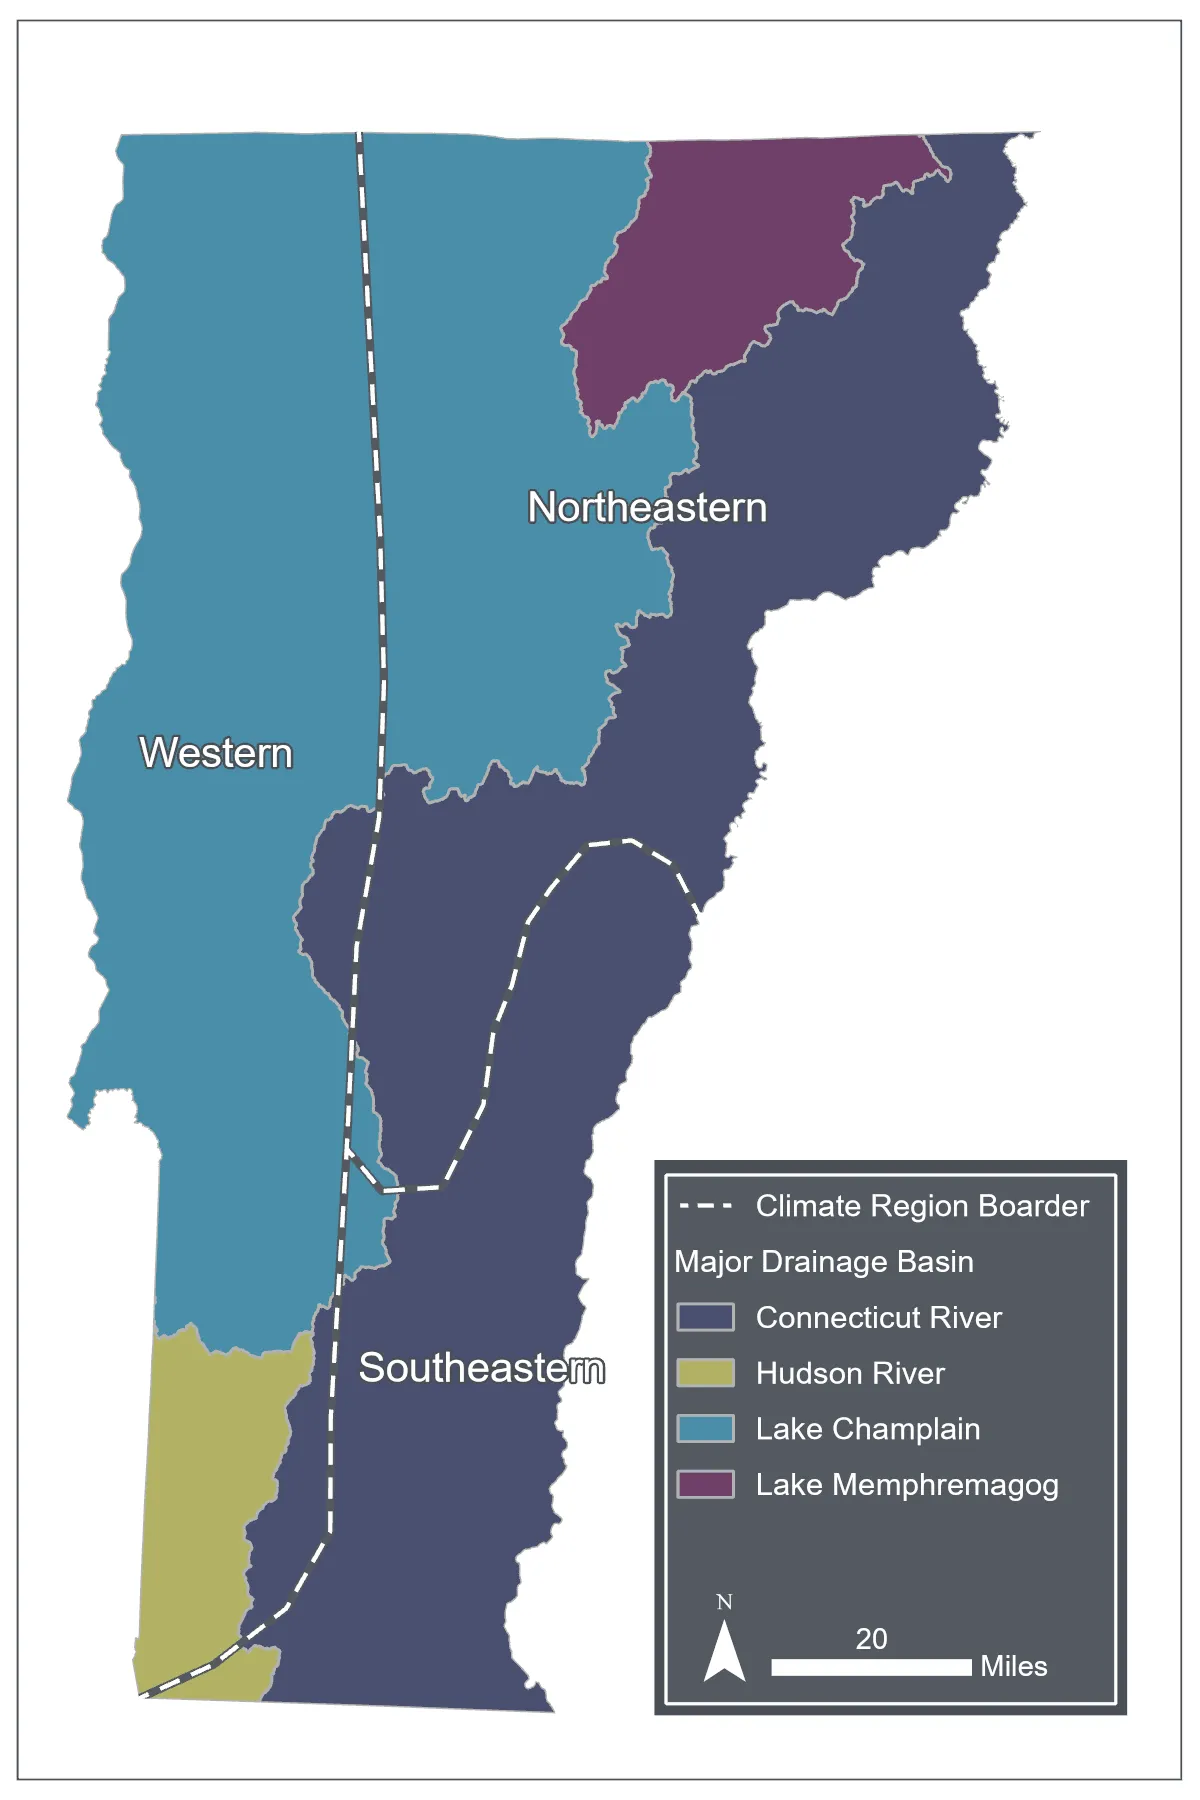
Source: National Hydrography Dataset (2023), National Center for Environmental Information Climate Region Dataset (2026)
Water resources can be conceptualized in terms of reservoirs (i.e., storage) and fluxes (i.e., flows), both of which can be impacted by climate change (Figure 4-2). Reservoirs describe places in a watershed where water is stored temporarily, and fluxes describe the processes that transfer water from one reservoir to another. Clouds, wetlands, lakes, rivers, snowpack, human-made impoundments, groundwater, and soil are examples of reservoirs. Precipitation (snow or rain), snowmelt, overland flow, streamflow, infiltration, and groundwater recharge are examples of fluxes.
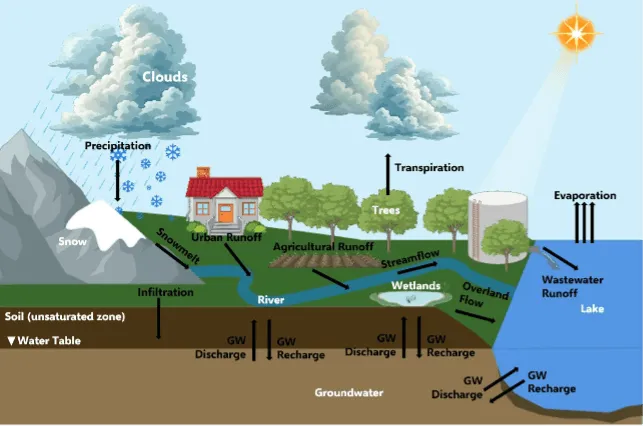
Source: BioRender using USGS Water Data for the Nation (2023)
4.2.2 Climate change impacts on water resources
Vermont is experiencing warmer and wetter conditions; annual rainfall increased over 20% between 1900–2024 (see Climate Change in Vermont 2.4 and 2.5). Heavy precipitation days (i.e., 24-hour periods with more than 1 inch [25.4mm] of precipitation) have increased 41% between 1900–2024 (see Climate Change in Vermont 2.5 and 2.6.2). Winter is the fastest warming season (see Climate Change in Vermont 2.4.3), which is causing more winter precipitation to fall as rain when historically it would have been snow (see Climate Change in Vermont 2.5.3). Though overall precipitation is increasing, it is also more variable, thus leading to both extreme flooding and drought events (see Climate Change in Vermont 2.6). Recently, precipitation has fluctuated between wet (2023, 2024) and dry (2025) extremes (see Climate Change in Vermont 2.6).
These changing weather patterns have consequences for Vermont’s water resources. Heavy precipitation days can quickly overwhelm water reservoirs, like ponds and lakes, and increase streamflow discharge, causing flooding (National Weather Service, 2026). Flooding can transport large amounts of sediment, nutrients, and debris over land and in stream channels, thereby damaging infrastructure and degrading water quality (Lake Champlain Basin Program, 2024; Rebuild By Design, 2026). Winter flooding from rain-on-snow (ROS), winter rain, and/or mid-season snowmelt can alter when nutrient loads enter waterways and degrade water quality during warmer months (Seybold et al., 2022). Finally, between heavy periods of precipitation, there may be extended periods of drought that decrease groundwater recharge (Crossett et al., 2023).
4.3 Water availability and use
Climate change alters the magnitude, timing, and frequency of surface water flow. In Vermont, seasonal fluctuations in groundwater and surface water are normal; however, long-term streamflow averages are trending towards wetter conditions during winter and summer months. Vermont is expected to have increased groundwater recharge from wetter conditions; however, dry periods and drought can limit groundwater recharge in the short term or in certain locations across the state (Crossett et al., 2023). During periods of reduced groundwater recharge and streamflow from dry conditions, water is less readily available for consumption (e.g., drinking water, irrigation, household use).
4.3.1 Changes in annual and seasonal streamflow
The U.S. Geological Survey (USGS) maintains a network of stream gauges in Vermont that measure streamflow volume and height daily, providing a data record over the decades. These data were used to determine how stream flows in Vermont streams have changed between 1966–1995 and 1996–2025. Streams with data dating back to 1966 with minimal gaps (<50% of data observations missing) were selected for analysis. The analysis included both unregulated (i.e., streams with no human-created impediments to flow) and regulated streams (i.e., streams with human-created impediments to flow, such as dams).
Annual median flow volume was calculated for each year from 1966–2025, and seasonal median flow volumes were calculated for winter (December, January, February), spring (March, April, May), summer (June, July, August), and fall (September, October, November). Annual and seasonal median flows were averaged into two time periods (i.e., 1966–1995 and 1996–2025), each spanning thirty years to reduce interannual variability and represent the conditions typical for the climate of each period. The percent change in annual and seasonal median streamflow was calculated between the two periods. Statistical significance (α<0.05) was calculated using a non-parametric Wilcoxon signed-rank test (Wilcoxon, 1945).
Across Vermont, streamflow increased in nearly all gauge sites (96%; 24/25) between the two time periods (Figure 4-3). Annual streamflow increased significantly, on average, by 19% between the two time periods for 20 streams (80% or 20/25 sites; Figure 4-3; Table 4-1). This trend is driven largely by significant seasonal increases in stream flow during winter (39% increase for 88% or 22/25 sites) and summer (45% increase for 36% or 9/25 sites) between the two time periods.
Gauges on river stretches that are unregulated—by dams or other structures that impede flow—may provide a view of streamflow conditions without human moderation, whereas regulated river gauges may represent a combination of climate change impacts and human interventions that either reduce or exacerbate those climate change impacts on streamflow. Nearly all unregulated gauge sites show significant increases in annual streamflow (100% or 9/9 sites), winter streamflow (100% or 9/9 sites) and summer streamflow (78% or 7/9 sites; Figure 4-3). The only gauge sites that showed decreasing trends for either annual, winter, or summer streamflow were regulated sites: Little River near Waterbury (annual, winter) and Black River at North Springfield (summer) and Connecticut River at Wells River (summer). These trends were non-significant, meaning they may be due to random chance; more data are needed to say with confidence that streamflow is decreasing over time at those sites.
Changes in annual and seasonal flow varied amongst the three climate divisions, with annual flow increasing the most in southeastern Vermont (25.9%) compared to northeastern (18.3%) and western (16.5%) Vermont (Table 4-1). Summer flow similarly increased the most between the two time periods in southeastern Vermont (50.6%) compared to northeastern (43.6%) and western (44.9%) Vermont. Winter flow increased the most in northeastern (41.4%) Vermont, followed by southeastern (35.9%) Vermont. Western Vermont had the smallest increase in winter flow (30.0%).
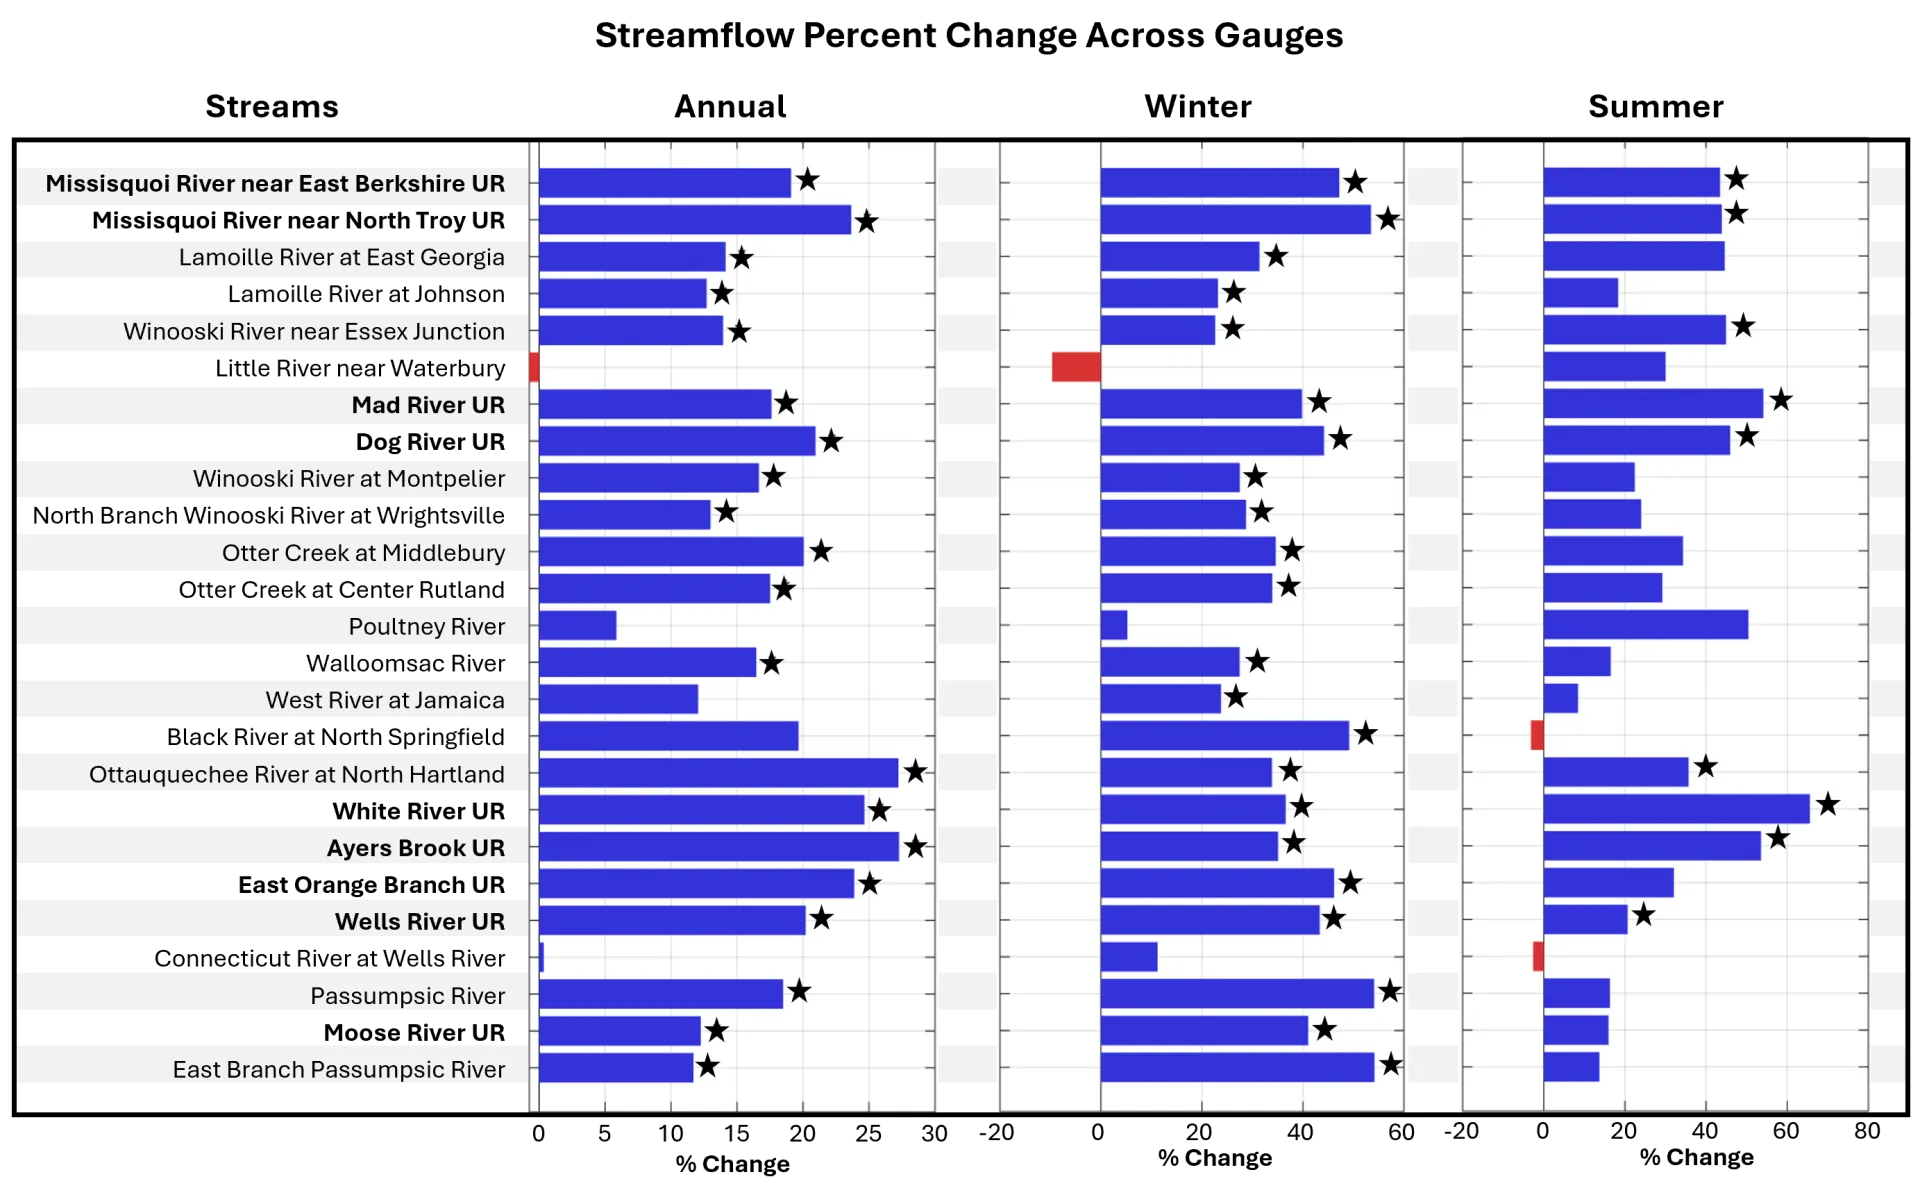
Source: USGS Water Data for the Nation (2026b)
Streamflow metrics | Whole state | Northeastern | Southeastern | Western |
|---|---|---|---|---|
Annual flow | 19% | 18% | 26% | 16% |
Winter flow | 36% | 41% | 36% | 30% |
Summer flow | 45% | 44% | 51% | 45% |
Source: USGS Water Data for the Nation (2026b)
4.3.2 Changes in streamflow extremes
Water availability in Vermont is affected by drought and flood events, which alter streamflow. These events are important and they may not be captured in annual or seasonal streamflow statistics (see 4.3.1). For low flow conditions to be considered “extreme,” it must meet one of the thresholds created by the U.S. Drought Monitor and remain below that threshold for at least seven consecutive days (USDM, 2026; Table 4-2). There are less consistently defined thresholds for measuring extreme high flow conditions, with researchers often evaluating multiple percentiles, including the 70th and 90th percentiles (Lins & Slack, 1998; Poff, 1996).
To estimate changes in streamflow extremes over time, the number of drought and flood days were calculated for two 30-year time periods (1966–1995 and 1996–2025), and then the difference in total drought/flood days between time periods was calculated. Statistical significance (α<0.05) was calculated using a non-parametric Wilcoxon signed-rank test (Wilcoxon, 1945).
| Extreme | Abnormal | Severe | Exceptional |
|---|---|---|---|
| Drought | <30th percentile | <10th percentile | <2nd percentile |
| Flooding | >70th percentile | >90th percentile | >98th percentile |
Source: National Integrated Drought Information System (2026)
Approximately a quarter of stream gauge sites exhibit an increase in abnormal (20% or 5/25) and severe (28% or 7/25) drought days, though the trends are significant for fewer sites (12% or 3/25 for abnormal and 8% or 2/25 for severe; Figure 4-4). While 88% (22/25) of sites exhibit an increase in exceptional drought days, only two have statistically significant trends (8%). Trends in these drought metrics that are not statistically significant may be due to random chance; however, future climate assessments should continue to monitor these trends as climate change may increase the frequency of prolonged dry spells leading to drought (see Climate Change in Vermont 2.6.3).
Significant increases in drought days were only observed in regulated streams, indicating that human moderation may be exacerbating low streamflow conditions (Figure 4-4). Both the Connecticut River at Wells River and the Poultney River had significant increases in abnormal (5.5 and 6 more days, respectively) and severe flow (7 and 11 more days, respectively). The Little River near Waterbury had significant increases in abnormal flow (5.5 more days). The Black River at North Springfield and Otter Creek at Middlebury had significant increases in exception drought days (6 and 7 more days, respectively). The impacts of the recent summer drought of 2025 on agriculture and food systems, outdoor recreation and tourism, fish and wildlife, and human water availability indicate that municipalities should carefully monitor drought conditions to ensure their communities are prepared for the consequences (Box 4-1).
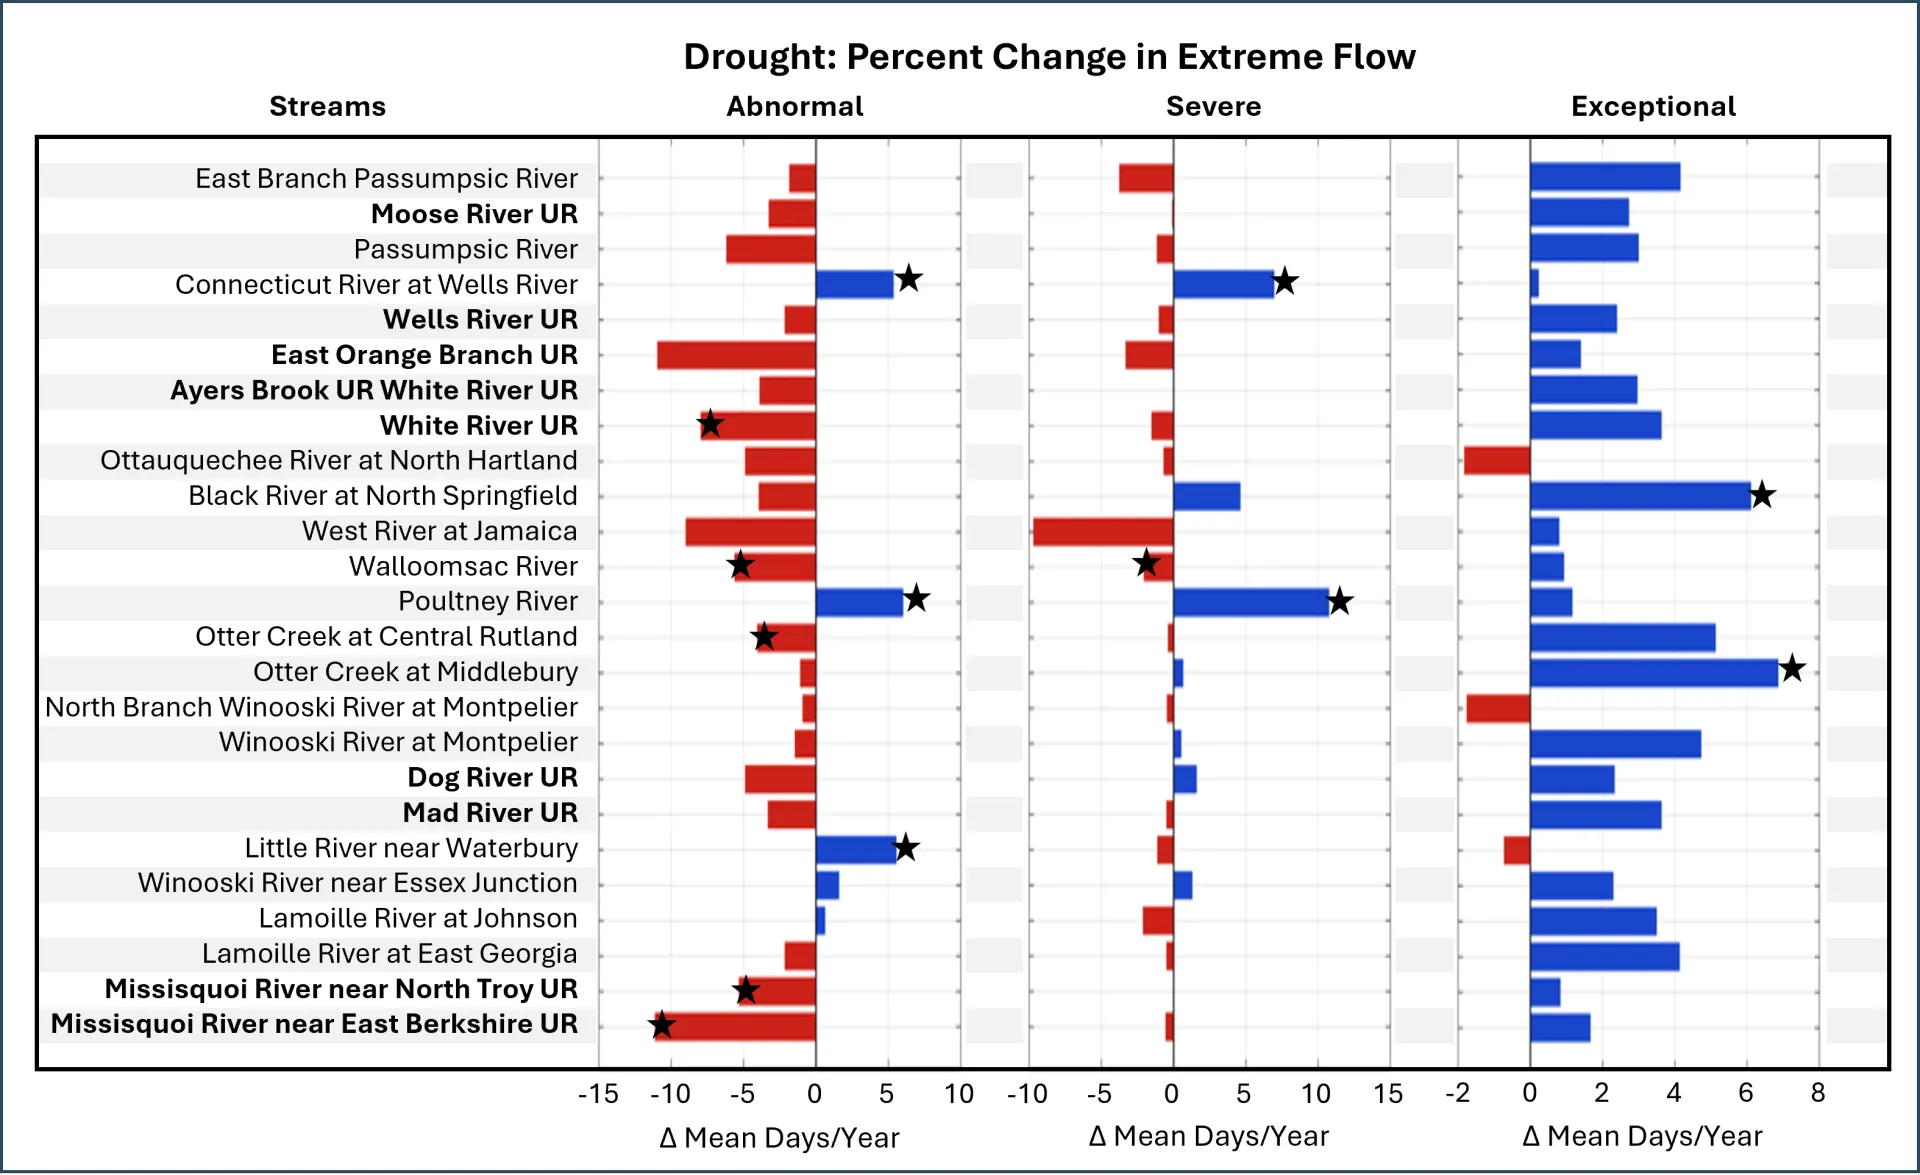
Source: USGS Water Data for the Nation (2026b)
Streamflow surpassed all three flood thresholds more frequently in the 1996–2025 time period than in the 1966–1995 time period (Table 2; Figure 4-5). All stream gauge sites (100% or 25/25 sites) exhibited an increase in abnormal flooding days and 68% of sites (or 17/25) were statistically significant. Most sites (88% or 22/25) exhibited an increase in severe flooding days and 52% (or 13/25) were statistically significant. Finally, 76% of sites (or 19/25) exhibited an increase in exceptional flooding days; only 12% of sites (or 3/25) were statistically significant. If trends in heavy precipitation days continue (see Climate Change in Vermont 2.6.2), exceptional flooding days in streams may increase.
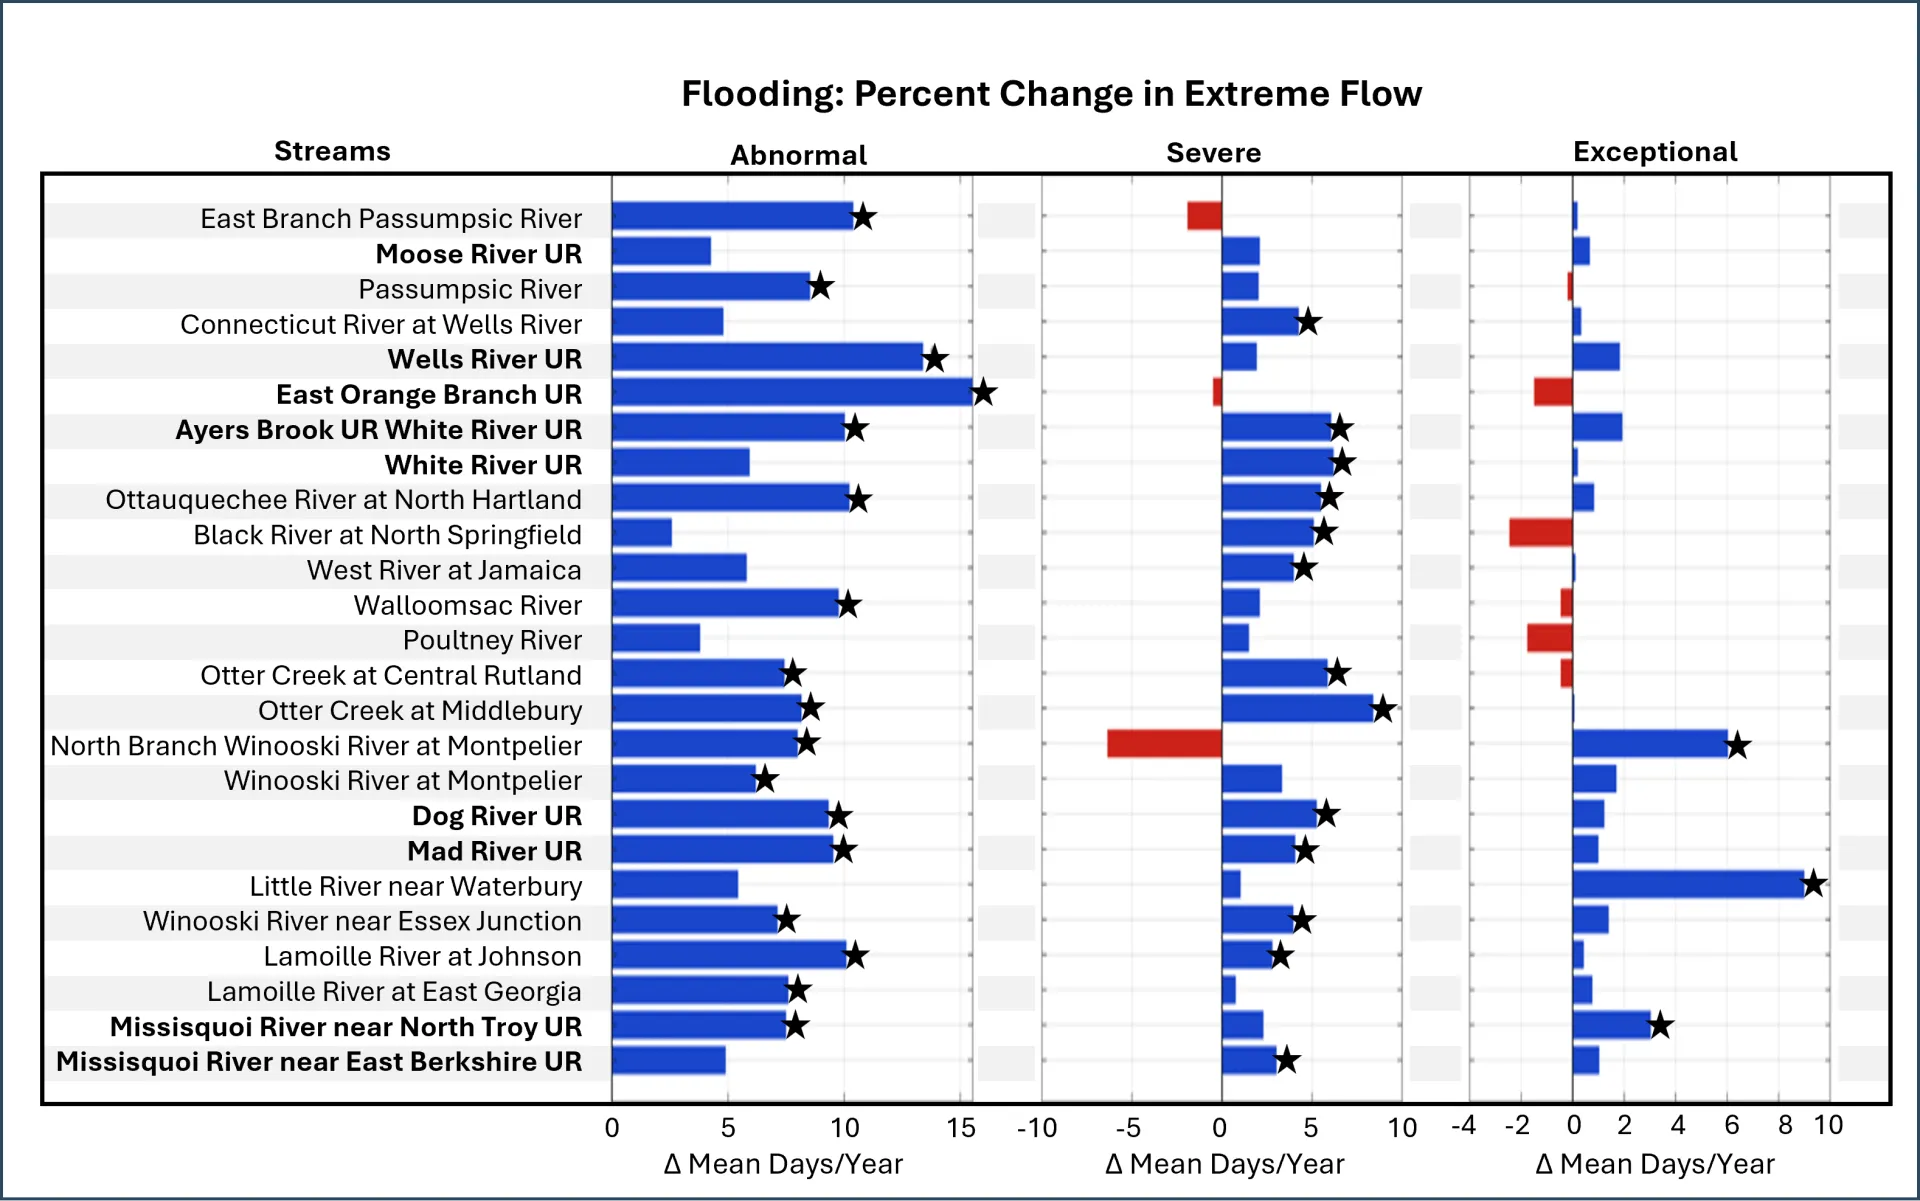
Source: USGS Water Data for the Nation (2026b)
Both regulated and unregulated streams exhibited significant increases in extreme high flow days. Those streams with significant increases are now (1996–2025) experiencing an average of 9.4 more days of abnormal flooding and 5.0 more days of severe flooding compared to the 1966–1995 time period (Figure 4-5; Table 4-3). Three stream gauge siteshad significant increases in exceptional flood days: North Branch Winooski River at Montpelier (6 more days), Little River near Waterbury (8.5 more days), and Missisquoi River near North Troy (3 more days).
Geographically, southeastern Vermont experienced the highest increase in number of abnormal flood days (10.2 more days) between the two time periods as compared to northeastern (9.9 more days) and western (8.1 more days) Vermont (Table 4-3). Between the two time periods, western Vermont experienced the highest increase in number of severe flood days (6.1 more days) as compared to southeastern (5.2 more days) and northeastern (4.3 more days) Vermont.
Streamflow metrics | Whole state | Northeastern | Southeastern | Western |
|---|---|---|---|---|
Abnormal flood days | 9.4 days | 9.9 days | 10.2 days | 8.1 days |
Severe flood days | 5.0 days | 4.3 days | 5.2 days | 6.1 days |
Source: USGS Water Data for the Nation (2026b)
Vermont streamflow has increased by multiple measures: annual streamflow, seasonal streamflow, and abnormal and severe flood days. Recent floods (July 2023, December 2023, July 2024) were prominently featured in local news and hold a strong place in collective memory. However, USGS stream gauge data does not show that the July 2023, December 2023, and July 2024 events (i.e., exceptional flooding events where streamflow > 98th percentile) are becoming more frequent with climate change. Even abnormal and severe flooding can cause flood damages to homes, businesses, and public infrastructure like roads and bridges. More information about how communities can prepare for increased flood risk can be found in this chapter (see 4.4.5; Community Development 11.5, Infrastructure 7.3.2, and Human Health 10.4).
Box 4-1: Summer 2025 drought
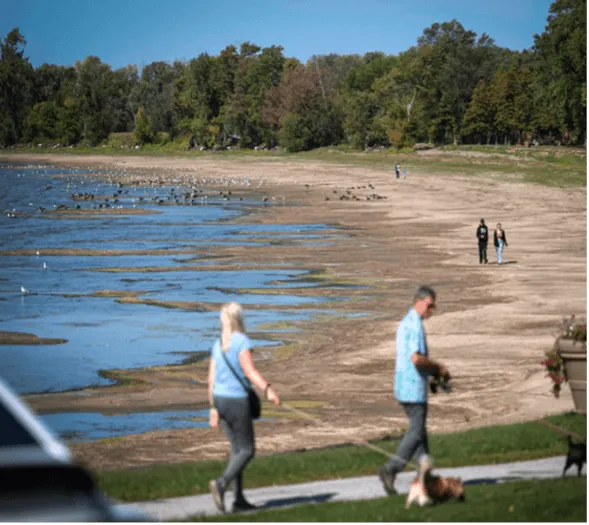
Sources: A) Glenn Russell via VTDigger (2025); B) and C) Vermont Department of Environmental Conservation (2026k)
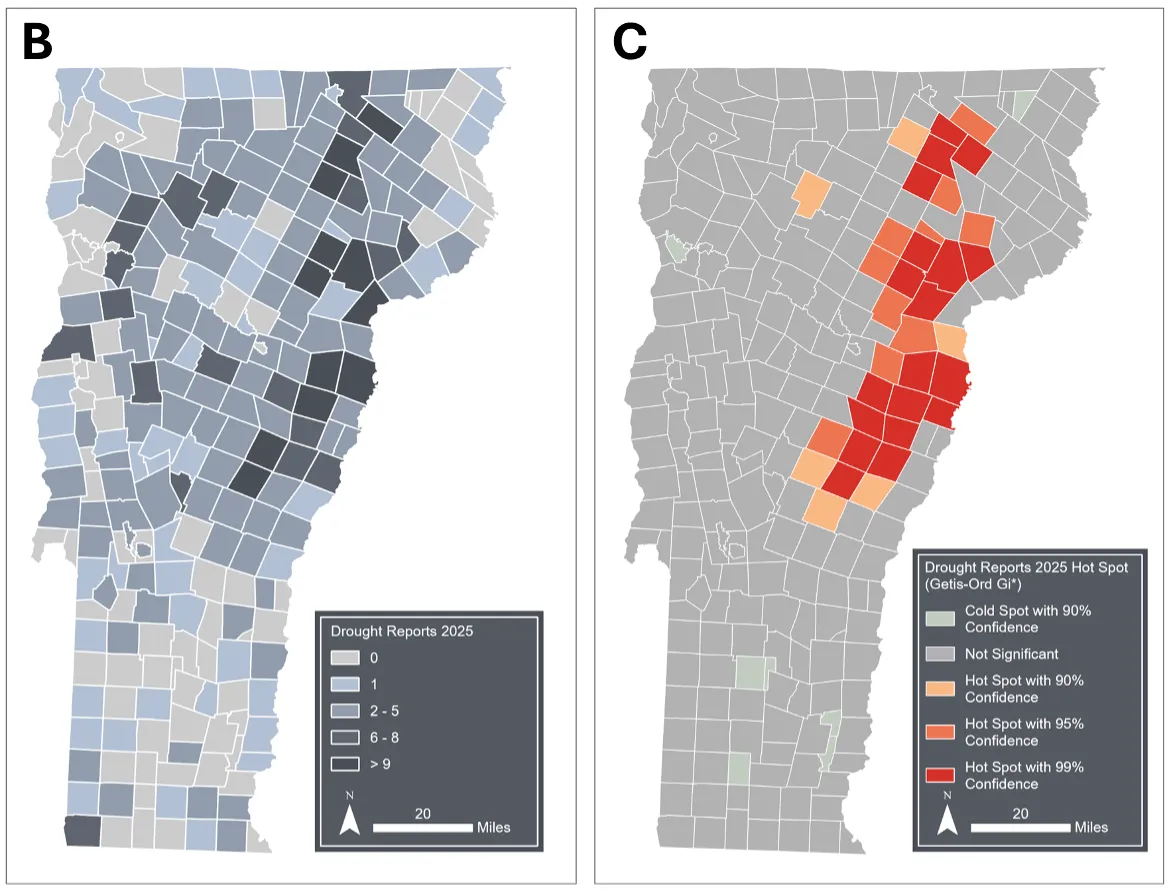
Sources: A) Glenn Russell via VTDigger (2025); B) and C) Vermont Department of Environmental Conservation (2026k)
In summer 2025, all of Vermont experienced drought streamflow conditions—the first time since records began in 2000 that any portion of the state experienced “extreme” drought (streamflow in the 2–5th percentile; United States Drought Monitor, 2026). By August 19th, every part of the state was experiencing some degree of drought, and 35% of the state was in a “moderate” drought (10–20th percentile of streamflow). By September 30th, 24% of Vermont was experiencing an “extreme” drought with Orange, Rutland, and Windsor counties the most impacted (Brady, 2025). By October 14th, 67% of the state was in “extreme” drought and 96% was in “severe” drought (5–10th percentile of streamflow). By November 18th, 10% of the state returned to normal conditions (greater than 30th percentile of flow) for the first time since August 12th.
The VT Department of Conservation (VTDEC) monitored drought reports for each town. Eastern Vermont was a hotspot and submitted a high concentration of private well reports and replacement well requests, which suggests drinking water impairment (2026k). Drought conditions threaten household, recreational, agricultural, and commercial water use. For private well users, drought can reduce short-term groundwater recharge, impacting how much water can be consumed at the household level. At a larger scale, water stress impacts agricultural and hydroelectric energy production and threatens the access to water for recreation.
4.3.3 Water use
Water use is dependent on water supply, water quality, and water demand, all of which can be affected by frequency and severity of droughts and flooding. Despite slight increases in Vermont population, USGS data shows that groundwater and surface water withdrawals decreased between 1985 and 2020 (U.S. Geological Survey, 2026a; Figure 4-6). However, these data do not capture every surface water and groundwater withdrawal in the state. Public water systems that provide water to >25 people for industrial, commercial, thermoelectric, or domestic purposes (U.S. Geological Survey, 2026c) using surface water have the most strict reporting requirements, so water use for public water supplies (i.e., drinking water) are understood in the greatest detail. Conversely, approximately 40% of Vermonters rely on private drinking water supply from wells or springs (Vermont Department of Health, 2026d). This use is not reported and thus unaccounted for in current withdrawal data.
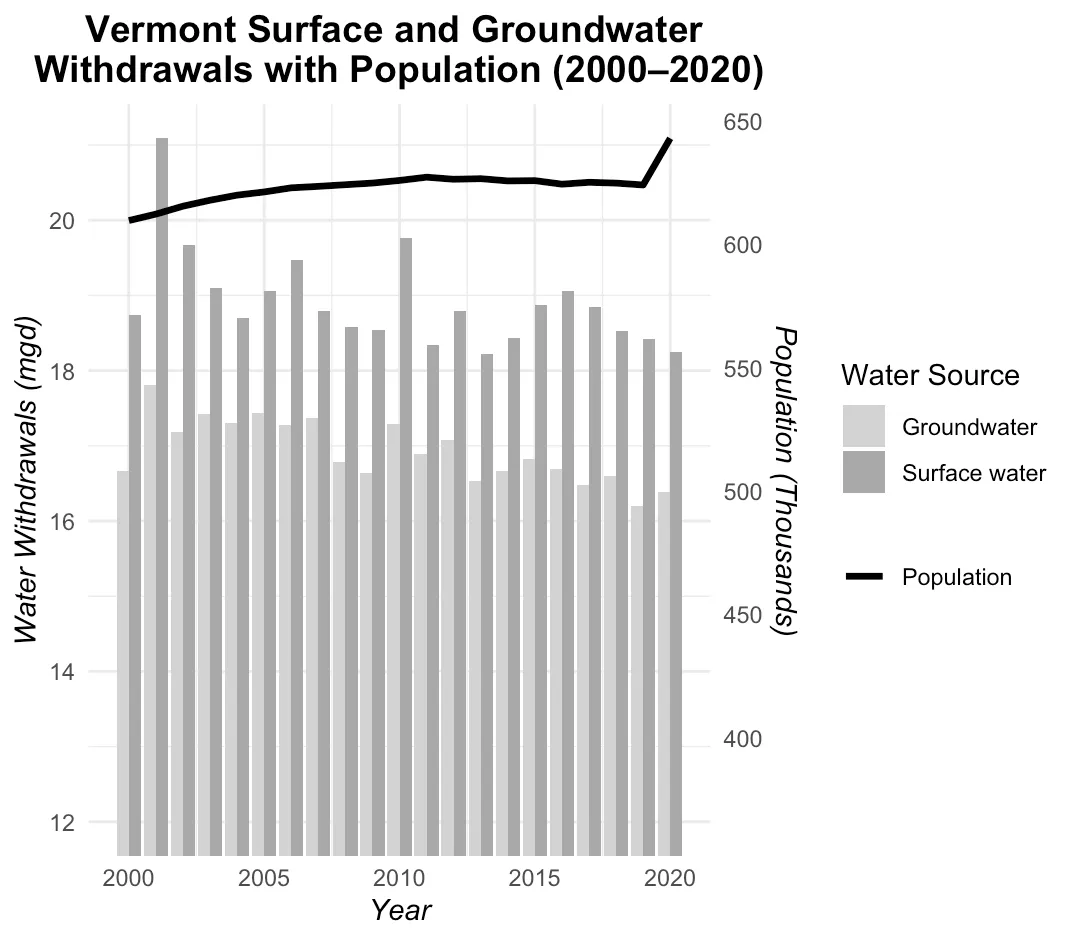
Source: USGS Public Supply Withdrawals Water Use Model (2026a), Federal Reserve Economic Data (FRED) (2026)
Act 199 (2008) declared groundwater a public trust resource stating that groundwater is for all Vermonters and thus needs to be protected (Greenwood et al., 2012). Act 199 requires any person withdrawing 20,000 gallons (75,708 liters) or more of groundwater per day (averaged over a month) to report to VT ANR. Additionally, groundwater withdrawals for commercial or industrial uses require permitting if groundwater withdrawals exceed 57,600 gallons (217,936 liters) per day with the VT Department of Environmental Conservation Groundwater Permitting Team (Groundwater Protection, 2008). The act excludes groundwater reporting from households, emergency purposes, farming, and dairy processing (Vermont Department of Environmental Conservation, 2026e). There have not been updates to groundwater reporting and permitting numeric thresholds since 2008 despite amendments to change language and management plans for monitoring and quality assessments.
Act 135 (2023) established a surface water reporting program to monitor and manage surface water withdrawals in Vermont, including any person withdrawing surface water of 10,000 gallons (37,854 liters) or more in a day or 150,000 gallons (567,811 liters) in a month to register and report to VT ANR (Act 135: Surface Water Withdrawals and Interbasin Transfers, 2023). Act 135 also requires surface water withdrawals of similar volume for agricultural purposes (e.g., irrigation) to register and report with the Vermont Agency of Agriculture, Food and Markets (Agency of Agriculture Food and Markets, 2026). Registration includes stating surface withdrawal location, frequency, and rate. Annual reporting includes total water withdrawn each month, withdrawal locations, daily maximum withdrawal for each month, and the date of daily maximum withdrawal (ANR, 2026). In 2024, the most common water uses from reported surface water withdrawals to VT ANR were “industrial use” (i.e., plywood manufacturing, biomass generation), “other” (i.e., for manufacturing packaging, paper mill) golf course irrigation, and snowmaking (Vermont Department of Environmental Conservation, 2025; Figure 4-7). While the thresholds and reporting requirements for snowmaking are defined in the 1996 Water Withdrawals for Snowmaking Rule instead of Act 135, snowmaking withdrawals are included in Act 135 surface water reporting (Vermont Department of Environmental Conservation, 1996).
As a relatively new program and data source, it is difficult to determine how climate change may be shaping trends in surface water withdrawals regulated by Act 135. Continued monitoring of these data will help determine how extreme events impact sectors like agricultural production, recreation and tourism, and energy generation.
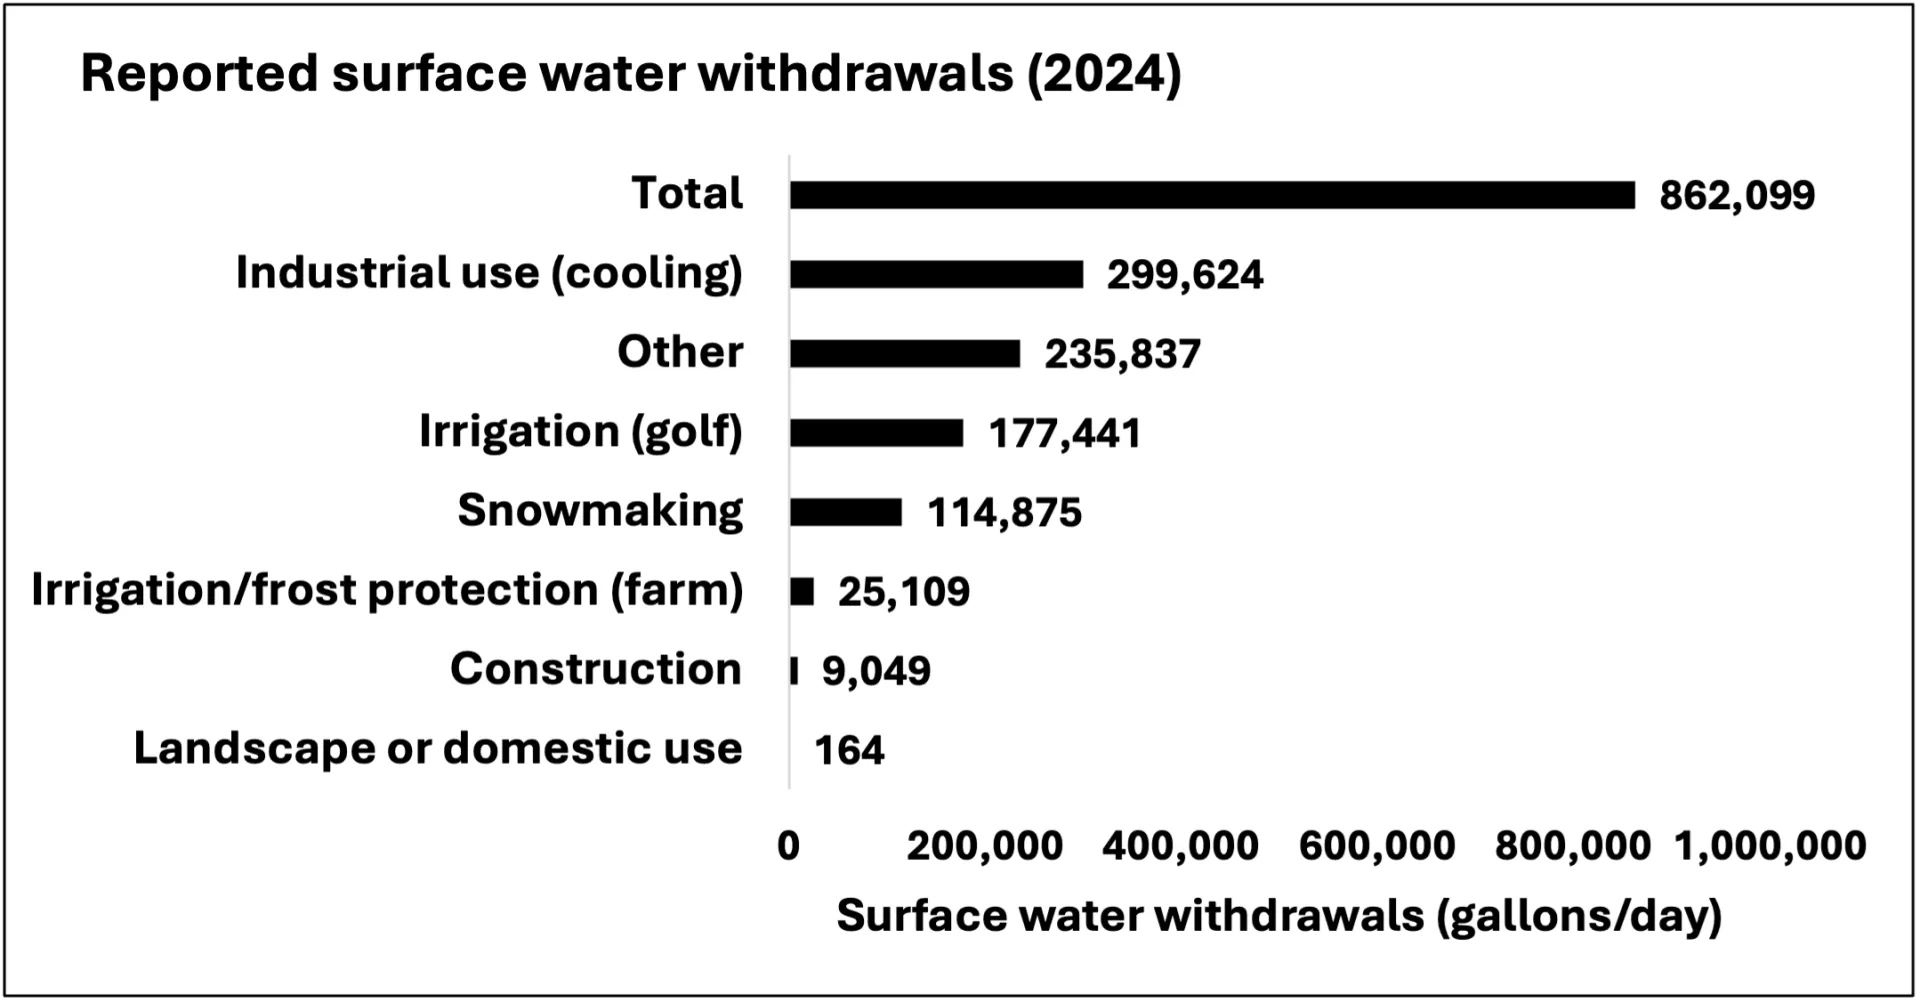
Source: Vermont Department of Environmental Conservation (2025)Note: While reporting is in total water withdrawn (gallons) for each activity (e.g., industrial use), data were divided by 365 to show withdrawals in gallons per day
Drinking Water
Droughts or floods can cause communities to lose access to drinking water due to water supply or water contamination. As previously stated, 40% of Vermonters access drinking water from private wells or springs (Vermont Department of Health, 2026d). Since wells draw from groundwater aquifers, changes to groundwater recharge (e.g., due to earlier and reduced snowmelt) have a serious impact on available drinking water for many Vermonters (Hyman‐Rabeler & Loheide, 2023; Williams et al., 2025). Loss of consistent access to drinking water can exacerbate existing inequities and vulnerabilities, such as chronic health issues (see Human Health 10.10).
The summer 2025 drought caused many water shortages with ramifications for private well users. Anecdotal evidence suggests that the use of water haulers was a popular short-term solution for drought-affected Vermonters, with the Vermont Department of Health noting that some water haulers were “booked out for several weeks” (Poux, 2025; Vermont Department of Health, 2026c). At the same time, there was an increase in the use of roadside springs for drinking water, but officials warned against consumption without proper preparation (e.g., boiling before consumption) out of concern for existence of E. coli, giardia, and other contaminants (Cutler, 2025; Vermont Department of Health, 2026b).
Contaminated water reduces short-term availability for consumers. Drinking water supplied by surface water is monitored by VT DEC because it is part of the public water supply; however, drinking water supplied by private wells is only monitored upon request and testing by the well owner (Vermont Department of Environmental Conservation, 2026k). For Vermonters that rely on private well water, it is suggested that testing drinking water quality happen routinely every five years or in response to local contamination concerns (Vermont Department of Health, 2025b). See 4.7.1 about how to request a household drinking water quality test kit and well assessment from Vermont Department of Health.
Agriculture
Changes in the timing and quantity of water availability due to climate change may impact farmers’ ability to water their crops (often for feed) and livestock. Historically, Vermont agricultural water use has been largely supplied by precipitation and surface water, but changes in water availability (i.e., reduced precipitation) can cause farmers to rely more on irrigation that could come from groundwater. In 2024, four farms—Lewis Creek Farm, Berry Creek Farm, Dutton Berry Farm, and S. Mazza Farm, Inc.—met the Act 135 withdrawal threshold (Vermont Department of Environmental Conservation, 2025a). From those four farms, 8.3 million gallons (roughly 31 megaliters) of water were withdrawn for irrigation and frost protection (Figure 4-7). U.S. Department of Agriculture (USDA) agricultural census data from 2025 indicates that 0.6% of all croplands in Vermont—1,164 out of 194,119 hectares—are actively irrigated, which is lower than census data from 2021, when 1.42% of all croplands were actively irrigated (United States Department of Agriculture, 2024). This change may have been due to wetter conditions since 2021 or changes in farm management practices. Drought conditions can cause farmers to outsource water for livestock and crop production (Gaffney, 2026). Many farmers reported the needed to haul water from off their property during the summer drought in 2025 (Figure 4-8; see Agriculture and Food Systems 6.3 and 6.4).
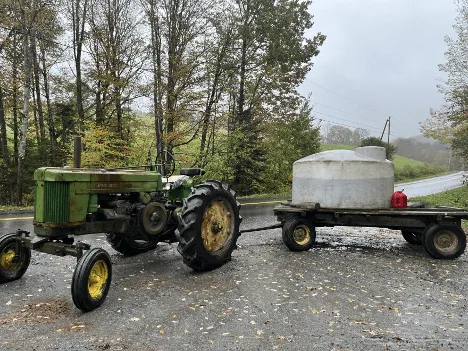
Source: Sabine Poux, Vermont Public (2025)
Energy
Drought and flooding can impact generation of hydroelectric energy. In 2023, Vermont sourced 57% of its energy production (120,000 Megawatt/hour) from hydroelectric power, with a large portion coming from Quebec (United States Energy Information Administration, 2026). Hydroelectric power relies on sufficient flow of surface waters so low flow conditions, such as occur during a drought, can negatively impact hydroelectric energy generation (Blackshear et al., 2011). Although specific numbers were not available at the time this chapter was written (December 2025), state officials noted that drought conditions did reduce hydroelectric energy generation for Vermont in summer/fall 2025 (Maloney, 2025) and in Quebec (Ouranos, 2025; see Energy 8.4.2).
High flow and flooding conditions can damage or overwhelm dams, which also disrupt energy generation. Older dams or those in disrepair are especially vulnerable and common across Vermont (see Infrastructure 7.6). Summer 2023 flooding impacted many dams across the state (D’Auria, 2024). VT DEC estimates that 57 dams were overtopped by floodwaters and five dams in Woodbury, Wallingford, Peru, Cabot, and Washington failed and were effectively destroyed (D’Auria, 2024; Figure 4-9). Morrisville Water & Light reported over three million in damages following summer 2023 flooding; two of the three hydroelectric dams owned by the utility were unable to generate electricity for several months following the floods (News & Citizen, 2023).
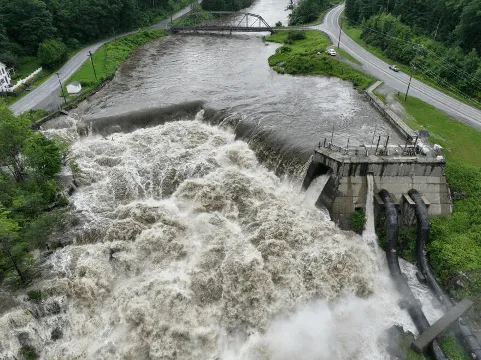
Source: Photo credit to University of Vermont Spatial Analysis Lab, the Agency of Transportation, and the Civil Air Patrol, Vermont Public (2023)
Recreation
Vermont’s recreation and tourism sectors rely heavily on water availability for golf course irrigation, snowmaking, boating, fishing, and swimming. Based on Act 135 reporting in 2024, approximately 290 thousand gallons per day (1.1 million liters per day) were withdrawn from surface water for recreational activity (i.e., golf course irrigation, snowmaking; Vermont Department of Environmental Conservation, 2025; Figure 4-7). Reported withdrawals increased between 2023 and 2024 likely due to drier conditions in many parts of the state in 2024 (Vermont Department of Environmental Conservation, 2025a).
During periods of drought and flooding, impaired access to water may reduce recreational activities, which can negatively impact outdoor recreation and tourism (see Outdoor Recreation and Tourism 9.2.4). Summer 2023 and 2024 flooding events impaired trails and road networks and created unsafe short-term conditions in waterbodies due to debris and high water levels (Vermont Public, 2024). Long-term flooding reduces water quality over time and ultimately decreases access to water resources (e.g., beach closures from harmful algal blooms (HABs); see 4.5.5; see Outdoor Recreation and Tourism 9.5.2 and Human Health 10.7). While the summer 2025 drought did not set a record lowest lake level for Lake Champlain, there were reports of problems with docks reaching the water, paddle boarders accessing different entry points, and boats stranded along the shore (Jones, 2025).
4.3.4 Opportunities for adaptation
Both groundwater and surface water withdrawals across the state of Vermont lack complete long-term data needed to monitor change and predict future water use for adaptation planning. Data gaps and biases limit assessments of how climate change has impacted water resources in space and time. Enhanced collaboration and planning amongst officials managing water usage can narrow the data gap and help communities prepare for changes in water use and supply (United States Environmental Protection Agency, 2015). Town planners need data from local water use monitoring to inform decision making, including whether new water sources are needed. Prior to 2023, Vermont lacked a surface water reporting system with the exception for snowmaking. Act 135 was the product of a statewide initiative to fill the knowledge gap on state water withdrawal information beyond snowmaking surface water uses (ANR, 2026).
Farmers are especially vulnerable to changes in water availability and have been repeatedly impacted by extreme weather events in recent years (see Agriculture and Food Systems 6.4 and 6.5). Government resources, including disaster relief funding, can help address flood damages and loss of crops on farms (Vermont Agency of Agriculture, Food and Markets, 2025). During the summer 2025 drought, farmers were directed to water hauling businesses; VT DEC’s website now includes a list of those businesses for future need. Additional investments can aid farmers in their efforts to proactively adapt to changes in water availability (see Agriculture and Food Systems Table 6-1).
Individuals can make decisions to limit water usage and conserve water during periods of drought and flooding. They may reduce household water consumption by checking leaky pipes, testing for toilet leaks, taking short showers, and limiting lawn or garden watering. Planting native, less water-demanding plants, and opting to use collected rain water for watering can also help reduce household water usage (Lake Champlain Committee, 2026). These small household practices can have an especially large impact during dry periods— when water availability is reduced—and during wet periods—when water quality is lowered and existing water infrastructure is overtaxed with floodwaters. Because dry and wet conditions can be spatially and temporally variable across the state, it is important for individuals to check their town's notices for safe water consumption in the household.
4.4 Flooding
Increases in extreme streamflow conditions (see 4.3.1) will likely translate to localized flooding, which can damage infrastructure and agricultural production, impact human health, and alter outdoor recreation and tourism. Periods of high streamflow can affect water resources by transporting sediment, nutrients, and debris downstream. Extreme streamflow often erodes stream banks and ultimately degrades water quality. This section details historic flooding events that continue to shape Vermont’s communities and water resources and describes consequences of extreme streamflow.
4.4.1 Historic Vermont flooding events
Flooding is historically the costliest natural disaster type in Vermont (Spasyk, 2025). Vermont ranked fourth in the U.S. for post-disaster federal assistance at a total of $902 per capita and seventh in the U.S. for number of disaster declarations (n=25) between 2011 and 2024 (Rebuild By Design, 2026). Montpelier and Waterbury are consistently the most impacted towns by flooding, with Washington County ranked first in the nation for number of disaster declarations (n=22; National Weather Service, 2026; Rebuild By Design, 2026). Three other Vermont counties appear in the top ten list of counties with the highest disaster declarations: Lamoille County (17 disasters), Essex County (16 disasters), and Orleans County (16 disasters; Rebuild By Design, 2026).
Topography, infrastructure, development within river corridors, and precipitation regime are major contributors to historic flooding costs (Betts, 2011; Dingman, 1981; Spasyk, 2025; see Community Development 11.5). Both inundation, or river, flooding and fluvial erosion contribute to flooding costs, with fluvial erosion contributing to more than 75% of historic flood damages (The Nature Conservancy, 2026; Vermont Emergency Management, 2023). Inundation flooding occurs when streams overtop their banks, while fluvial erosion occurs when fast-moving water within a stream channel erodes and transports sediment, rocks, and/or vegetation downstream. Historic development within river corridors makes many Vermont cities and towns vulnerable to both inundation flooding and fluvial erosion.
The 1927 flood, which occurred November 3–4, 1927, is the most damaging statewide flood on record in Vermont (Vermont Historical Society, 2026). Excess precipitation on saturated soil, dormant vegetation, frozen soil, and high stream water levels from previously wet conditions were responsible for the damage caused. Bolton, Montpelier, and Waterbury were most impacted. Accounts from the event describe a foot of mud at the doorstep of every building in Montpelier. In response, the US Army Corps of Engineers (USACE) and Civilian Conservation Corps (CCC) built three major flood control dams in the Winooski River basin to control future flood risk: the East Barre Dam, Wrightsville Dam, and Waterbury Dam (Bushnell, 2021).
Tropical Storm Irene (2011) resulted in another statewide flood disaster with severe flash flooding. Irene moved through Vermont in a 24-hour period, dropping up to roughly 8 inches (20 cm) of rain in some parts of the state (Baird, 2021). Southern and central Vermont experienced the worst of the storm and subsequent flooding. All but Essex and Grand Isle counties were declared federal disaster areas (Baird, 2021). This event damaged over 310.4 miles (804 km) in roads and 200 bridges (Baird, 2021). Towns were cut off from receiving aid due to destroyed roads and bridges (Vermont History Explorer, 2026). The National Guard was deployed to reach and deliver goods to communities. The storm had a lasting impact on Vermont and resulted in many towns developing plans to reduce future flood damages (Vermont History Explorer, 2026). For example, the town of West Fairlee passed a flood risk mitigation plan to both restore and prevent further damage to natural systems and infrastructure (Two Rivers-Ottauquechee Regional Commission & Town of West Fairlee, 2019). Other state initiatives included creating the “Vermont Strong” license plate to fund flood relief for Vermonters impacted. The license plates were brought back following the July 2023 flooding as a way to raise more money for flood recovery (Associated Free Press, 2023).
In 2023 and 2024, Vermont experienced several damaging flood events. The July 2023 flood resulted from 3–9 inches (8-23 cm) of rain falling in a 48-hour period (New England Water Science Center, 2024; Figure 4-10). For context, heavy precipitation days are days where rainfall exceeds 1 inch (25.4mm) in a 24-hour period. In preparation for the July 2023 flooding, Vermont Emergency Management called the event “historic” and “catastrophic,” alluding to the damage that would follow. Rainfall from the July 2023 event was similar in magnitude and extent to that of Tropical Storm Irene in 2011 and led to flooding in most parts of the state, especially central Vermont, including Montpelier and Barre. Streamflow records showed that many main-stem rivers established new record stage heights, namely on the Winooski, Missisquoi, Passumpsic, Dog, and Black rivers. In Montpelier, the stage height was two feet (0.6m) higher than it was during Tropical Storm Irene at 21.35 ft (6.5 m). Flash flooding occurred mainly on the eastern slopes of the Green Mountains in Londonderry, Weston, Ludlow, and Hardwick (New England Water Science Center, 2024; United States Geologic Survey, 2026).
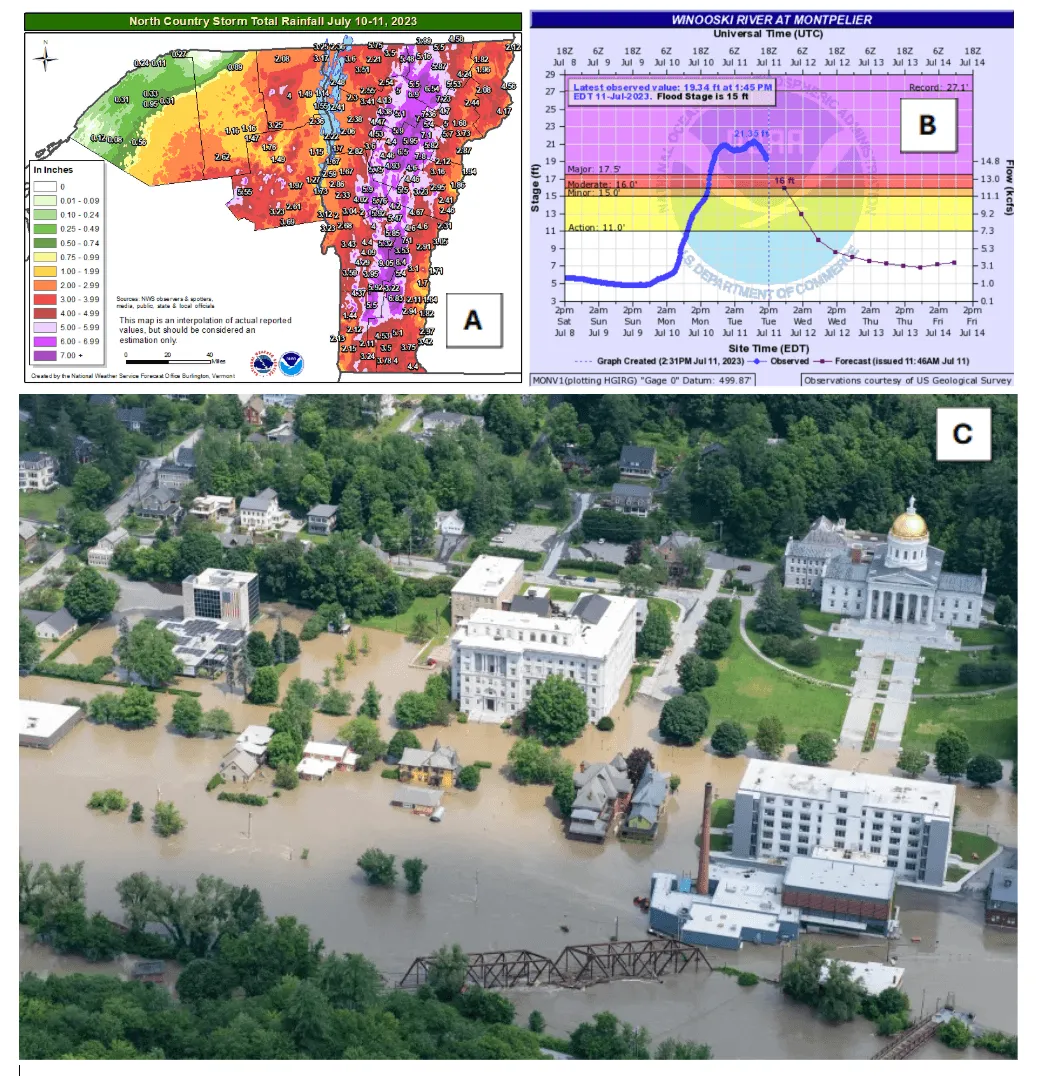
Sources: (A) and (B) Banacos (2023); (C) Photo credit to U.S. Department of Defense, Air Force Senior Master Sgt. Michael Davis, NASA Applied Sciences (2023)
A second major flooding event in December 2023 compounded impacts from the July 2023 flooding. Although both 2023 events resulted from excessive precipitation, the December event was characterized by several unique factors: rapidly melting snowpack from warm air and dewpoint temperatures, ROS-caused runoff, and dormant vegetation not taking up much water (Goff, 2023). The December 2023 flooding event was over a very short time period (approximately 12–18 hours). During this event, the Lamoille River in Jeffersonville and Johnson and the Winooski River in Essex Junction reached major flood stage, and the Winooski River in Waterbury and Montpelier, Mad River in Moretown, Otter Creek in Rutland, and Passumpsic River in Barnet reached moderate flood stage (Dockser et al., 2023). The Lamoille, Otter Creek, Passumpsic, and Winooski basins all experienced the greatest flooding impacts (Goff, 2023).
Flooding in July 2024 again impacted Vermont communities. On July 30, 2024, an extreme nocturnal rainfall and flash flooding event brought heavy rainfall to parts of Orleans, Caledonia, and Essex counties in the Northeast Kingdom (Goff & Banacos, 2024); rainfall intensities exceeded two inches (51 mm) per hour over an extended period and a weather station in St. Johnsbury recorded the highest single-day total rainfall (over eight inches; 203 mm) in their 130 years of recorded weather (Jarecki & Wilson, 2024). Damages from this event included flooding in over 42 homes, 16 bridges, numerous road washouts, and several landslides (Goff & Banacos, 2024; see Infrastructure 7.3.2 and 7.4.1). Compared to the July 2023 flooding event, the July 2024 event was more localized though the communities that were impacted had similar or worse flood damages compared to communities affected by the July 2023 floods (Goff et al., 2024).
All three of these storms—July 2023, December 2023, and July 2024—caused many rivers in Vermont to surpass National Weather Service flood stages, inundating floodplains, eroding streambanks, initiating landslides, and damaging infrastructure (Goff et al., 2024). These events heightened public awareness and perception of flood risk in the state and highlighted the risk to lives and livelihoods caused by extreme precipitation due to climate change (Munson, 2024; see Community Development 11.5).
4.4.2 Flood mapping
The U.S. Federal Emergency Management Agency (FEMA) creates maps, in primarily developed areas, to estimate flood risk to structures near water bodies. These maps support the establishment of insurance rates through the National Flood Insurance Program. FEMA flood maps represent modeled flood events with an estimated 100-year recurrence interval, often referred to as a "100-year storm.” A 100-year storm is a storm that, based on historical data and statistical analysis, has a 1% annual exceedance probability or a 1% chance of being equaled or exceeded each year. Thus, FEMA flood maps are an indication of historical flood risk across the country (see limitations of FEMA maps below). Vermont is currently updating flood maps for the entire state, and in many towns this update will be the first update since the 1970-80s (Flood Training, 2026a). Map updates will be rolled out in stages for the entire state, with some going into effect as soon as 2027 (Flood Training, 2026a). Updated mapping means that towns will have greater access to disaster funds and be able to plan for reduced development in newly identified high-risk areas (Flood Training, 2026a).
The USGS calculated the return period of the July 2023 flood to be a 100 to 500 year event (0.2–1% exceedance) at stream gauges near Montpelier and Johnson (Smith et al., 2025; Figure 4-11). Aerial imagery from these locations aligns closely with current FEMA flood maps, suggesting that in these locations the FEMA flood maps are a good indicator of a 100-year storm. Further analysis on other impacted areas is beyond the scope of the Vermont Climate Assessment, but this kind of research has been expanded by the University of Vermont (UVM) Spatial Analysis Lab for July 2023 and July 2024 flood events (Munson, 2024). Capturing this type of post-storm imagery in the future can support ground-truthing FEMA maps when coupled with stream gauge exceedance calculations.
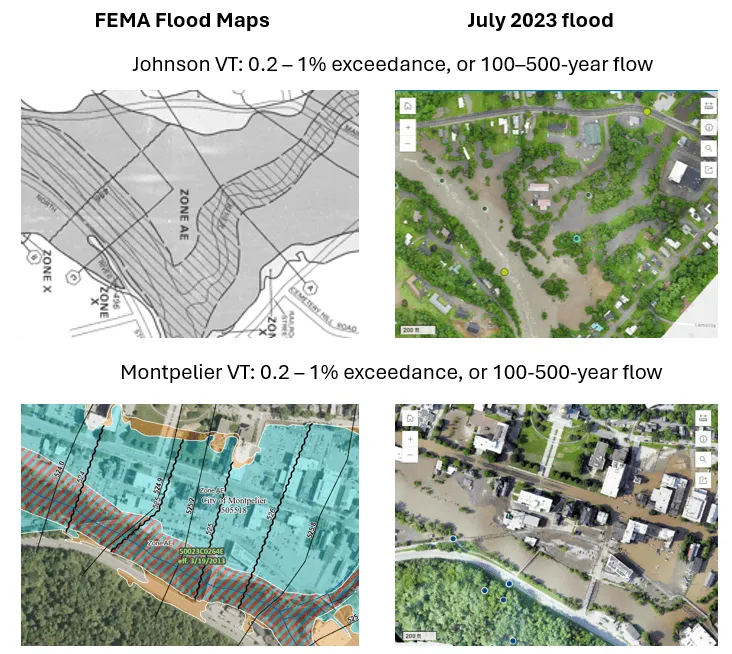
Sources: FEMA (2024); Smith et al. (2025); UVM Spatial Analysis Lab & Vermont Agency of Transportation (2024)
Limitations with FEMA flood mapping and climate change processes
FEMA maps currently do not account for projected changes in runoff dynamics exacerbated by climate change. FEMA maps only account for inundation, or river, flooding and exclude erosional hazards (common in mountainous settings, such as Vermont) and precipitation-based hazards (e.g., flash flooding). Vermont has maps of erosional hazards along river corridors (Flood Ready, 2026a), but these hazards are not captured in FEMA’s flood insurance program. Due to these unmapped flood hazards, many homes and businesses may still be susceptible to flood damages, even with updates to Vermont’s FEMA maps. Researchers have estimated that in the continental U.S., at least 41 million people live in the 100-year floodplain compared to estimates of only 13–23 million people based on current FEMA maps (Qiang, 2019; Wing et al., 2022).
FEMA maps are not the only way to understand flood hazards. Greater use of drones and availability of high-resolution satellite imagery can aid communities in understanding and ground-truthing flood risk. Further, recent advances in modeling flood-frequency curves can better capture the dynamic nature of flooding under climate change conditions (Awasthi et al., 2022). Researchers in Vermont can aid communities by running advanced models at relevant decision-making scales and providing their results through digestible, publicly accessible platforms. In addition, organizations such as First Street Foundation are creating flood risk maps that account for future climate change scenarios and all three types of flooding (i.e., inundation, precipitation, and coastal; Bates et al., 2021). These maps are publicly available through some real estate companies, including Zillow, to help homebuyers determine their flood risk before purchasing a home. In September 2025, Vermont’s Act 52 “Flood Risk Disclosure” went into effect; this act requires all real estate transactions to disclose any flood risks associated with the property (Flood Ready, 2026b).
4.4.3 Floodwater attenuation in floodplains and wetlands
Floodplains and wetlands attenuate floodwater by reducing flood peaks and lowering flood levels (Tull & Passalacqua, 2025). Changes to streams, such as from urban development, can alter the size and shape of floodplains. In Vermont, changes in stream morphology can exacerbate flood hazards because many rivers and streams no longer conform to their natural, equilibrium shape (Kline & Cahoon, 2010). A majority of Vermont streams have been modified to accommodate human practices that straighten channels or limit access to floodplains (Kline, 2016). Modified streams often have reduced lateral connectivity of floodwaters (e.g., connectivity to surrounding floodplains and wetlands), concentrating water within the channel and increasing the erosional force during high-flow events (SLR Consulting et al., 2023). Over 1,350 miles (2,170 km) of stream channels have been assessed in Vermont and approximately 75% of those channels surveyed have lost the ability to inundate their floodplains, especially during spring melt (Abdulhadi, 2024; Kline & Cahoon, 2010). River equilibrium is a balance between sediment transport and flow (Vermont Agency of Natural Resources & Vermont Department of Transportation, 2026). When changes to flow or sediment in a surrounding landscape or in the river occur, a river can enter disequilibrium, resulting in channel evolution processes and greater potential for flood damages (Vermont Agency of Natural Resources & Vermont Department of Transportation, 2026). One example of a Vermont river in disequilibrium is the Winooski River, due to the construction of Interstate 89 around the stream channel. Conversely, Otter Creek has limited surrounding development along large stretches, allowing it to maintain equilibrium (Bear Creek Environmental, LLC, 2025; Watson et al., 2016; Figure 4-12).
Wetlands, both within and isolated from floodplains, mitigate flood risk in Vermont, especially as the state faces increasing precipitation and flood risk (Vermont Department of Environmental Conservation, 2023). Healthy wetlands help buffer the impacts of floods by storing floodwaters and slowing their flow into rivers and streams. Importantly, the floodwater storage of wetlands is legally protected in Vermont due to their critical nature in reducing flood risk (State of Vermont, 2024). This demonstrates that the essential role of wetlands for climate resilience and flood mitigation is recognized in Vermont (Vermont Department of Environmental Conservation, 2023).
In watersheds where wetlands have been lost, flood peaks may increase by as much as 80% (Vermont Department of Environmental Conservation, 2026l). Research in the Otter Creek basin suggests that wetlands reduce flood inundation costs by as much as 92% and reduce peak flow, especially during large flood events (Watson et al., 2016), confirmed further during recent storms (Lachapelle et al., 2025; Figure 4-12). Expanded wetland mapping for the Vermont Significant Wetlands Inventory (VSWI) is underway and will be completed in 2026 (Vermont Department of Environmental Conservation, 2026m). Updated wetland mapping will denote key wetland characteristics (e.g., hydric soils, flood hazard zones, standing water, vernal pools) and help protect significant wetlands from future development, thereby decreasing communities’ future flood risk (Vermont Department of Environmental Conservation, 2026m).
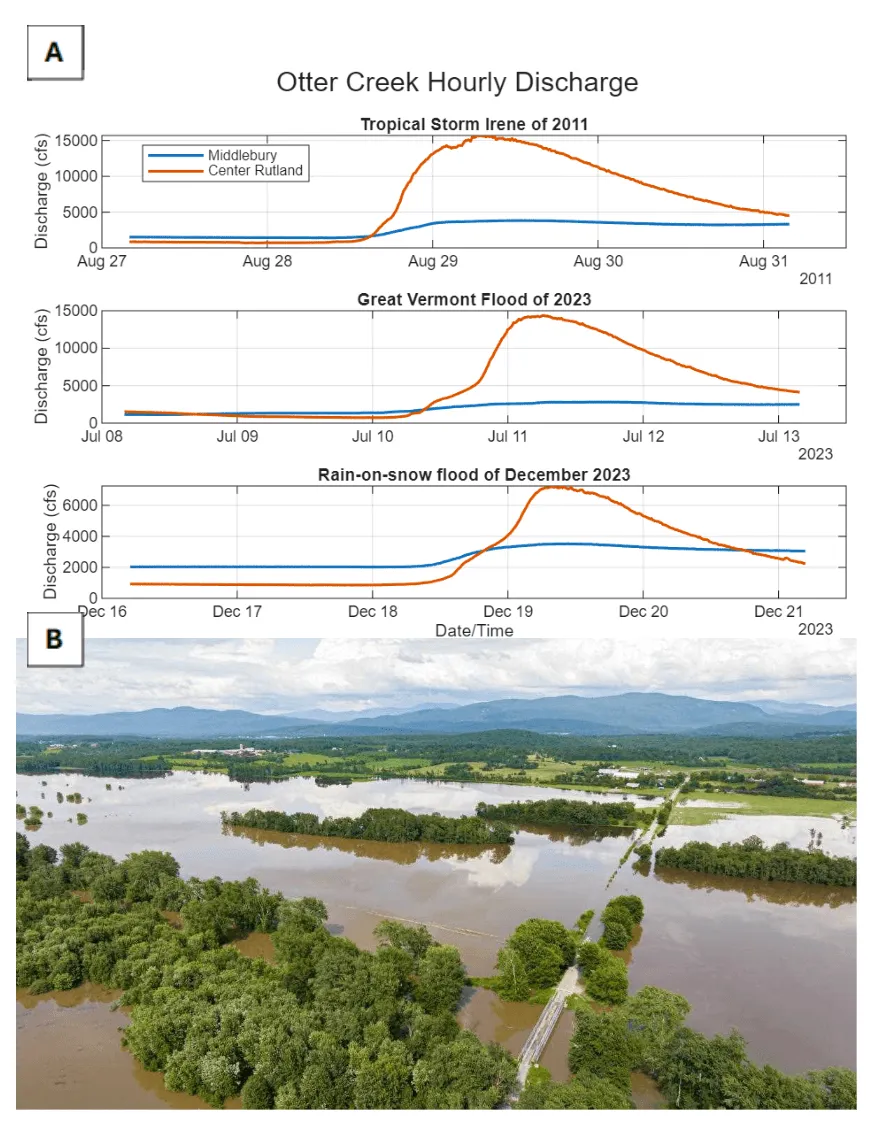
Source: A) U.S. Geological Survey (2026b); B) Photo credit to Chris Ingram, Fly Fisher (2023)
4.4.4 Erosional hazards
Erosion that occurs within streambanks and beds (i.e., fluvial erosion; Figure 4-13) as well as along hillslopes (e.g., landslides, gullies) can create additional flood hazards for Vermonters or exacerbate existing flood damages (Vermont Emergency Management, 2023). Many historic flood damages were caused by fluvial erosion (The Nature Conservancy, 2026; Vermont Emergency Management, 2023; see 4.4.1) and the 2023 Vermont State Hazard Mitigation Plan ranks fluvial erosion as the state’s top hazard (Vermont Emergency Management, 2023).
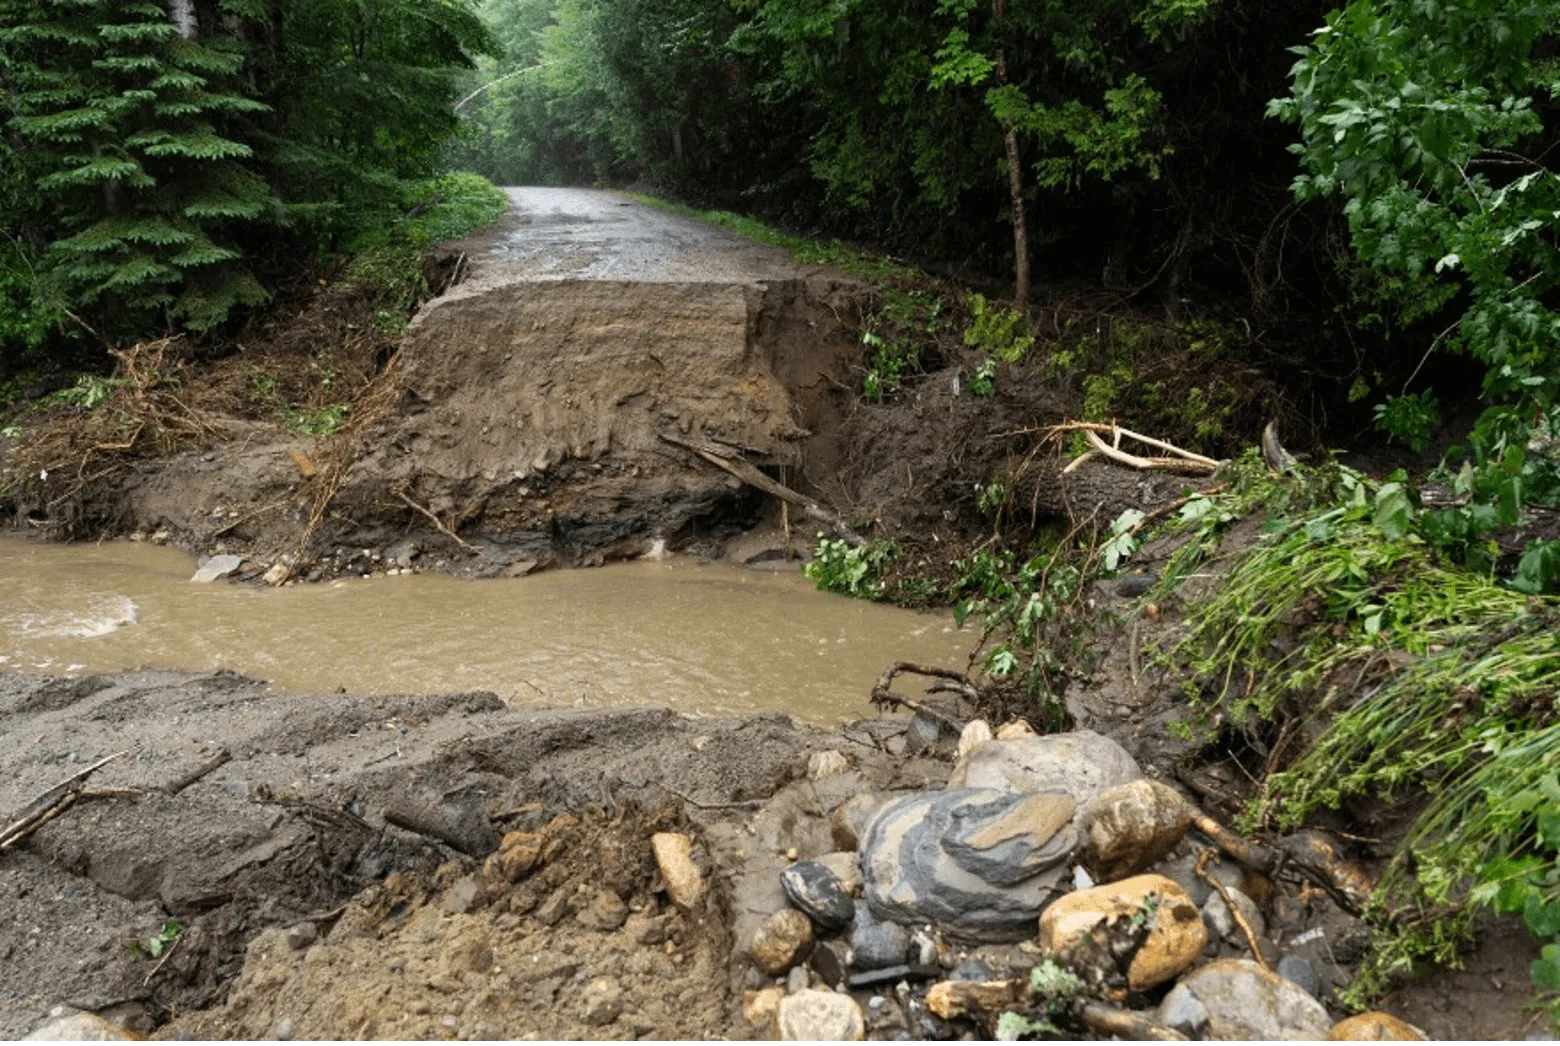
Source: Photo credit to Brian Steveson, Vermont Public (2025)
Landslides occur when hillside soils and sediments become saturated with water, causing them to slide downhill, largely driven by gravity. Extreme precipitation events can cause landslides, which can damage homes and block roads. Vermont’s landslide inventory is published every five years. In its last update (2020), a total of 3,049 landslides were reported since the start of recording in 2006 (Springston, 2021; Springston et al., 2023). The inventory details the failure types, for example gullying (i.e., channel formation downhill due to fast moving water) and mass failures (i.e., soil and rock movement downslope; Vermont Agency of Natural Resources, 2026a). Hotspot analysis of all landslide types show they repeatedly occur in the same places: Montpelier, Barre, and St. Albans (Figure 4-14). Landslides do not only occur in exclusively high relief and high elevations in Vermont; gullying, mass failures, and landslides occur along Lake Champlain’s coast and in valleys on the eastern part of the state. Geologists conclude that most landslides in the state occur near rivers and are driven at least partially by heavy rain events and/or snowmelt and are likely to reoccur after large floods (Springston et al., 2023).
Flooding in July 2023 caused 82 separate landslides across the state, demonstrating the heightened risk of landslides when heavy rainfall occurs on top of already-saturated soils (Crowley, 2023; Giles, 2024). In comparison, the July 2024 flood resulted in 20 landslide reports across the state (Cotton, 2024). Recent research shows that landslide impacts persist long after the flooding event (Dethier et al., 2025). For example, landslide scars were still eroding at least 8 years post-Irene and contributing more than 1000 times the average erosion rates for the watersheds where landslides occurred. Landslides from July 2023 and 2024 flooding will likely continue to contribute sediment downstream for years to come.
Areas that experience repeated flood events may also experience repeated landslides over time, especially when those areas are also highly developed. For example, Burlington’s Riverside Avenue has experienced at least 20 landslides in a less-than-one-mile extent over the past 70 years (Bennet & Bierman, 2024; McDonald, 2024). Plant roots can help stabilize soil; therefore maintaining riparian buffers and reforesting floodplains is a mitigation strategy to reduce landslide risk (Ziemer, 1981). Researchers at UVM suggest native plantings alongside Riverside Avenue to stabilize the slope and reduce erosion (Bennet & Bierman, 2024). However, landslides are still reported in many forested areas of the state, indicating that while plant roots may help mitigate risk, they do not eliminate it.
Gullies are another erosional hazard that create steep channels caused from moving water such as rain or snowmelt (Bernard et al., 2026). In Vermont, active gullies are more common near urban areas (Springston et al., 2023). A 2021 landslide report for Caledonia County stated that actively eroding gullies were closely connected to stormwater runoff from roads and developed areas, likely exacerbated during flood events (Springston, 2021). In 2024, the Great Brook flood in Plainfield crosscut underlying geologic layers containing boulders and unconsolidated sediment, resulting in channel widening and reduction of streambank vegetation along multiple extents of the river (Springston, 2025). The Great Brook flood example highlights the significance of underlying geology to erosional hazards (Springston et al., 2023).
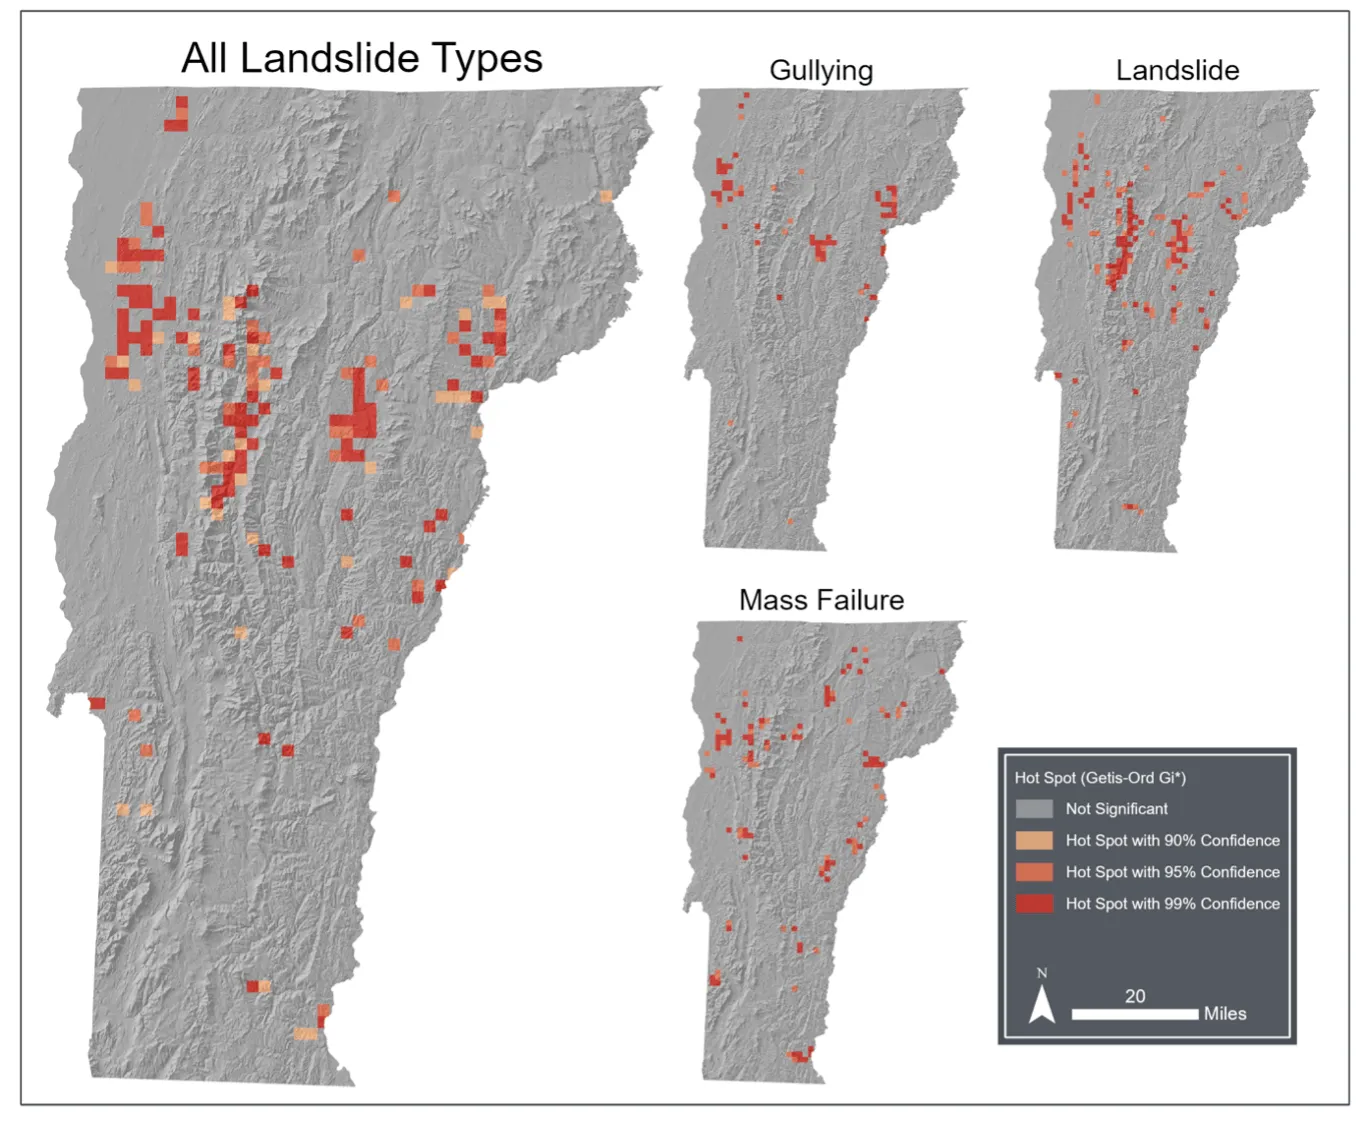
Source: VTANR Open Geodata Portal (2024)
4.4.5 Opportunities for adaptation
Vermont passed the Vermont Flood Safety Act of 2024 (Act 121, State of Vermont, 2024) to update how flood risk is determined and how river corridors are managed. The act gives VTANR the authority to regulate proposed development in river corridors located in watersheds of 2 square miles (5.2 km²) or greater. It requires municipal floodplain management to have “no adverse impact,” which means that new structures built within floodplains cannot increase flood risk to other pre-existing structures in that same floodplain (i.e., by increasing water levels, channelizing, hardening, or otherwise modifying the river corridor; Flood Training, 2026b).
Act 121 also increases floodwater storage across the state by establishing a “net gain” rule of 2:1 for wetland restoration to wetland loss, meaning that any wetland lost due to development must be replaced by a new wetland with twice the area of the one that was lost (Vermont Department of Environmental Conservation, 2026n). It improves dam safety through increased oversight and maintenance requirements and enables dam removal in cases where the dam is a risk to public safety (Vermont Department of Environmental Conservation, 2026d; see Infrastructure 7.6). Act 121 spurred an update to the state’s Flood Ready VT website, created after Tropical Storm Irene, and explains flood risk and how Vermonters can prepare for future flood events (Flood Ready, 2026).
Locally, some communities are taking actions to better withstand future flood events. For example, a community may modify existing development, which is often less expensive than building new structures. Raising existing homes and businesses higher off the ground decreases flood risk without further decreasing the already limited housing stock in Vermont (Flood Ready, 2025; Mingle, 2025). Communities can employ nature-based solutions such as restoring and conserving river corridors to protect themselves from flood risk. For example, at Dog River Park in Northfield, native plantings, river connection points, and intentional park layout resulted in limited flood damages following the July 2023 flood. The park stored floodwaters for three days and reduced flood height in the nearby neighborhood by approximately six inches (15 cm; Noyes, 2023). Resources such as the Functioning Floodplains Initiative’s web-based data explorer serve as a decision-support system to help communities identify, prioritize, and track nature-based solution projects that improve flood resiliency within river corridors (see 4.7.2). This tool was developed based on two decades of river assessment work in Vermont and helps identify costs and benefits of restoring or conserving specific river corridors. Currently available in the Lake Champlain Basin, researchers at UVM are working to expand this initiative to river corridors across the state (K. Underwood, personal correspondence, November 17, 2025).
4.5 Water quality
Water quality in Vermont is often impaired by human activities that increase the presence and transport of pollutants across the landscape and into waterways (Vermont Department of Environmental Conservation, 2020). Rising temperatures and extreme events caused by climate change can further water quality degradation (Table 4-4).
Climate change driver | Water quality impact |
|---|---|
Increased water temperatures | Low oxygen conditions, decreased aquatic life habitat suitability, migration of certain aquatic species, increased algal blooms |
Increased precipitation and extreme events | Greater transport of nutrients and sediment during events, increased algal blooms |
Decreased snowfall | Decreased spring transport of nutrients, colder soils, increased winter transport carrying sediment and nutrients |
Increased winter rain | Earlier/midseason transport of nutrients and sediment, increased potential of algal blooms in summer months |
Source: This chapter
The LaRosa Partnership Program has enabled surface water quality testing throughout the state by financially and logistically supporting watershed organizers and monitoring groups since 2003 (Vermont Department of Environmental Conservation, 2026g). Data collected by the LaRosa Partnership Program is added to the VTDEC’s water quality database and aids in completing the VTDEC’s water quality monitoring goals stated in the Water Quality Monitoring Program Strategy for the entire state (Vermont Department of Environmental Conservation, 2026g). The tactical basin plans report the surface water quality testing results across the major basins in accordance with the Clean Water Act (Vermont Department of Environmental Conservation, 2026a).
Inland lake monitoring for the state has been conducted by the Volunteer Lake Monitoring Program since 1979 and the Inland Lake Assessment Program since 1977 (Vermont Department of Environmental Conservation, 2026f). In the Lake Champlain Basin, the Lake Champlain Long-Term Monitoring Program has measured physical, chemical, and biological water quality parameters (e.g., nitrogen, phosphorus, phytoplankton, cyanobacteria, dissolved oxygen, total suspended solids, and temperature) since 1992 (Vermont Department of Environmental Conservation, 2026c).
4.5.1 Sediment loading
Sediment loading is the transport of sediment by rivers downstream and is measured in mass of solids over time (e.g., kg/year). While some sediment-loading naturally occurs over time, human activities such as deforestation and development along waterways or within watersheds can rapidly increase sediment loading. Extreme weather events caused by climate change and subsequent fluvial erosion, landslides, and stream instability can also result in sediment loading (see 4.4.4). For example, the Mad River transported the same amount of sediment and phosphorus directly following Tropical Storm Irene as is usually transported over the course of an entire year (Ross et al., 2019). Following flooding in July 2023, Lake Champlain experienced reduced water clarity for two weeks due to sediment and pollution transport from upstream waters, impacting visual predation of aquatic predators (Lake Champlain Basin Program, 2024). Streambank erosion driven by streambank instability is present in over 50% of streambanks along the Missisquoi River(Langendoen et al., 2012), which transports around 36% (31,600 t/yr) of total suspended solids to the Missisquoi Bay. Additionally, soil freeze-thaw from warming winter conditions can increase streambank erosion, increasing sediment loading to downstream waters (Inamdar et al., 2018).
4.5.2 Nutrient loading
Climate change alters the abundance and transport of nutrients (e.g., nitrogen and phosphorus) in and through the environment (Lake Champlain Basin Program, 2024; Vermont Department of Environmental Conservation et al., 2023). The VTDEC monitors both phosphorus and nitrogen due to their negative impacts to water quality in the Lake Champlain Basin. While both are necessary nutrients for supporting plants and wildlife, increased loading from human development, extreme weather events, and agricultural practices promote the occurrence of HABs and the overall degradation in lake water quality (Lake Champlain Basin Program, 2024). Different parts of the lake have different phosphorus and nitrogen availability. A lake is considered nutrient-limited when the addition of that nutrient (e.g., nitrogen or phosphorus) stimulates more primary production from plants and algae. The Missisquoi Bay is considered more phosphorus-limited, while St. Albans is more nitrogen-limited (Warner et al., 2025). Thus, additions of limiting nutrients can promote algal growth in shallow extents of lakes affecting plants and wildlife, outdoor recreation, and human health (Warner et al., 2025).
Phosphorus loading
Phosphorus loading is strongly connected to sediment loading. Internal loading is defined as the release of already present or “legacy” nutrients in a waterbody (Figure 4-15). For phosphorus, internal loading comes from lake sediments and is the dominant source of phosphorus in Vermont lakes (Kirol et al., 2024). When low-oxygen water conditions exist, legacy phosphorus found in lake sediments can be released as microbes convert sediment-bound phosphorus to soluble phosphorus in the water column. As legacy phosphorus enters the water column, there is greater risk for eutrophication and the occurrence of HABs (Pettersson, 1998). Conversely, external loading is defined as nutrients entering a waterbody from the watershed. In Lake Champlain, external loading of phosphorus comes from streambank sediments in tributaries to Lake Champlain, like the Missisquoi River.
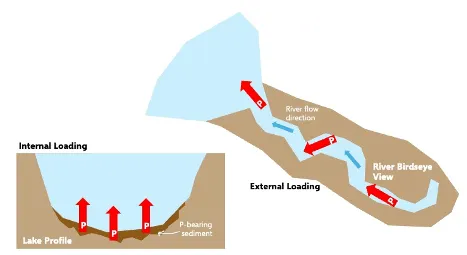
Source: Lake Champlain Basin Program (2024)
St. Alban’s Bay, Missisquoi Bay, South Lake A segment, Lake Carmi, and Lake Morey all exceed the total maximum daily load (TMDL) phosphorus loading limit and thus require mitigation projects to reduce internal and external loading of phosphorus (Foulon et al., 2020; Lake Champlain Basin Program, 2024; Vermont Department of Environmental Conservation, 2026e, 2026f). Lake Memphremagog experiences phosphorus-loading concerns and in 2017 was considered an impaired lake that needed to reduce phosphorus loading by 29% (Laitta et al., 2020; Vermont Department of Environmental Conservation, 2026b). Efforts to suppress internal phosphorus loading have been conducted at Lake Morey, Lake Carmi, and Ticklenaked Pond, and feasibility studies were conducted at St. Albans Bay and Missisquoi Bay. In 2020, Ticklenaked Pond was delisted from Vermont’s impaired water list after five years of water quality improvements to suppress internal loading of phosphorus (Vermont Department of Environmental Conservation, 2026).
Nitrogen loading
While Vermont’s water quality monitoring largely focuses on phosphorus and sediment due to its greater risk, nitrogen loading is still present in Vermont and can impair water quality. Expanding nitrogen monitoring and reduction requires identifying nitrogen sources and applying mitigation strategies where sources are high. Long Island Sound has experienced a TMDL exceedance of nitrogen since the 1990s resulting in low dissolved oxygen levels and algal growth (Vermont Department of Environmental Conservation, 2026c). The Connecticut River is a tributary to Long Island Sound and passes through Caledonia, Essex, Orange, Windham, and Windsor counties in Vermont. Vermont contributes 4% of nitrogen loads to Long Island Sound. Of the 4% of nitrogen load contribution from Vermont, 21% of nitrogen originates from agricultural land, 4% from developed land, 9% from point sources, and 65% from atmospheric deposition, which suggests industrial and agricultural emissions as sources. To reduce Vermont’s contribution to Long Island Sound’s TMDL nitrogen exceedance, Vermont partnerships and programs are tasked with monitoring and assessing conditions in the Connecticut River, which are detailed in the tactical basin plan for the Connecticut River (LIS TMDL Workgroup, 2013). As of 2021, at least 77% of the original initiatives from the 2014 report have been addressed and resolved with respect to improving water quality. These initiatives include agricultural nutrient management (e.g., no till, timing nutrient application, soil health assessments), stormwater nutrient management (e.g., three-acre general permit, identifying illegal discharge sites, upkeeping existing systems), wastewater nutrient management (e.g., upgrade failing systems to increase water treatment), and improving river connectivity (e.g., riparian buffer projects, forest restoration projects, land protections; Copans, 2021).
Warming winter’s influence on nutrient loading
Historically, cold regions like Vermont experience soil nutrient accumulation during winter months and nutrient depletion following spring snowmelt (Figure 4-16; Seybold et al., 2019). The timing of nutrient accumulation and depletion is important for maintaining healthy downstream water quality (Seybold et al. 2019; Sebestyen et al. 2009). However, increased winter runoff events caused by increased winter rainfall, ROS, and midseason melt can disrupt the timing of nutrient depletion by increasing nutrient loading earlier in the year. This can cause water quality concerns as plants are dormant and unable to absorb nutrients in winter, as compared to spring (Adair, 2024; Groffman et al., 2001; Seybold et al., 2019). In Vermont, increased winter runoff from midseason melt events is contributing 30–65% of the annual nitrogen load and 15–55% of annual phosphorus load across forested and agricultural landcovers to Lake Champlain (Adair, 2024). Under historically colder winters, these nutrient loads would occur during spring snowmelt not during winter. Greater winter nitrogen loads are also connected to higher winter streamflow and greater turbidity from the same winter runoff events (Fuss et al., 2016; Seybold et al., 2019). Runoff events from ROS are not only impacting Vermont: more than 40% of the contiguous U.S. is vulnerable to ROS-caused nutrient export, especially in the Northeast and Pacific Northwest (Seybold et al., 2022).
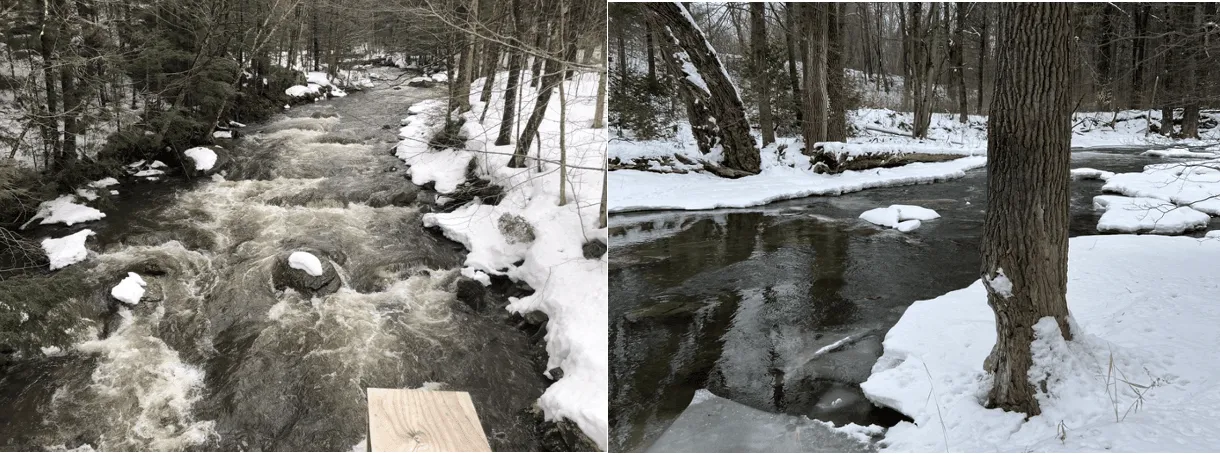
Source: Photo credit to (left) Sonya Vogel (2023) and (right) Saul Blocher (2023)
Warmer winter temperatures reduce snowpack and increase the number of bare soil days in the northeastern U.S. (Brooks et al., 2011; Contosta et al., 2019). Snowpack acts as an insulator to the soil; therefore, less snowpack reduces soil temperatures and increases soil freezing potential (Brooks et al., 2011; Wilson et al., 2020). Frozen soils act as impermeable surfaces and generate overland flow of water (Haupt, 1967; Hyman-Rabeler & Loheide II, 2023; Stuurop et al., 2022). At Sleepers River Research Watershed in northeast Vermont, overland flow and runoff increased with frozen ground during winter rain events, contributing to flood risk and transporting nutrients downstream more quickly (Shanley & Chalmers, 1999).
4.5.3 Changes in surface water temperatures
Increases in atmospheric temperatures are generally coupled with increases to surface water temperatures (Betts, 2011; Leach et al., 2023; Morrill et al., 2005). Temperature thresholds in both shallow and deep lakes are important indicators for algal bloom production. A study conducted on Missisquoi Bay found that an increase in surface water temperatures of 0.4°F (0.2°C) corresponded with increased bloom production; as small changes in surface water temperature can alter stratification and lake productivity (Isles et al., 2017). Since monitoring of Lake Champlain began in 1964 by the Lake Champlain Basin Program, Lake Champlain surface temperatures have increased by 6.8°F (3.8°C; Lake Champlain Basin Program, 2026). Between 1990 and 2020, the change in Lake Champlain mean August surface water temperatures was highest in the South Lake A segment, with Malletts Bay experiencing the second highest temperature change (Figure 4-17; Lake Champlain Basin Atlas, 2026). Additional data is available from local groups that conduct stream and lake temperature readings, like Friends of the Mad River and Forest Ecosystem Monitoring Cooperative (Forest Ecosystem Monitoring Cooperative, 2017; Friends of the Mad River, 2021). Future investments in long-term monitoring systems will help better document climate-driven changes to water temperatures (Peters-Lidard et al., 2021).
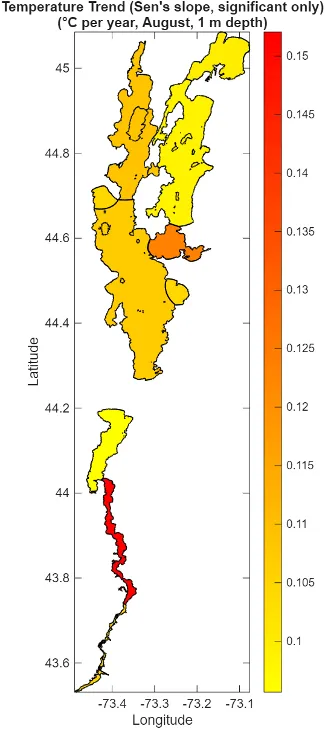
Source: Vermont Department of Environmental Conservation (2026h)
Water temperatures can impact environmental and human health (see Fish and Wildlife 5.4 and Human Health 10.7). Warmer water temperatures disrupt cold-adapted fish species’ habitat suitability, promote growth of bacteria and algae, accelerate pollutant-releasing chemical reactions, and hold less oxygen (Breitburg et al., 2018; Hodgkins & Dudley, 2011; Siskin & Katriztky, 1991).
Box 4-2: Lake Champlain froze over in 2026 for the first time since 2019
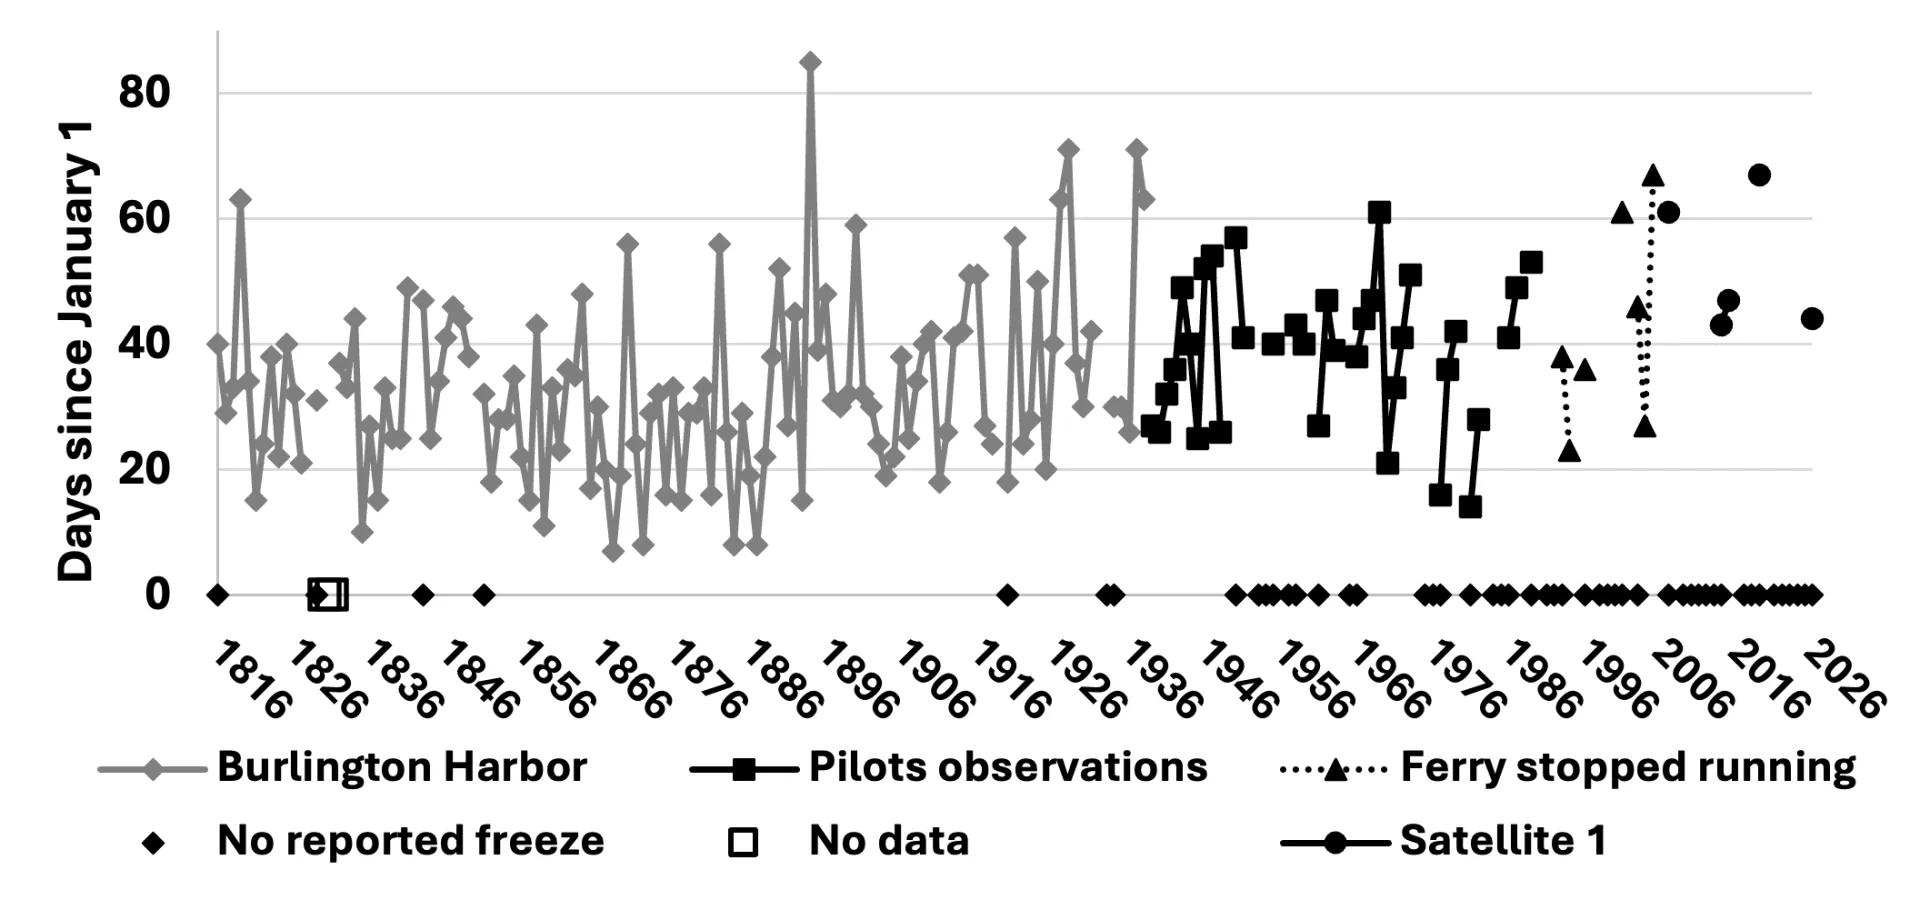
Source: NOAA (2026)
Note: Freeze over dates are compiled from multiple sources; to better understand potential biases and uncertainties associated with each data source, please visit NOAA (2026)
Lake Champlain froze over on February 13, 2026 for the first time since March 2019 (NOAA, 2026). In the past 40 years, it has become increasingly less likely for Lake Champlain to completely freeze over. Historical records (see “Note” above) show that closures on Lake Champlain happened almost every winter; now, ice closures happen around every five years. Lake Champlain is not the only lake experiencing this trend in Vermont; warming winter air temperatures and warmer water temperatures going into winter reduce the likelihood of freeze over for many lakes. Changes to ice cover alter access to recreational winter activities, including ice fishing, ice skating, and snowmobiling (Thomas, 2025; see Outdoor Recreation and Tourism 9.3.3). Thinner ice and less ice cover threaten the safety of individuals interested in ice-dependent winter activities (see Human Health 10.3.2).
4.5.4 Wetlands and filtration
Riparian wetlands, including those that have been restored, can act as sediment and nutrient sinks that attenuate large storm-driven nutrient pulses (Skinner 2022; Ardón et al. 2010). Wetlands can remove nitrogen from surface waters via denitrification and plant uptake (Martínez-Espinosa et al. 2021; Ardón et al. 2010), store phosphorus via sorption into wetland soils and plant uptake (Ardón et al. 2010; Weller et al. 1996), and retain pollutants such as heavy metals in wetland soils; these combined processes can greatly improve water quality (Ferreira et al. 2023; Weller et al. 1996; Saeed et al. 2021).
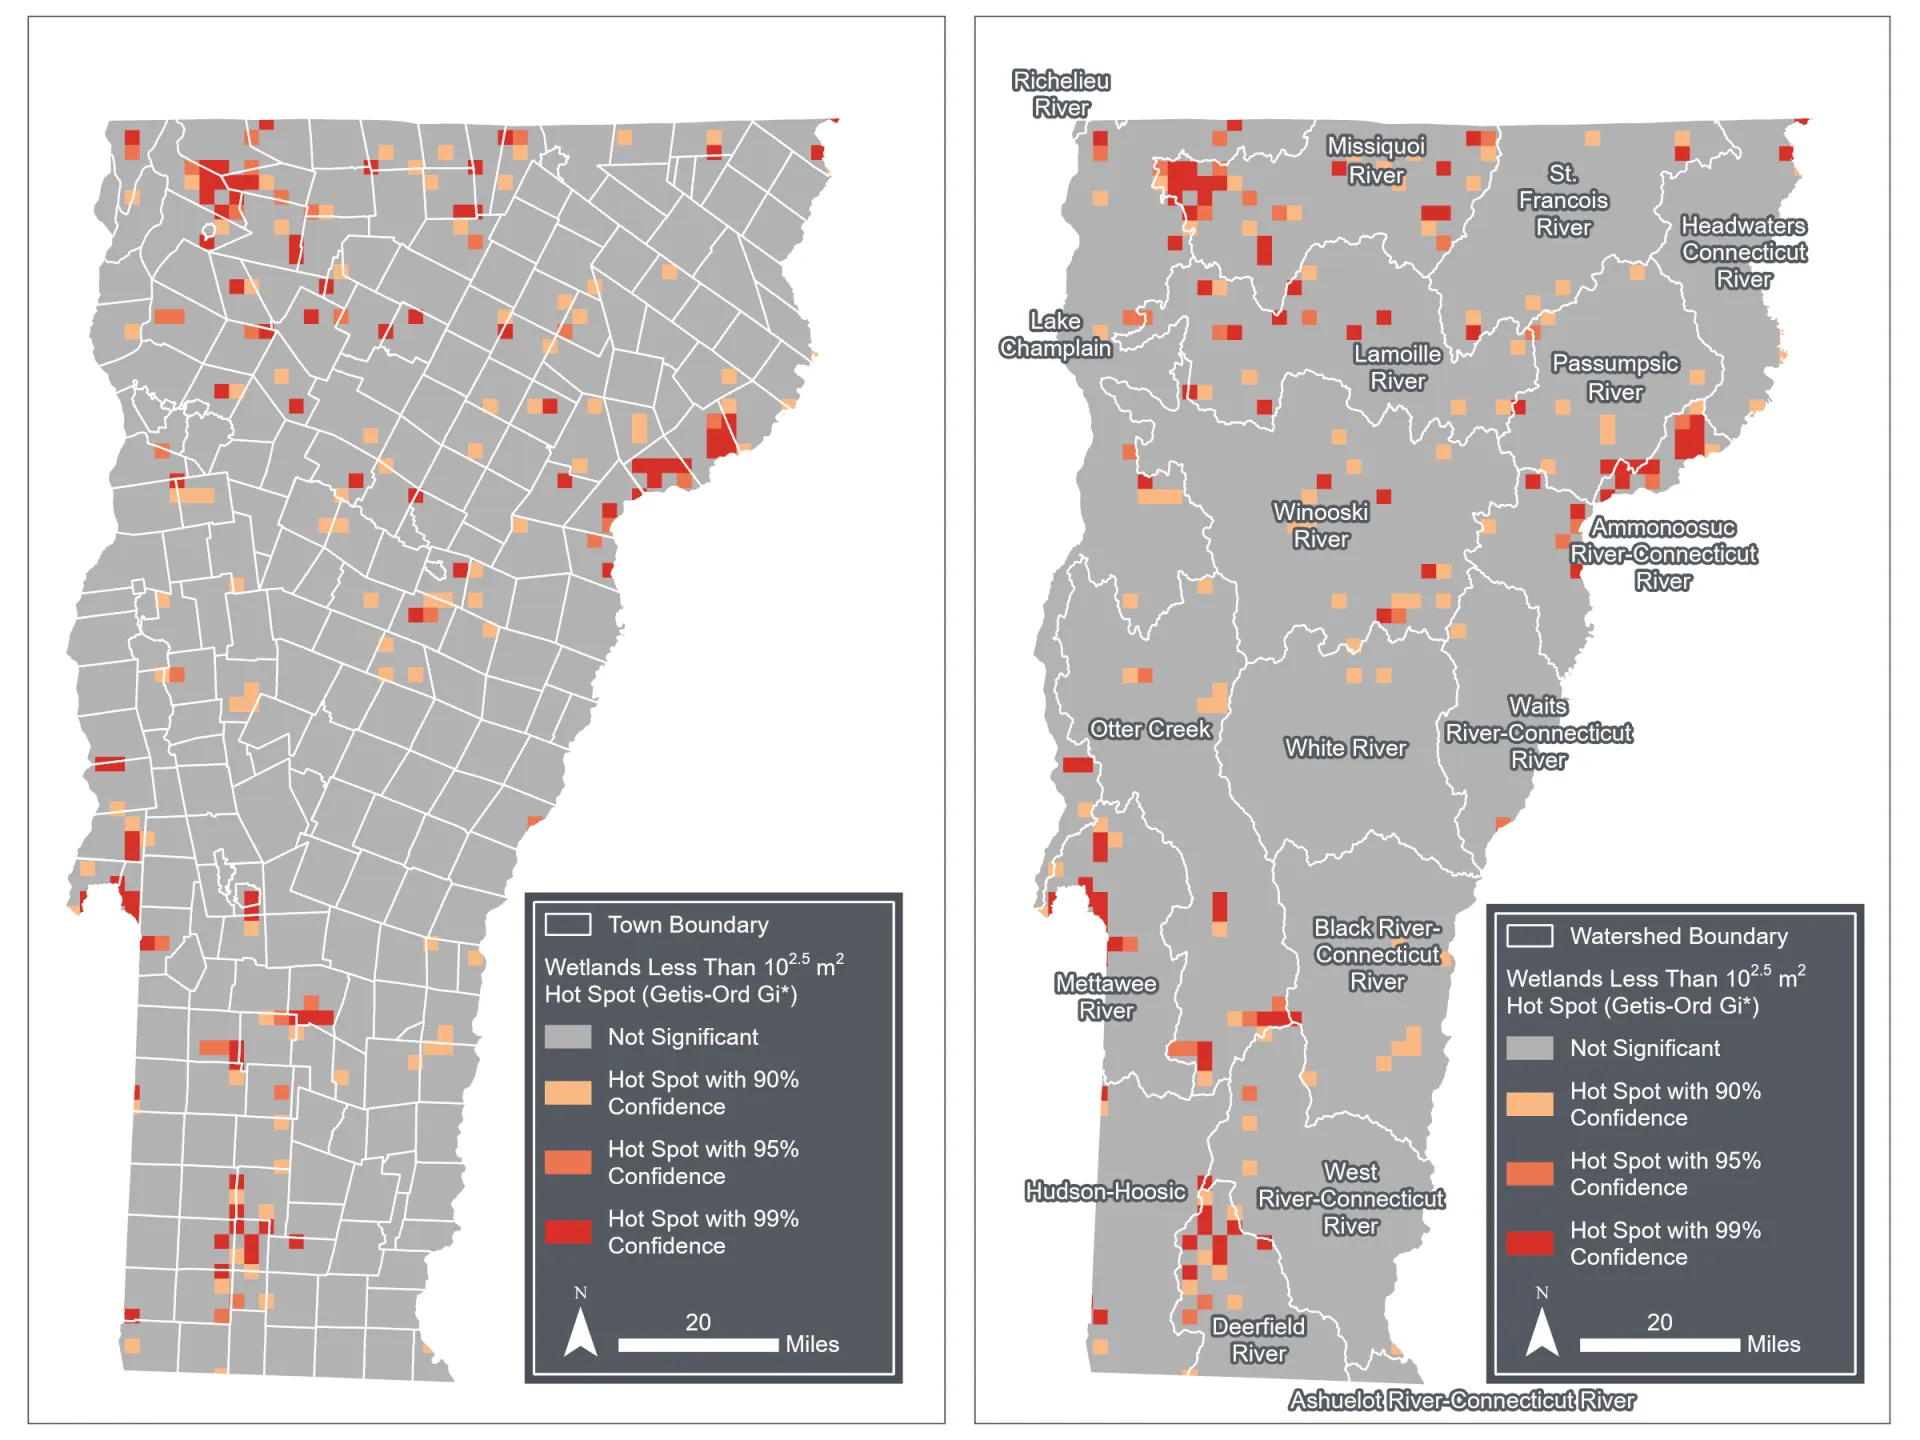
The total amount of nutrients and sediments that a wetland can retain during flooding and drought conditions depends on size, placement, and local conditions in the watershed (Ferreira et al. 2023). Wetlands small in size or located nearby streams retain more phosphorus than wetlands large in size or outside of a floodplain (Singh et al. 2019; Cheng and Basu 2017; Weller et al. 1996). In Vermont, these small wetlands (i.e., less than 0.75 acres [300 m2]) are primarily located within the Missisquoi, Ammonoosuc-Connecticut, Mettawee, Deerfield, Otter Creek, Lamoille, and Winooski river basins (Figure 4-18). Protecting and restoring these small wetlands can help improve water quality across the state.
Restoring wetlands helps retain legacy phosphorus in the soil to prevent excess phosphorus release from contributing to eutrophication of downstream water bodies (Wiegman et al. 2022; 2024). The spatial distribution of wetland restoration projects is related to landowner approval and location of degraded wetlands. A majority of Vermont Natural Resource Conservation Service (NRCS) restoration projects are located along Otter Creek, Lemon Fair River, Barton River, and Black Creek, where there has historically been agricultural land within a floodplain. Due to phosphorus loading concerns to Lake Champlain, wetland restoration projects are concentrated in the Missisquoi, Winooski, Lamoille, Otter Creek, and Mettawee watersheds as they are major tributaries. Outside of the Lake Champlain Basin, numerous wetland restoration projects have been completed in the Connecticut River and Memphremagog basins (Connecticut River Watershed Partnership, 2026).
Source: VTANR Wetlands Inventory Map (2026b)
4.5.5 Algae and cyanobacteria blooms
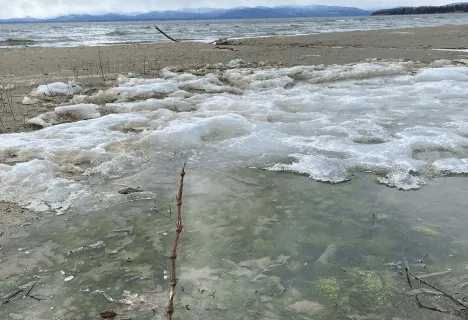
Lakes and associated algae receive nutrient inputs from external loads (e.g., rivers, streams) and internal loads (e.g., lake sediment; Lake Champlain Basin Program, 2024). External nutrient additions from fertilizers and wastewater contribute dissolved inorganic phosphorus and nitrogen that are bioavailable to cyanobacteria and algae populations (Isles et al., 2017; Lake Champlain Committee, 2025). With sufficient nutrients and warm water conditions above 70°F (21°C), cyanobacteria and algal populations increase. Warm periods with low winds and calm water allow cyanobacteria to float to the surface, where they can form scums (Isles et al., 2017; Lake Champlain Committee, 2025). When the growth becomes excessive (termed HABs), it can block light from reaching the bottom, which disrupts benthic vegetation’s ability to photosynthesize. As the blooms die and decompose, they provide readily available carbon for sediment bacteria that consume oxygen as they transform the carbon. Over time, this process of increased primary productivity from blooms coupled with oxygen-consuming bacteria can develop anoxic conditions that reduce fish and lake vegetation that require higher oxygen levels (The Federation of Lakes and Ponds, 2023; United States Environmental Protection Agency, 2026; see Fish and Wildlife 5.5.2). While more common in summer months, HABs can persist in cold water (<59°F or 15°C) and even ice-covered conditions (Figure 4-19; Reinl et al., 2023).
Source: Mindy Morales (2023)
Warmer conditions have changed the frequency and duration of HABs. Relative to 2003, HABs in Lake Champlain now start two weeks earlier in the summer and last later in the fall (i.e., through mid-October; Vermont Department of Environmental Conservation, 2025a). Exposure to cyanotoxins can lead to acute and chronic health conditions, so local health officers and park managers close beaches to reduce human and pet exposure when HABs are present in levels high enough to be harmful to human health (see Human Health 10.7.2, Outdoor Recreation and Tourism 9.5.2; Vermont Department of Health, 2024).
In 2024, St. Albans Bay was the lake segment across Lake Champlain most impacted by HABs, with closures 13% of days between Memorial Day and Labor Day (Lake Champlain Basin Program, 2024). The northeastern arm of Lake Champlain, including St. Albans Bay and Missisquoi Bay, is most impacted by algal blooms due to relatively shallow depths and high loading from agricultural watersheds and legacy nutrients in the sediment (Isles et al., 2015; Smeltzer et al., 2012; Vermont Department of Health, 2026a). Despite having lower cyanobacteria concentrations than other regions of the lake, the main area of Lake Champlain also experiences a high number of closures during summer due to high use and precaution by authorities (Lake Champlain Basin Program, 2024). In 2018, Lake Carmi was considered Vermont’s only “lake in crisis” due to the persistence of HABs; in fall 2025 the lake received an alum treatment to suppress internal loading by binding aluminum sulfate to lake phosphorus and forming a barrier around the bonded phosphorus (Vermont Department of Environmental Conservation, 2026i). Lake Morey has also reported persistent HABs dating back to the 1970s and so has received substantial focus on its water quality. Following a prolonged bloom from August to October 2022, a 2023 sediment study recommended another alum treatment, which was completed in 2024 (Vermont Department of Environmental Conservation, 2026e).
4.5.6 Opportunities for adaptation
Vermont’s legislature and funding allocation supports water quality projects that aim to reduce nutrient additions to Lake Champlain (Figure 4-20) due to its TMDL that estimates pollutant reductions required to meet long-term water quality standards and targets as defined by the U.S. Clean Water Act and Environmental Protection Agency (Vermont Department of Environmental Conservation, 2025b). Vermont’s Clean Water Act (Act 64) of 2015 provides financial support for tracking pollutants across the Lake Champlain Basin and for tracking pollutant reduction efforts (Vermont Clean Water Act, 2015). The Clean Water Portal Project Explorer allows the public to view financial investments into the Lake Champlain Basin, projected output measures, and estimated pollutant reductions by sub-watershed (see 4.7.3). In 2019, Vermont’s Clean Water Service Delivery Act (Act 76) established four complementary grant programs to fund pollutant reduction projects across different lake segments and land uses: Water Quality Restoration Formula Grants, Water Quality Enhancement Grants, Municipal Stormwater Implementation Grants, and Developed Land Implementation Grants (Vermont Clean Water Service Delivery Act, 2019).
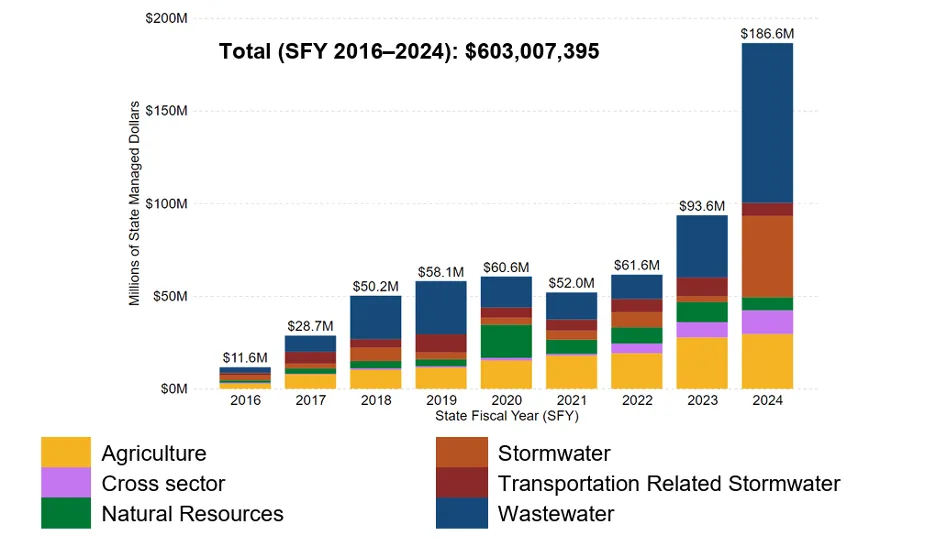
Source: Vermont Department of Environmental Conservation (2025b)
Between 2016–2024, Vermont’s state agencies spent over $600 million on clean water projects, with most of that funding going towards agricultural and wastewater projects (Figure 4-20). Spending was unevenly distributed across the state: approximately $400 million was spent in the Lake Champlain Basin, $160 million in the Connecticut River Basin, and $30 million in the Lake Memphremagog, Tomifobia, and Coaticook Basins. In 2024, spending doubled due to the American Rescue Plan Act (ARPA), which awarded 54% of the spending budget. Increased federal funding occurred under ARPA, the Bipartisan Infrastructure Law, and the Inflation Reduction Act. Vermont’s Clean Water Fund revenue, enacted under Act 76 in 2019, increased funding for clean water projects in the state (Vermont Department of Environmental Conservation, 2025b). This collective increase in funding in 2024 allowed for more stormwater-related projects than in previous years.
4.6 Traceable accounts
4.8 References
Abdulhadi, D. (2024, September 9). Lessons from the Network: Mike Kline. River Network. https://www.rivernetwork.org/interview/lessons-from-the-network-mike-kline/
Act 135: Surface Water Withdrawals and Interbasin Transfers, H.466 17 (2023). https://legislature.vermont.gov/Documents/2022/Docs/ACTS/ACT135/ACT135%20As%20Enacted.pdf?_gl=1*1o6gli7*_ga*MTc2NTY0OTA4NC4xNzU…..
Adair, C. (2024, December 13). Consequences of Warming Winters on Nutrient Export to Lake Champlain (Lake Champlain Sea Grant, Organizer). https://www.youtube.com/watch?v=7zMrYPqmgYQ
Agency of Agriculture Food and Markets. (2026). Annual Farm Surface Water Withdrawal Reporting. https://agriculture.vermont.gov/surface-water-reporting
ANR. (2026). Act 135. Surface Water Withdrawal Registration and Reporting. https://dec.vermont.gov/watershed/rivers/streamflow-protection/act-135-surface-water-withdrawal-registration-and-reporting
Ardón, M., Morse, J. L., Doyle, M. W., & Bernhardt, E. S. (2010). The Water Quality Consequences of Restoring Wetland Hydrology to a Large Agricultural Watershed in the Southeastern Coastal Plain. Ecosystems, 13(7), 1060–1078. https://doi.org/10.1007/s10021-010-9374-x
Associated Free Press. (2023, July 21). “Vermont Strong” license plates to make a comeback after historic flooding. Associated Free Press. https://apnews.com/article/vermont-license-plate-flooding-457a881404db87c92e74e14589cab5d3
Awasthi, C., Archfield, S. A., Ryberg, K. R., Kiang, J. E., & Sankarasubramanian, A. (2022). Projecting Flood Frequency Curves Under Near-Term Climate Change. Water Resources Research, 58(8), e2021WR031246. https://doi.org/10.1029/2021WR031246
Baird, J. B. (2021, August 27). Looking back 10 years at the devastation wrought by Tropical Storm Irene in Vermont. Burlington Free Press. https://www.burlingtonfreepress.com/story/life/2021/08/27/hurricane-irene-vt-tropical-storm-phish-concert-10-years-later-storm-…
Banacos, P. (2023). The Great Vermont Flood of 10-11 July 2023: Preliminary Meteorological Summary. National Weather Service. https://www.weather.gov/btv/The-Great-Vermont-Flood-of-10-11-July-2023-Preliminary-Meteorological-Summary
Bates, P. D., Quinn, N., Sampson, C., Smith, A., Wing, O., Sosa, J., Savage, J., Olcese, G., Neal, J., Schumann, G., Giustarini, L., Coxon, G., Porter, J. R., Amodeo, M. F., Chu, Z., Lewis‐Gruss, S., Freeman, N. B., Houser, T., Delgado, M., … Krajewski, W. F. (2021). Combined Modeling of US Fluvial, Pluvial, and Coastal Flood Hazard Under Current and Future Climates. Water Resources Research, 57(2), e2020WR028673. https://doi.org/10.1029/2020WR028673
Bear Creek Environmental, LLC. (2025). Waterbury, Vermont Middle Winooski River Corridor Plan. https://anrweb.vt.gov/PubDocs/DEC/SGA/finalReports/112_CPB.pdf
Bennet, B., & Bierman, P. (2024, August 13). Opinion — Bella Bennett and Paul Bierman: A solution to landslide risk in Burlington. VTDigger. https://vtdigger.org/2024/08/13/bella-bennett-and-paul-bierman-a-solution-to-landslide-risk-in-burlington/
Bernard, J., Lemunyon, J., Merkel, B., Theurer, F., Widman, N., Bingner, R., Dabney, S., Langendoen, E., Wells, R., & Wilson, G. (2026). Ephemeral Gully Erosion—A National Resource Concern (NSL Technical Report No. 69). United States Department of Agriculture.
Betts, A. K. (2011). Vermont Climate Change Indicators. https://doi.org/10.1175/2011WCAS1096.1
Blackshear, B., Crocker, T., Drucker, E., Filoon, J., Knelman, J., & Skiles, M. (2011). Hydropower Vulnerability and Climate Change. https://www.academia.edu/3119763/Hydropower_Vulnerability_and_Climate_Change
Brady, B. (2025, October 7). Following drought from Lake Champlain to the LaPlatte River headwaters. Shelburne News. https://vtdigger.org/2025/10/07/following-drought-from-lake-champlain-to-the-laplatte-river-headwaters/#:~:text=streams%20and%2….
Breitburg, D., Levin, L. A., Oschlies, A., Grégoire, M., Chavez, F. P., Conley, D. J., Garçon, V., Gilbert, D., Gutiérrez, D., Isensee, K., Jacinto, G. S., Limburg, K. E., Montes, I., Naqvi, S. W. A., Pitcher, G. C., Rabalais, N. N., Roman, M. R., Rose, K. A., Seibel, B. A., … Zhang, J. (2018). Declining oxygen in the global ocean and coastal waters. Science, 359(6371), eaam7240. https://doi.org/10.1126/science.aam7240
Brooks, P. D., Grogan, P., Templer, P. H., Groffman, P., Öquist, M. G., & Schimel, J. (2011). Carbon and Nitrogen Cycling in Snow-Covered Environments. Geography Compass, 5(9), 682–699. https://doi.org/10.1111/j.1749-8198.2011.00420.x
Bushnell, M. (2021, November 21). Then Again: In the wake of the 1927 floods, CCC crews built crucial dams. VTDigger. https://vtdigger.org/2021/11/21/then-again-in-the-wake-of-the-1927-floods-ccc-crews-built-crucial-dams/
Cheng, F. Y., & Basu, N. B. (2017). Biogeochemical hotspots: Role of small water bodies in landscape nutrient processing. Water Resources Research, 53(6), 5038–5056. https://doi.org/10.1002/2016WR020102
Chivambo, J. M. F., Bonde, F., Chichava, I., Abuchir, J., Cuinica, S., & Muhala, V. (2025). Effect of climate change on water resources management: A review of the literature. Urban, Planning and Transport Research, 13(1), 2504488. https://doi.org/10.1080/21650020.2025.2504488
Connecticut River Watershed Partnership. (2026). CRWP Project Submission Portal [Dataset]. https://www.arcgis.com/apps/dashboards/dbb95ae737e143279b4aeaf8f3b8da9a
Contosta, A. R., Casson, N. J., Garlick, S., Nelson, S. J., Ayres, M. P., Burakowski, E. A., Campbell, J., Creed, I., Eimers, C., Evans, C., Fernandez, I., Fuss, C., Huntington, T., Patel, K., Sanders‐DeMott, R., Son, K., Templer, P., & Thornbrugh, C. (2019). Northern forest winters have lost cold, snowy conditions that are important for ecosystems and human communities. Ecological Applications, 29(7), e01974. https://doi.org/10.1002/eap.1974
Copans, B. (2021). Upper Connecticut River Direct Tributaries Basin 16 Tactical Basin Plan Draft for Public View. ANR Water Investment Division. https://dec.vermont.gov/sites/dec/files/WID/WPP/2021%20Draft%20Upper%20Connecticut%20River%20Tactical%20Basin%20Plan.pdf
Cotton, E. (2024, July 26). Landslides and slurries have damaged homes, roads and driveways after this month’s flood. VTDigger. https://vtdigger.org/2024/07/26/landslides-and-slurries-have-damaged-homes-roads-and-driveways-after-this-months-flood/
Crossett, C. C., Hodgkins, G. A., Menk, H., Dupigny‐Giroux, L. L., Dudley, R., Lemcke‐Stampone, M., & Hammond, J. (2023). Groundwater recharge in northern New England: Meteorological drivers and relations with low streamflow. Hydrological Processes, 37(3), e14832. https://doi.org/10.1002/hyp.14832
Crowley, E. C., Patrick. (2023, August 15). ‘It’s historic:’ Summer flooding caused an unprecedented number of landslides in Vermont. VTDigger. https://vtdigger.org/2023/08/15/its-historic-summer-flooding-caused-an-unprecedented-number-of-landslides-in-vermont/
Cutler, C. (2025, October 19). Vermont health officials warn against drinking from roadside springs. Https://Www.Wcax.Com. https://www.wcax.com/2025/10/19/vermont-health-officials-warn-against-drinking-roadside-springs/
D’Auria, P. (2024, July 1). Last year’s flooding caused ‘close calls’ for Vermont dams. Officials are trying to make sure it doesn’t happen again. VTDigger. https://vtdigger.org/2024/07/01/last-years-flooding-caused-close-calls-for-vermont-dams-officials-are-trying-to-make-sure-it-do…
Dethier, E. N., Fields, J. F., Renshaw, C. E., & Magilligan, F. J. (2025). Persistent hillslope erosion delays fluvial recovery from catastrophic flooding. GSA Bulletin, 138(3–4), 1387–1402. https://doi.org/10.1130/B36139.1
Dingman, S. L. (1981). Elevation: A major influence on the hydrology of New Hampshire and Vermont, USA / L’altitude exerce une influence importante sur l’hydrologie du New Hampshire et du Vermont, Etats-Unis. Hydrological Sciences Bulletin, 26(4), 399–413. https://doi.org/10.1080/02626668109490904
Dockser, C., Reed, E., & Krupp, L. (2023, December 19). MAP: Here’s where the December 2023 river flooding, rainfall hit hardest in Vermont. https://www.vermontpublic.org/local-news/2023-12-19/map-heres-where-the-december-2023-river-flooding-rainfall-hit-hardest-in-ve…
Engisch, M. W. & Adiah Gholston. (2023, August 3). Where do Vermont’s dams stand after last month’s flooding? Vermont Public. https://www.vermontpublic.org/local-news/2023-08-03/where-do-vermonts-dams-stand-after-last-months-flooding
Engisch, M. W. & Vermont Public Staff. (2026, February 14). Lake Champlain has officially frozen over. Vermont Public. https://www.vermontpublic.org/local-news/2026-02-14/lake-champlain-has-officially-frozen-over
Federal Reserve Bank of St. Louis. (2026). Resident Population in Vermont [Dataset]. https://fred.stlouisfed.org/series/VTPOP
FEMA. (2024). FEMA Flood Map Service center: Search by Address [Dataset]. https://msc.fema.gov/portal/search
Ferreira, C. S. S., Kašanin-Grubin, M., Solomun, M. K., Sushkova, S., Minkina, T., Zhao, W., & Kalantari, Z. (2023). Wetlands as nature-based solutions for water management in different environments. Current Opinion in Environmental Science & Health, 33, 100476. https://doi.org/10.1016/j.coesh.2023.100476
Flood Ready. (2025). Protect River Corridors and Floodplains. State of Vermont. https://floodready.vermont.gov/flood_protection/river_corridors_floodplains
Flood Ready. (2026a). River Corridors. State of Vermont. https://floodready.vermont.gov/flood_protection/river_corridors_floodplains/river_corridors
Flood Ready. (2026b). Vermont Flood Disclosure Forms. https://floodready.vermont.gov/disclosure
Flood Ready. (2026c). Welcome to Flood Ready Vermont. State of Vermont. https://floodready.vermont.gov/
Flood Training. (2026a). Get Ready for New FEMA Flood Insurance Rate Maps | Flood Training. https://floodtraining.vermont.gov/protection-tools/get-ready-new-fema-flood-insurance-rate-maps
Flood Training. (2026b). Protecting Your Community With a No Adverse Impact Approach. State of Vermont. https://floodtraining.vermont.gov/basic-concepts/nai
Forest Ecosystem Monitoring Cooperative. (2017). FEMC - 2017 Long-Term Update: Sentinel Streams. https://www.uvm.edu/femc/products/long_term_update/2017/vermont/sentinel_streams
Foulon, É., Rousseau, A. N., Benoy, G., & North, R. L. (2020). A global scan of how the issue of nutrient loading and harmful algal blooms is being addressed by governments, non-governmental organizations, and volunteers. Water Quality Research Journal, 55(1), 1–23. https://doi.org/10.2166/wqrj.2019.013
Friends of the Mad River. (2021, July 27). Water Temperature; A Measure of the Watershed’s Health. Friends of The Mad River. http://www.friendsofthemadriver.org/1/post/2021/07/water-temperature-a-measure-of-the-watersheds-health.html
Fuss, C. B., Driscoll, C. T., Green, M. B., & Groffman, P. M. (2016). Hydrologic flowpaths during snowmelt in forested headwater catchments under differing winter climatic and soil frost regimes. Hydrological Processes, 30(24), 4617–4632. https://doi.org/10.1002/hyp.10956
Gaffney, A. (2026, January 14). Drought cost Vermont farmers $15.9M. VTDigger. https://vtdigger.org/2026/01/14/drought-cost-vermont-farmers-15-9m/
Giles, A. (2024, January 4). Vermont officials want a landslide taskforce after unprecedented events during July flooding. Vermont Public. https://www.vermontpublic.org/local-news/2024-01-04/vermont-officials-want-a-landslide-taskforce-after-unprecedented-events-dur…
Gnann, S., Baldwin, J. W., Cuthbert, M. O., Gleeson, T., Schwanghart, W., & Wagener, T. (2025). The Influence of Topography on the Global Terrestrial Water Cycle. Reviews of Geophysics, 63(1), e2023RG000810. https://doi.org/10.1029/2023RG000810
Goff, J. (2023). The Major Snowmelt and Flooding Event of December 18-19, 2023. National Weather Service. https://www.weather.gov/media/btv/events/The%20Major%20Snowmelt%20and%20Flooding%20Event%20of%20December%2018.pdf
Goff, J., & Banacos, P. (2024, October 9). Extreme Nocturnal Rainfall and Flash Flooding in Vermont’s Northeast Kingdom: 30 July 2024. National Weather Service. https://www.weather.gov/btv/Extreme-Nocturnal-Rainfall-and-Flash-Flooding-in-Vermonts-Northeast-Kingdom-30-July-2024
Goff, J., Taber, B., & Banacos, P. (2024, August 10). The Significant Flooding and Severe Weather Event of 10-11 July 2024. NOAA’s National Weather Service. https://www.weather.gov/btv/The-Significant-Flooding-and-Severe-Weather-Event-of-10-11-July-2024
Greenwood, K., Shupe, B., & McCarthy, K. (2012). Municipal Planning for Groundwater Protection: Act 199 and Local Options for Groundwater Management (p. 21) [Guidebook]. Vermont Natural Resources Council. http://vnrc.org/wp-content/uploads/2019/08/Municipal-Planning-for-Groundwater-Protection.pdf
Groffman, P. M., Driscoll, C. T., Fahey, T. J., Hardy, J. P., Fitzhugh, R. D., & Tierney, G. L. (2001). Colder soils in a warmer world: A snow manipulation study in a northern hardwood forest ecosystem. Biogeochemistry, 56(2), 135–150. https://doi.org/10.1023/A:1013039830323
Groundwater Protection, Pub. L. No. Act 199, Vermont Statues Annotated (2008). https://legislature.vermont.gov/statutes/fullchapter/10/048
Guha, A. (2026, February 16). Lake Champlain fully freezes for the first time in 7 years. VT Digger. https://vtdigger.org/2026/02/16/lake-champlain-fully-freezes-for-the-first-time-in-7-years/
Haupt, H. F. (1967). Infiltration, overland flow, and soil movement on frozen and snow‐covered plots. Water Resources Research, 3(1), 145–161. https://doi.org/10.1029/WR003i001p00145
Hodgkins, G. A., & Dudley, R. W. (2011). Historical summer base flow and stormflow trends for New England rivers. Water Resources Research, 47(7). https://doi.org/10.1029/2010WR009109
Howard, A. (2023, February 21). Some Blooms Like it Hot, Others Like it Cold. University of Vermont Rubenstein School of Environment and Natural Resources. https://www.uvm.edu/rsenr/news/some-blooms-it-hot-others-it-cold
Hrycik, A. R., Isles, P. D. F., Adrian, R., Albright, M., Bacon, L. C., Berger, S. A., Bhattacharya, R., Grossart, H., Hejzlar, J., Hetherington, A. L., Knoll, L. B., Laas, A., McDonald, C. P., Merrell, K., Nejstgaard, J. C., Nelson, K., Nõges, P., Paterson, A. M., Pilla, R. M., … Pierson, D. C. (2021). Earlier winter/spring runoff and snowmelt during warmer winters lead to lower summer chlorophyll‐ a in north temperate lakes. Global Change Biology, 27(19), 4615–4629. https://doi.org/10.1111/gcb.15797
Hyman-Rabeler, K. A., & Loheide II, S. P. (2023). Drivers of Variation in Winter and Spring Groundwater Recharge: Impacts of Midwinter Melt Events and Subsequent Freezeback. Water Resources Research, 59(1), e2022WR032733. https://doi.org/10.1029/2022WR032733
Inamdar, S., Johnson, E., Rowland, R., Warner, D., Walter, R., & Merritts, D. (2018). Freeze–thaw processes and intense rainfall: The one-two punch for high sediment and nutrient loads from mid-Atlantic watersheds. Biogeochemistry, 141(3), 333–349. https://doi.org/10.1007/s10533-017-0417-7
Ingram, C. (2023, July 18). Vermont Anglers Facing Ruthless and Record-Breaking Floods. Fly Fisher. https://www.flyfisherman.com/editorial/vermont-anglers-facing-floods/478466
Isles, P. D. F., Giles, C. D., Gearhart, T. A., Xu, Y., Druschel, G. K., & Schroth, A. W. (2015). Dynamic internal drivers of a historically severe cyanobacteria bloom in Lake Champlain revealed through comprehensive monitoring. Journal of Great Lakes Research, 41(3), 818–829. https://doi.org/10.1016/j.jglr.2015.06.006
Isles, P. D. F., Rizzo, D. M., Xu, Y., & Schroth, A. W. (2017). Modeling the drivers of interannual variability in cyanobacterial bloom severity using self-organizing maps and high-frequency data. Inland Waters, 7(3), 333–347. https://doi.org/10.1080/20442041.2017.1318640
Isles, P. D. F., Xu, Y., Stockwell, J. D., & Schroth, A. W. (2017). Climate-driven changes in energy and mass inputs systematically alter nutrient concentration and stoichiometry in deep and shallow regions of Lake Champlain. Biogeochemistry, 133(2), 201–217. https://doi.org/10.1007/s10533-017-0327-8
Jarecki, J., & Wilson, N. (2024, July 30). Fairbanks Museum records record single-day rainfall during NEK flooding. Vermont Public. Vermont Public. https://www.vermontpublic.org/local-news/2024-07-30/fairbanks-museum-records-record-single-day-rainfall-during-nek-flooding
Jones, C. (2025, September 3). Low water levels posing problems on Lake Champlain. WCAX. https://www.wcax.com/2025/09/03/historically-low-water-levels-posing-problems-lake-champlain/
Kirol, A. P., Morales‐Williams, A. M., Braun, D. C., Marti, C. L., Pierson, O. E., Wagner, K. J., & Schroth, A. W. (2024). Linking Sediment and Water Column Phosphorus Dynamics to Oxygen, Temperature, and Aeration in Shallow Eutrophic Lakes. Water Resources Research, 60(1), e2023WR034813. https://doi.org/10.1029/2023WR034813
Kline, M. (2016). Giving our Rivers Room to Move: A New Strategy and Contribution to Protecting Vermont’s Communities and Ensuring Clean Water. 17(4), 33. https://vjel.vermontlaw.edu/wp-content/uploads/2026/03/17VtJEnvtlL733.pdf
Kline, M., & Cahoon, B. (2010). Protecting River Corridors in Vermont. Journal of the American Water Resources Association, 46(2), 227–236. https://doi.org/10.1111/j.1752-1688.2010.00417.x
Lachapelle, S., Rousseau, A. N., Blanchette, M., Foulon, E., & Savary, S. (2025). Quantifying the mitigation effect of natural landscapes during an extraordinary flood: The prominent role of the Otter Creek wetlands to middlebury, Vermont, USA, during Tropical Storm Irene. Canadian Water Resources Journal / Revue Canadienne Des Ressources Hydriques, 50(2), 100–119. https://doi.org/10.1080/07011784.2025.2471763
Laitta, M., Gabriel, M., Greeley, A., Phillips, R., D’amours, M., & Caux, P.-Y. (2020). Nutrient Loading and Impacts in Lake Champlain – Missisquoi Bay and Lake Memphremagog. International Joint Commission. https://ijc.org/sites/default/files/2020-07/Government_Package_English_Revised.pdf
Lake Champlain Basin Atlas. (2026). Lake Champlain Basin Atlas: Climate Change. Lake Champlain Basin Atlas. Lake Champlain Basin Atlas: Climate Change. https://atlas.lcbp.org/issues-in-the-basin/climate-change/
Lake Champlain Basin Program. (2026). Climate Data Trends. https://www.lcbp.org/our-goals/clean-water/climate-change-impacts/climate-data-trends/#:~:text=According%20to%20monitoring%20da….
Lake Champlain Committee. (2025). Cyanobacteria. https://www.lakechamplaincommittee.org/lcc-at-work/cyanobacteria-in-lake
Lake Champlain Committee. (2026). Water Conservation Tips for the Home. https://www.lakechamplaincommittee.org/lcc-at-work/water-conservation/water-conservation-tips-for-the-home
Langendoen, E. J., Simon, A., Klimetz, L., Bankhead, N., & Ursic, M. E. (2012). Quantifying Sediment Loadings from Streambank Erosion in Selected Agricultural Watersheds Draining to Lake Champlain. Technical Report No. 72. https://www.ars.usda.gov/ARSUserFiles/60600500/NSL%20%20Research%20Reports/2012_Langendoen%20NSL%20Research%20Report%2079.pdf
Leach, J. A., Kelleher, C., Kurylyk, B. L., Moore, R. D., & Neilson, B. T. (2023). A primer on stream temperature processes. WIREs Water, 10(4), e1643. https://doi.org/10.1002/wat2.1643
Li, C., Sun, G., Caldwell, P. V., Cohen, E., Fang, Y., Zhang, Y., Oudin, L., Sanchez, G. M., & Meentemeyer, R. K. (2020). Impacts of Urbanization on Watershed Water Balances Across the Conterminous United States. Water Resources Research, 56(7), e2019WR026574. https://doi.org/10.1029/2019WR026574
LIS TMDL Workgroup. (2013). Vermont Enhanced Implementation Plan for the Long Island Sound TMDL: Nonpoint Source Section. https://neiwpcc.org/wp-content/uploads/2020/08/LIS-TMDL_VT-State-Section.pdf
Maloney, J. (2025, September 18). Vermont dams continue to produce hydroelectric power through drought. NBC5. https://www.mynbc5.com/article/vt-dams-continue-to-produce-hydroelectric-power-through-drought/67953350
Martínez-Espinosa, C., Sauvage, S., Al Bitar, A., Green, P. A., Vörösmarty, C. J., & Sánchez-Pérez, J. M. (2021). Denitrification in wetlands: A review towards a quantification at global scale. Science of The Total Environment, 754, 142398. https://doi.org/10.1016/j.scitotenv.2020.142398
McDonald, C. (2024, August 7). UVM geological study says landslide risk on Burlington’s Riverside Avenue is imminent. VTDigger. https://vtdigger.org/2024/08/07/uvm-geological-study-says-landslide-risk-on-burlingtons-riverside-avenue-is-imminent/
McDonald, R. I., Weber, K., Padowski, J., Flörke, M., Schneider, C., Green, P. A., Gleeson, T., Eckman, S., Lehner, B., Balk, D., Boucher, T., Grill, G., & Montgomery, M. (2014). Water on an urban planet: Urbanization and the reach of urban water infrastructure. Global Environmental Change, 27, 96–105. https://doi.org/10.1016/j.gloenvcha.2014.04.022
Mingle, J. (2025, February 11). In Vermont, a push to prevent flooding or get out of the way. Yale Environment 360. https://www.preventionweb.net/news/vermont-push-prevent-flooding-or-get-out-way
Mitchell, M. (2025, April 14). Lake Morey Water Quality Improves After Alum Treatment in June 2024. Lake Champlain Sea Grant. https://www.uvm.edu/seagrant/news/lake-morey-water-quality-improves-after-alum-treatment-june-2024
Morrill, J. C., Bales, R. C., & Conklin, M. H. (2005). Estimating Stream Temperature from Air Temperature: Implications for Future Water Quality. Journal of Environmental Engineering, 131(1), 139–146. https://doi.org/10.1061/(ASCE)0733-9372(2005)131:1(139)
Munson, K. (2024, November 30). After the Floods. University of Vermont News. https://www.uvm.edu/uvmnews/news/after-floods
NASA Applied Sciences. (2023, July 14). Vermont Flooding July 2023. NASA Applied Sciences. https://appliedsciences.nasa.gov/what-we-do/disasters/disasters-activations/vermont-flooding-july-2023
National Centers fo Environmental Information & National Oceanic and Atmospheric Administration. (2026). Climate Regions[Dataset]. https://www.ncei.noaa.gov/pub/data/cirs/climdiv/
National Centers for Environmental Information (NCEI). (2026). Geographical Reference Maps | CONUS Climate Divisions. https://www.ncei.noaa.gov/access/monitoring/reference-maps/conus-climate-divisions
National Integrated Drought Information System. (2026). Explaining Drought Category Maps. https://www.drought.gov/explaining-drought-category-maps
National Oceanic and Atmospheric Administration. (2024, June 16). What is a watershed?https://oceanservice.noaa.gov/facts/watershed.html
National Weather Service. (2026). Flooding in Vermont. NOAA’s National Weather Service. https://www.weather.gov/safety/flood-states-vt
Nell, C., Redwine, B., Corson-Dosch, H., Riggs, C., Volentine, R., & Felts, N. (2023, January 4). A New Take on the Water Cycle [USGS Water Data for the Nation]. Water Data Blogs. https://waterdata.usgs.gov/blog/water-cycle-release/#:~:text=On%20October%2013th%202022%2C%20we,towards%20using%20water%20more%….
New England Water Science Center. (2024, September 16). July 2023 Flood in Vermont. U.S. Geological Survey. https://www.usgs.gov/centers/new-england-water-science-center/science/july-2023-flood-vermont
News & Citizen. (2023, November 3). Morrisville utility’s flood damage totals $3 million. VTDigger. https://vtdigger.org/2023/11/03/morrisville-utilitys-flood-damage-totals-3-million/
NOAA. (2026). Dates of Lake Champlain Closing. NOAA’s National Weather Service. https://www.weather.gov/btv/lakeclose
Noyes, S. (2023, December 5). After the Flood Stories of Resilience: Northfield, Vermont. Lake Champlain Sea Grant. https://www.uvm.edu/seagrant/news/after-flood-stories-resilience-northfield-vermont
Ouranos. (2025, December 4). 2025: A year in line with global warming trends. https://www.ouranos.ca/en/news/2025-12-03/2025-year-in-review#:~:text=Summer%202025%20began%20with%20a,heavy%20rain%2C%20someti….
Peer, K., Hubbard, B., Monti, M., Vander Kelen, P., & Werner, A. K. (2024). The private well water climate impact index: Characterization of community-level climate-related hazards and vulnerability in the continental United States. Science of The Total Environment, 957, 177409. https://doi.org/10.1016/j.scitotenv.2024.177409
Peters-Lidard, C. D., Rose, K. C., Kiang, J. E., Strobel, M. L., Anderson, M. L., Byrd, A. R., Kolian, M. J., Brekke, L. D., & Arndt, D. S. (2021). Indicators of climate change impacts on the water cycle and water management. Climatic Change, 165(1), 36. https://doi.org/10.1007/s10584-021-03057-5
Pettersson, K. (1998). Mechanisms for internal loading of phosphorus in lakes. Hydrobiologia, 373–374(0), 21–25. https://doi.org/10.1023/A:1017011420035
Qiang, Y. (2019). Disparities of population exposed to flood hazards in the United States. Journal of Environmental Management, 232, 295–304. https://doi.org/10.1016/j.jenvman.2018.11.039
Qiu, J., Shen, Z., & Xie, H. (2023). Drought impacts on hydrology and water quality under climate change. Science of The Total Environment, 858, 159854. https://doi.org/10.1016/j.scitotenv.2022.159854
Rebuild By Design. (2026). Atlas of Accountability Fact Sheet. Rebuild By Design. https://rebuildbydesign.org/wp-content/uploads/2024/07/Atlas-of-Accountability-Fact-Sheet.pdf
Ross, D. S., Wemple, B. C., Willson, L. J., Balling, C. M., Underwood, K. L., & Hamshaw, S. D. (2019). Impact of an Extreme Storm Event on River Corridor Bank Erosion and Phosphorus Mobilization in a Mountainous Watershed in the Northeastern United States. Journal of Geophysical Research: Biogeosciences, 124(1), 18–32. https://doi.org/10.1029/2018JG004497
Saeed, T., Alam, M. K., Miah, M. J., & Majed, N. (2021). Removal of heavy metals in subsurface flow constructed wetlands: Application of effluent recirculation. Environmental and Sustainability Indicators, 12, 100146. https://doi.org/10.1016/j.indic.2021.100146
Sebestyen, S. D., Boyer, E. W., & Shanley, J. B. (2009). Responses of stream nitrate and DOC loadings to hydrological forcing and climate change in an upland forest of the northeastern United States. Journal of Geophysical Research: Biogeosciences, 114(G2), 2008JG000778. https://doi.org/10.1029/2008JG000778
Seybold, E. C., Dwivedi, R., Musselman, K. N., Kincaid, D. W., Schroth, A. W., Classen, A. T., Perdrial, J. N., & Adair, E. C. (2022). Winter runoff events pose an unquantified continental-scale risk of high wintertime nutrient export. Environmental Research Letters, 17(10), 104044. https://doi.org/10.1088/1748-9326/ac8be5
Seybold, E., Gold, A. J., Inamdar, S. P., Adair, C., Bowden, W. B., Vaughan, M. C. H., Pradhanang, S. M., Addy, K., Shanley, J. B., Vermilyea, A., Levia, D. F., Wemple, B. C., & Schroth, A. W. (2019). Influence of land use and hydrologic variability on seasonal dissolved organic carbon and nitrate export: Insights from a multi-year regional analysis for the northeastern USA. Biogeochemistry, 146(1), 31–49. https://doi.org/10.1007/s10533-019-00609-x
Shanley, J. B., & Chalmers, A. (1999). The effect of frozen soil on snowmelt runoff at Sleepers River, Vermont. Hydrological Processes, 13(12–13), 1843–1857. https://doi.org/10.1002/(SICI)1099-1085(199909)13:12/13%3C1843::AID-HYP879%3E3.0.CO;2-G
Singh, N. K., Gourevitch, J. D., Wemple, B. C., Watson, K. B., Rizzo, D. M., Polasky, S., & Ricketts, T. H. (2019). Optimizing wetland restoration to improve water quality at a regional scale. Environmental Research Letters, 14(6), 064006. https://doi.org/10.1088/1748-9326/ab1827
Siskin, M., & Katriztky, A. R. (1991). Reactivity of Organic Compounds in Hot Water: Geochemical and Technological Implications. Science, 254(5029), 231–237. https://doi.org/10.1126/science.254.5029.231
Skinner, M. (2022). Wetland phosphorus dynamics and phosphorus removal potential. Water Environment Research, 94(10), e10799. https://doi.org/10.1002/wer.10799
SLR Consulting, Fitzgerald Environmental Associates, LLC, Fluvial Matters LLC, Stone Environmental, Inc., The University of Vermont, & Stone Mountain Research and Consulting. (2023, June). The Vermont Functioning Floodplain Initiative (FFI) to Reconnect Rivers. Stone Environmental. https://stone-env-public.s3.amazonaws.com/FFI_User_Guide_2.1.pdf
Smeltzer, E., Shambaugh, A. D., & Stangel, P. (2012). Environmental change in Lake Champlain revealed by long-term monitoring. Journal of Great Lakes Research, 38, 6–18. https://doi.org/10.1016/j.jglr.2012.01.002
Smith, T., Olson, S., LeNoir, J., Kalmon, R., & Ahearn, E. (2025). Flood of July 2023 in Vermont. USGS. https://pubs.usgs.gov/sir/2025/5016/sir20255016.pdf
Spasyk, A. (2025, May 5). Reducing Vermont’s Exposure to Flood Hazards through River Corridor Protections | Lake Champlain Sea Grant. Lake Champlain Sea Grant. https://www.uvm.edu/seagrant/news/reducing-vermont%E2%80%99s-exposure-flood-hazards-through-river-corridor-protections
Springston, G. (2021). Landslide Inventory of Caledonia County, Vermont [Open File Report VG2021-2]. Norwich University. https://hardwickvt.gov/wp-content/uploads/2026/02/OFR_VG2021_2_CaledoniaCtyLandslideReport-1.pdf
Springston, G. (2025, May 18). Water, Boulders, and Mud: The 2024 Great Brook Flood in Plainfield, Vermont. https://dec.vermont.gov/sites/dec/files/geo/HazDocs/GreatBrookWaterBouldersMudSpringston05282015lo.pdf
Springston, G., DeJong, B., Boyles, J., & Klepeis, K. (2023). Two Decades of Collaborative Landslide Research in Vermont. 385275. https://doi.org/10.1130/abs/2023SE-385275
State of Vermont. (2024). The Flood Safety Act. https://floodready.vermont.gov/flood-safety-act
Stuurop, J. C., Van Der Zee, S. E. A. T. M., & French, H. K. (2022). The influence of soil texture and environmental conditions on frozen soil infiltration: A numerical investigation. Cold Regions Science and Technology, 194, 103456. https://doi.org/10.1016/j.coldregions.2021.103456
The Federation of Lakes and Ponds. (2023). Cyanobacteria. Protecting Lakes & Ponds. https://vermontlakes.org/cyanobacteria/
The Nature Conservancy. (2026). Creating a Flood Resilient Vermont. The Nature Conservancy. https://www.nature.org/content/dam/tnc/nature/en/documents/FloodResilientVermont.pdf
Thomas, S. (2025, January 22). Lake Champlain’s lack of ice shifts wildlife patterns. WCAX. https://www.wcax.com/2025/01/22/lake-champlains-lack-ice-shifts-wildlife-patterns/
Title 10, Chapter 37 (2024). https://legislature.vermont.gov/statutes/fullchapter/10/037?
Tull, N., & Passalacqua, P. (2025). Flood Wave Attenuation as a Function of Floodplain Storage, Secondary Channel Conveyance, and Discharge. Water Resources Research, 61(5), e2024WR038582. https://doi.org/10.1029/2024WR038582
Two Rivers-Ottauquechee Regional Commission & Town of West Fairlee. (2019). 2019 Local Hazard Mitigation Plan: Town of West Fairlee, Vermont [Hazard Mitigation Plan]. FEMA. https://www.trorc.org/wp-content/uploads/2013/10/finalWFairleeLHMP.12219.pdf
United States Department of Agriculture. (2024). 2022 Census of Agriculture: Vermont State and County Data (Census AC-22-A-45; Volume 1 Part 45, p. 24). USDA, National Agricultural Statistics Service. https://www.nass.usda.gov/Publications/AgCensus/2022/Full_Report/Volume_1,_Chapter_1_State_Level/Vermont/st50_1_009_010.pdf
United States Drought Monitor. (2026). Drought Classification. U.S. Drought Monitor. https://droughtmonitor.unl.edu/About/AbouttheData/DroughtClassification.aspx
United States Energy Information Administration. (2026, January 15). Vermont’s Electricity. https://www.eia.gov/state/?sid=VT
United States Environmental Protection Agency. (2015, October 1). Prepare for Drought [Overviews and Factsheets]. https://www.epa.gov/green-infrastructure/prepare-drought
United States Environmental Protection Agency. (2026, January 16). The Effects: Dead Zones and Harmful Algal Blooms. The Effects: Dead Zones and Harmful Algal Blooms. https://www.epa.gov/nutrientpollution/effects-dead-zones-and-harmful-algal-blooms?
United States Geologic Survey. (2026). Vermont High Water-Mark Data Viewer. Data Viewer. https://geonarrative.usgs.gov/vermontfloodireneandjuly2023/
U.S. Geological Survey. (2023). National Hydrography Map [Dataset]. https://prd-tnm.s3.amazonaws.com/index.html?prefix=StagedProducts/Hydrography/NHD/State/GDB/
U.S. Geological Survey. (2026a). National Water Availability Assessment Data Companion [Dataset]. https://water.usgs.gov/nwaa-data/subset-download/?model=wu-public-supply-wd&variable=pswdgw,pswdsw,pswdtot
U.S. Geological Survey. (2026b). Vermont water conditions [Dataset]. https://waterdata.usgs.gov/state/Vermont/
U.S. Geological Survey. (2026c). Water Use Concepts and Terms. https://wa.water.usgs.gov/data/wuse/concepts.htm
U.S. Geological Survey. (2026d). What is groundwater? https://www.usgs.gov/faqs/what-groundwater
USGCRP. (2023). Fifth National Climate Assessment (No. 5th). U.S. Global Change Research Program. https://nca5.climate.us/downloads/NCA5_2023_FullReport.pdf
UVM Spatial Analysis Lab & Vermont Agency of Transportation. (2024). Vermont Flood Event Aerial Photo Viewer [Dataset]. https://experience.arcgis.com/experience/2d835581b93e4f5abdd9f4863135bf32
Vermont Agency of Agriculture, Food, and Markets. (2025, May). Flooding Disaster Response and Recovery Resources. VAAFM. https://agriculture.vermont.gov/flood
Vermont Agency of Natural Resources. (2024). Landslides [Dataset]. https://geodata.vermont.gov/datasets/VTANR::landslides/explore?location=43.925600%2C-72.678150%2C8
Vermont Agency of Natural Resources. (2026a). Landslides Public Data Viewer. Vermont Agency of Natural Resources. Data Viewer. https://anrgeodata.vermont.gov/datasets/landslides/explore
Vermont Agency of Natural Resources. (2026b). Wetlands Inventory Map [Dataset]. https://anrmaps.vermont.gov/websites/WetlandProjects/default.html?_gl=1*12ghjlw*_ga*MTc2NTY0OTA4NC4xNzU1NTM4NTg4*_ga_V9WQH77KLW…
Vermont Agency of Natural Resources, & Vermont Department of Transportation. (2026). Vermont Agency of Natural Resources Rivers and Roads Training Program. https://dec.vermont.gov/sites/dec/files/wsm/rivers/docs/rv-RiversAndRoadsTraining_TierOneFinal.pdf
Vermont Clean Water Act, Act No. 64 (H. 35) (2015). https://legislature.vermont.gov/Documents/2016/Docs/ACTS/ACT064/ACT064%20Act%20Summary.pdf
Vermont Clean Water Service Delivery Act, Pub. L. No. Act 76 (2019). https://legislature.vermont.gov/Documents/2020/Docs/ACTS/ACT076/ACT076%20As%20Enacted.pdf?_gl=1*5xpyz7*_ga*MTc2NTY0OTA4NC4xNzU1…..
Vermont Department of Environmental Conservation. (1996, February 15). Water Withdrawals for Snowmaking Rule. https://dec.vermont.gov/content/water-withdrawals-snowmaking-rule
Vermont Department of Environmental Conservation. (2017). VT Surface Water Management Strategy- Tactical Basin Planning. Vermont Agency of Natural Resources. https://dec.vermont.gov/sites/dec/files/documents/wsmd_swms_Chapter_4_Tactical_Basin_Planning.pdf
Vermont Department of Environmental Conservation. (2020). Vermont Nonpoint Source Management Program Plan 2021-2025. https://dec.vermont.gov/sites/dec/files/wsm/erp/docs/Vermont%20NPS%20Management%20Plan%202021-2025.pdf
Vermont Department of Environmental Conservation. (2022). Vermont Surface Water Assessment and Listing Methodology. Vermont Agency of Natural Resources. https://dec.vermont.gov/sites/dec/files/documents/WSMD_AssessmentAndListingMethodology.pdf
Vermont Department of Environmental Conservation. (2023). Vermont Wetland Rules. Vermont Agency of Natural Resources. https://dec.vermont.gov/sites/dec/files/documents/wsmd_VermontWetlandRules.pdf
Vermont Department of Environmental Conservation. (2025a). Report on Act 135 Surface Water Withdrawals Registration and Reporting [Legislative Report]. VTDEC. https://legislature.vermont.gov/assets/Legislative-Reports/Act-135-Surface-Water-Withdrawals-Legislative-Report_2025.pdf
Vermont Department of Environmental Conservation. (2025c). Vermont Clean Water Initiative 2024 Performance Report. Vermont Clearn Water Initiative. Clean Water Initiative 2024 Performance Report_0.pdf
Vermont Department of Environmental Conservation. (2026a). Assessment and Listing. https://dec.vermont.gov/watershed/map/assessment-and-listing
Vermont Department of Environmental Conservation. (2026b). Basin 17—Lake Memphremagog, Coaticook and Tomifobia Rivers Basin Planning. https://dec.vermont.gov/water-investment/watershed-planning/basins-and-planners/basin17#:~:text=Lake%20Memphremagog%20Phosphoru….
Vermont Department of Environmental Conservation. (2026c). Connecticut River. https://dec.vermont.gov/watershed/restoring/connecticut-river
Vermont Department of Environmental Conservation. (2026d). Dam Safety Program. Vermont Agency of Natural Resources. https://dec.vermont.gov/water-investment/dam-safety
Vermont Department of Environmental Conservation. (2026e). Groundwater Withdrawal Reporting and Permitting | Department of Environmental Conservation. Vermont Agency of Natural Resources. https://dec.vermont.gov/act250/water/groundwater/groundwater-withdrawal-reporting-and-permitting
Vermont Department of Environmental Conservation. (2026f). Lakes Monitoring and Data. https://dec.vermont.gov/watershed/lakes-ponds/monitor
Vermont Department of Environmental Conservation. (2026g). LaRosa Partnership Program. https://dec.vermont.gov/watershed/map/monitor/larosa
Vermont Department of Environmental Conservation. (2026h). Long Term Monitoring Program Champlain data (1990-2020) [Excel format]. https://dec.vermont.gov/watershed/lakes-ponds/monitor/lake-champlain-long-term-monitoring-project
Vermont Department of Environmental Conservation. (2026i). Restoring Lake Carmi: Lake and Watershed Management. https://dec.vermont.gov/watershed/restoring/carmi
Vermont Department of Environmental Conservation. (2026j). Ticklenaked Pond. https://dec.vermont.gov/watershed/restoring/ticklenaked
Vermont Department of Environmental Conservation. (2026k). Water Quality Monitoring. https://dec.vermont.gov/water/drinking-water/water-quality-monitoring
Vermont Department of Environmental Conservation. (2026l). Wetland Functions and Values: Water Storage for Flood Water and Storm Runoff. Vermont Agency of Natural Resources. https://dec.vermont.gov/watershed/wetlands/functions/wetland-functions-and-values-water-storage-flood-water-and-storm
Vermont Department of Environmental Conservation. (2026m). Wetland Maps. https://dec.vermont.gov/watershed/wetlands/wetland-maps
Vermont Department of Environmental Conservation. (2026n). Wetlands | Welcome to the Vermont Wetlands Program. https://dec.vermont.gov/watershed/wetlands
Vermont Department of Environmental Conservation, New York State Department of Environmental Conservation, & Lake Champlain Research Institute. (2023). Lake Champlain Long-Term Water Quality and Biological Monitoring Program[Summary of Program Activities]. Lake Champlain Basin Program. https://dec.vermont.gov/sites/dec/files/LCM%202023%20Annual%20Report.pdf
Vermont Department of Environmental Conservation Watershed Management Division. (2025). 2024-2025 Water Quality Monitoring and Assessment Summary Report. Vermont Agency of Natural Resources, Department of Environmental Conservation. https://dec.vermont.gov/sites/dec/files/documents/2024%20Biannual%20Assessment%20Report-Final.pdf
Vermont Department of Health. (2024). Cyanobacteria (Blue-Green Algae) [Fact Sheet]. Vermont Department of Health. https://www.healthvermont.gov/sites/default/files/documents/pdf/ENV_RW_Cyanobacteria.pdf
Vermont Department of Health. (2025a). Healthy Recreational Waters [Fact Sheet]. Vermont Department of Health. https://www.healthvermont.gov/sites/default/files/documents/pdf/Env_RW_healthy_recreational_waters_faq.pdf
Vermont Department of Health. (2025b). Private Drinking Water. Private Drinking Water. https://www.healthvermont.gov/environment/drinking-water/private-drinking-water#:~:text=Springs%20are%20susceptible%20to%20cont….
Vermont Department of Health. (2026a). Cyanobacteria (Blue-Green Algae). https://www.healthvermont.gov/environment/recreational-water/cyanobacteria-blue-green-algae
Vermont Department of Health. (2026b). Using Water From This Spring?https://www.healthvermont.gov/sites/default/files/document/env-dw-roadside-spring-sign.pdf
Vermont Department of Health. (2026c, January 29). Drought and Your Well. Scientific Investigations Report 2025–5075. https://www.healthvermont.gov/environment/drinking-water/drought-and-your-well
Vermont Department of Health. (2026d, February 27). Drinking Water. https://healthvermont.org/environment/tracking/drinking-water
Vermont Emergency Management. (2023). 2023 Vermont State Hazard Mitigation Plan. https://vem.vermont.gov/sites/demhs/files/documents/2023%20SHMP_Adopted%20Draft%20Jan2024.pdf
Vermont Historical Society. (2026). The Flood of ’27, 1927. Vermont Historical Society. https://vermonthistory.org/flood-of-27-1927
Vermont History Explorer. (2026). Tropical Storm Irene. https://vermonthistoryexplorer.org/tropical-storm-irene#:~:text=This%20was%20a%20very%20difficult,of%20roads%20and%20200%20brid….
Vermont Public. (2024, July 11). Live updates: Vermonters clean up after another devastating July flood [News]. https://www.vermontpublic.org/live-updates/live-updates-flash-flooding-barre-city-beryl
Vermont Public Staff, Lexi Krupp, & Peter Hirschfeld. (2025, July 11). Flash flood damage comes into focus in Northeast Kingdom, Addison County. Vermont Public. https://www.vermontpublic.org/local-news/2025-07-10/state-dispatches-rescue-teams-as-flash-floods-hit-vermont-again
Warner, K. E., Schroth, A. W., Petrine, M., Bernich, A., Wagner, N. D., Wei, B., Boyer, G. L., & Morales, A. M. (2025). Interactive effects of stoichiometry and environmental variability regulate cyanobacteria toxicity in two eutrophic bays. Limnology and Oceanography, 70(11), 3506–3519. https://doi.org/10.1002/lno.70220
Watson, K. B., Ricketts, T., Galford, G., Polasky, S., & O’Niel-Dunne, J. (2016). Quantifying flood mitigation services: The economic value of Otter Creek wetlands and floodplains to Middlebury, VT. Ecological Economics, 130, 16–24. https://doi.org/10.1016/j.ecolecon.2016.05.015
Weller, C. M., Watzin, M. C., & Wang, D. (1996). Role of wetlands in reducing phosphorus loading to surface water in eight watersheds in the Lake Champlain Basin. Environmental Management, 20(5), 731–739. https://doi.org/10.1007/BF01204144
Wiegman, A. R. H., Myers, G. H., Augustin, I. C., Kubow, M. L., Fein-Cole, M. J., Perillo, V. L., Ross, D. S., Diehl, R. M., Underwood, K. L., Bowden, W. B., & Roy, E. D. (2022). Potential for soil legacy phosphorus release from restored riparian wetlands within an agricultural landscape. Biogeochemistry, 161(2), 137–156. https://doi.org/10.1007/s10533-022-00972-2
Wiegman, A. R. H., Underwood, K. L., Bowden, W. B., Augustin, I. C., Chin, T. L., & Roy, E. D. (2024). Modeling Phosphorus Retention and Release in Riparian Wetlands Restored on Historically Farmed Land. Journal of Ecological Engineering Design, 1(1). https://doi.org/10.21428/f69f093e.a06ba868
Wilcoxon, F. (1945). Individual Comparisons by Ranking Methods. Biometrics Bulletin, 1(6), 80–83. https://doi.org/10.2307/3001968
Williams, S. A., Zuniga-Teran, A. A., Megdal, S. B., Quanrud, D. M., Christopherson, G., Williams, S. A., Zuniga-Teran, A. A., Megdal, S. B., Quanrud, D. M., & Christopherson, G. (2025). Assessing the Relationship Between Groundwater Availability, Access, and Contamination Risk in Arizona’s Drinking Water Sources. Water, 17(7). https://doi.org/10.3390/w17071097
Wilson, G., Green, M., Brown, J., Campbell, J., Groffman, P., Durán, J., & Morse, J. (2020). Snowpack affects soil microclimate throughout the year. Climatic Change, 163(2), 705–722. https://doi.org/10.1007/s10584-020-02943-8
Wing, O. E. J., Lehman, W., Bates, P. D., Sampson, C. C., Quinn, N., Smith, A. M., Neal, J. C., Porter, J. R., & Kousky, C. (2022). Inequitable patterns of US flood risk in the Anthropocene. Nature Climate Change, 12(2), 156–162. https://doi.org/10.1038/s41558-021-01265-6
Ziemer, R. R. (1981). The Role of Vegetation in the Stability of Forested Slopes. Proceedings of the International Union of Forestry Research Organizations, 297–308. https://research.fs.usda.gov/treesearch/8693