Ozone
Monitoring ozone pollution levels and foliar injury in Northern and Southern Vermont
Ozone is a colorless, odorless gas that occurs naturally in the stratosphere, where it helps protect us from harmful ultraviolet radiation. Closer to ground level, ozone pollution causes a range of adverse effects on human health and sensitive vegetation. Ozone forms from photochemical reactions between air pollution emissions of nitrogen oxides and volatile organic compounds (VOCs). The US EPA sets and periodically revises national ambient air quality standards (NAAQS) for ozone and other commonly occurring air pollutants, including “primary standards” to protect human health, and “secondary standards” to protect the environment. The current primary ozone standard was promulgated by the EPA in 2015 and is based on the highest 8-hour average concentration in a day. The form of the standard is based on the 4th highest daily 8-hour concentration in a year, averaged over a 3-year period. The level of the current primary standard is 70 parts per billion (ppb), and the secondary standard was set equal to the primary standard.
The Data
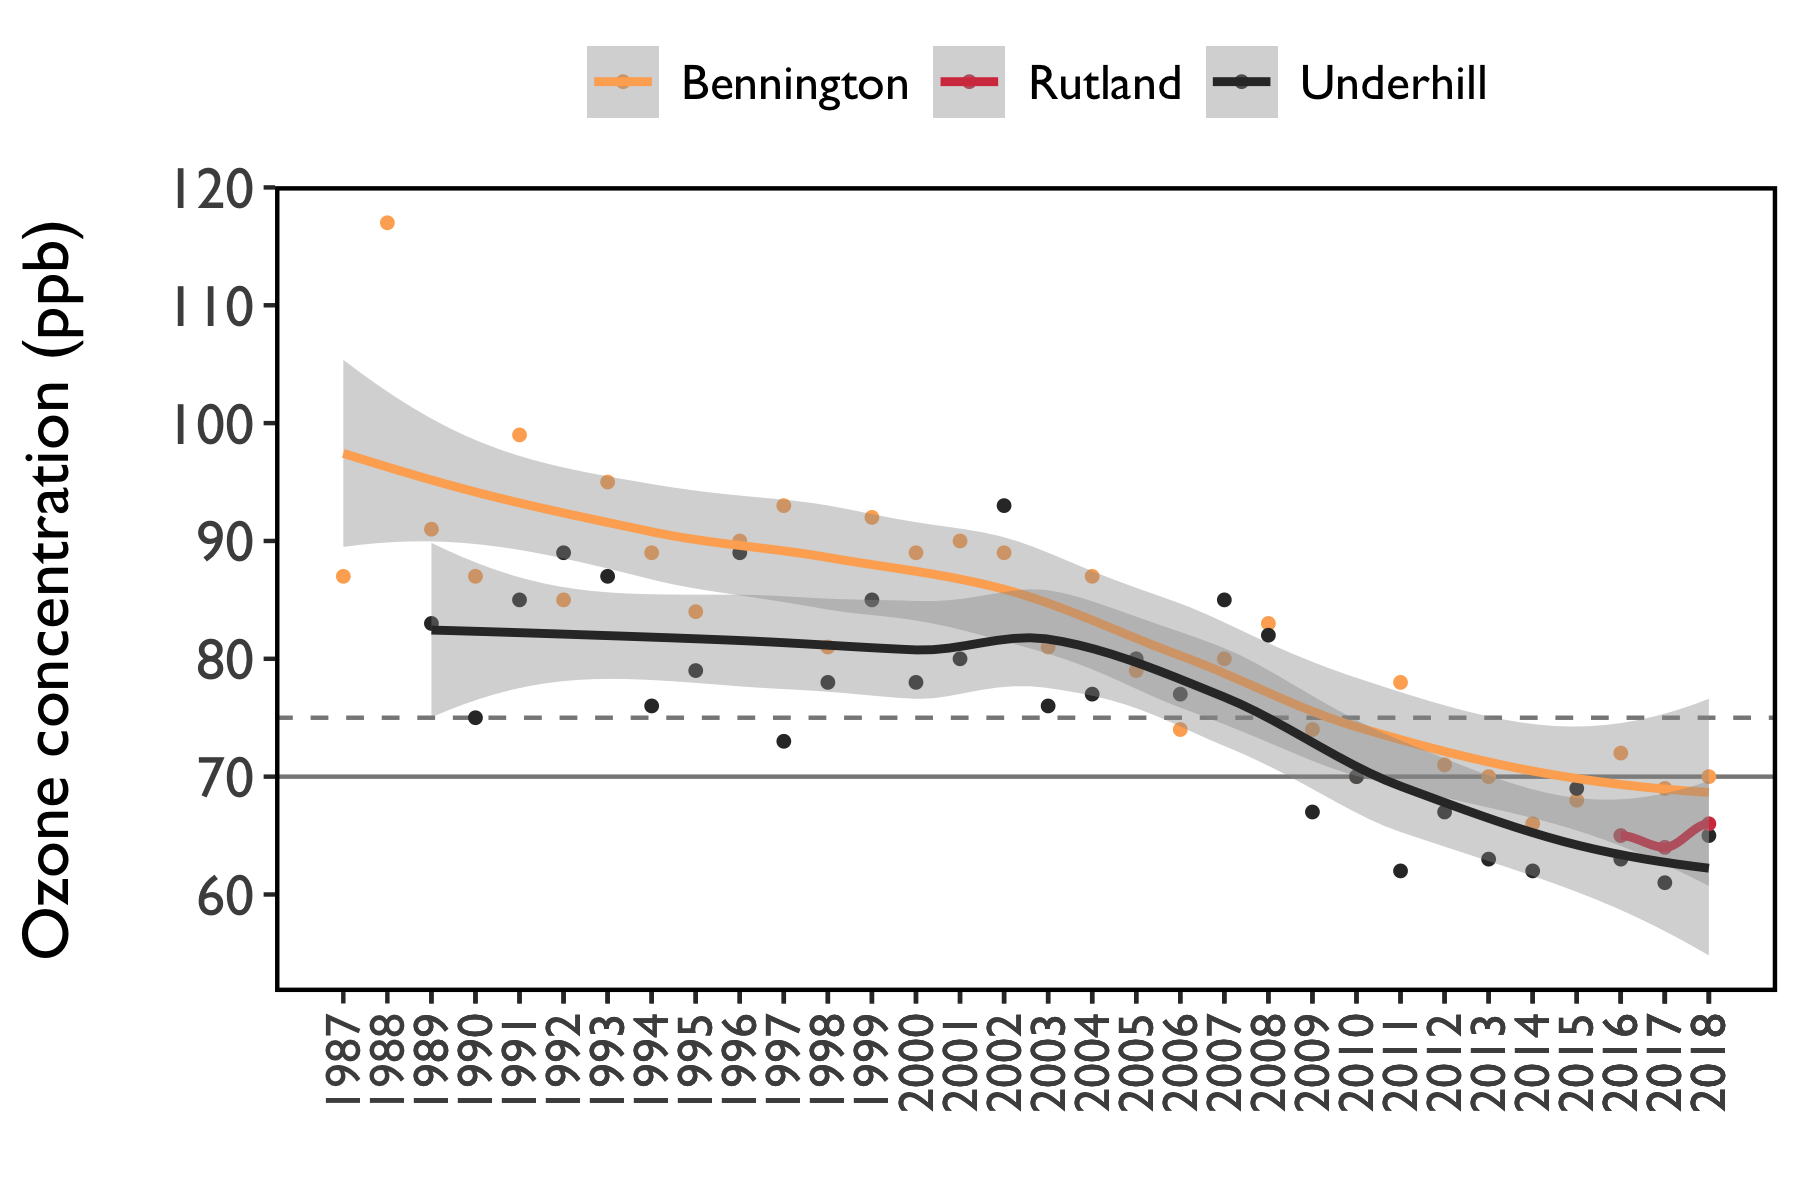
The Vermont Department of Environmental Conservation’s Air Quality and Climate Division measures hourly ozone concentrations, year-round, at long-term monitoring sites in Bennington (generally representative of southern Vermont) and at the FEMC site in Underhill (generally representative of Northern Vermont). While these two monitoring locations have effectively represented the northern and southern portions of the state for many years, another ozone monitor in the City of Rutland, in the central part of the state, began operation on April 1, 2016. With preliminary 2019 data now available, the three-year average design value can be compared to the other sites, which averages similarly to, and in-between, the concentrations monitored at Bennington and Underhill (see Figure 16).
2018 in Summary
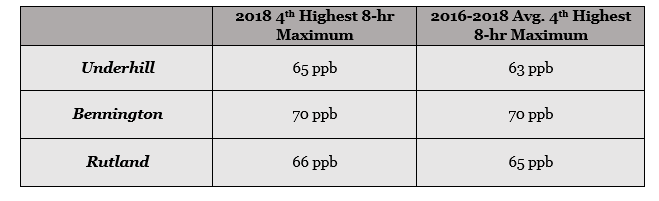
The most recent 2018 4th highest maximum and 3-year average ozone concentrations for Bennington, Rutland, and Underhill are summarized in the table below (Table 3). All of the monitored design values are at or below (i.e. in attainment of) the 70 ppb level of the current primary health standard. Bennington concentration levels for 2018 and the average of the past three years are both higher than the concentration levels measured at the Underhill station (Table 3). Concentrations at the Rutland station remains between the levels reported at the Bennington and Underhill sites.
Long-Term Trends
Long term trends in ozone in northern (Underhill), southern (Bennington), and the recent record for central (Rutland) Vermont are plotted in Figure 16. Peak daily 8-hour concentrations - most relevant to human health effects – have declined from a range of 85-90 ppb in the early 1990s to 60-70 ppb more recently. Bennington has reported ozone concentrations which have been consistently higher than the Underhill site, and recently, the Rutland site as well. Current ozone concentrations (4th highest 8-hour maximum) at the Bennington site are currently at the 2015 the maximum levels, based on the US EPA national ambient air quality standards (NAAQS). Underhill remains below these levels (Figure 16). While the recorded ozone concentrations at two monitoring sites in Vermont appear to indicate a downward trend over the past 30 years, recently, the data shows a leveling off of this trend as concentration levels seem to have stabilized.
Implications
Substantial improvements have been observed in Vermont ozone concentrations over the past 20 years. These reductions reflect effective controls on emissions of VOCs and nitrogen oxides from sources like power plants and motor vehicles – both existing within Vermont and in upwind urban and industrial regions.
Despite attaining the current ozone standard, the regionally episodic nature and the transport of ozone precursors (VOCs and nitrogen oxides) from upwind regions remain a serious threat to meeting the standard. Implementation of control measures on sources of ozone-forming precursor emissions across the United States is critical to eliminate the current widespread non-attainment of ozone standards in other, upwind areas and the resulting atmospheric transport that impacts human health and the environment downwind.
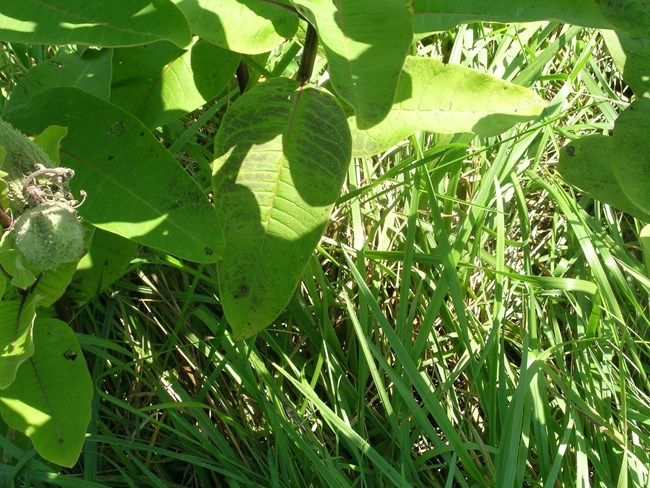
It should be noted that visible ozone injury symptoms are evidence of relatively extreme plant damage. Other effects - such as reduced photosynthesis, plant growth and carbon uptake, and increased susceptibility to disease and insect damage – can occur at ozone exposures lower than those which produce visible injury symptoms. No safe “threshold” concentration of ozone exposure has been identified below which no harmful environmental or human health effects are expected. Current ground level ozone exposures remain well above natural conditions, and further reductions will yield further benefits to the health of Vermont’s forest environment. While the substantial progress achieved over the past few decades is good news for Vermont’s citizens and our environment, we should work to continue this progress into the future.
Vermont’s ozone pollution has improved to levels where visible injury is rarely observed on our forest plants. However, plant health can still be affected at ozone exposures well below those which cause visible injury. Continued reductions are needed in the future.
FEMC Project Database Links
Ambient Air Monitoring for Ozone: https://www.uvm.edu/femc/data/archive/project/ambient-air-monitoring-for-ozone
Forest Inventory and Analysis Ozone Biomonitoring Program (active 1994-2010): https://www.nrs.fs.fed.us/fia/topics/ozone/