Authors
Hannah Peplinski
Atticus Tarleton
Zita Sapir
Sandrine Dincki
Grace McNally
Gillian L. Galford
About
Recommended citation for chapter
Peplinski, H., Tarleton, A., Sapir, Z., Dincki, S., McNally, G., Galford, G.L., 2026, Climate Change in Vermont. In Galford, G.L., Balerna, J.A., Turner H., Sardonis, A., Peplinski, H. (Eds), The Vermont Climate Assessment 2025. Burlington, Vermont: Climate Measurements Center of Excellence, Gund Institute for Environment at the University of Vermont. DOI: 10.5281/zenodo.20272849. Accessed online at https://vtclimate.org
Author Contributor Roles Taxonomy (CRediT) statement
Hannah Peplinski: Supervision, Conceptualization, Methodology, Data Curation, Validation, Analysis, Writing, Visualizations, Editing; Atticus Tarleton: Conceptualization, Analysis, Writing, Investigation, Data Curation, Visualizations, Zita Sapir: Conceptualization, Writing-Original Draft, Investigation, Analysis; Grace McNally: Methodology, Data Curation, Visualizations; Sandrine Dincki: Writing-Original Draft; Gillian L. Galford: Supervision, Writing-Reviewing and Editing
Acknowledgements
We thank our partners at the National Weather Service whose thoughtful reviews and contributions helped refine and strengthen this chapter.
Downloads
Please use the following accessible downloads for your own needs.To find downloads of other chapters in VCA 2025, please go to Downloads.
2.0 Executive summary
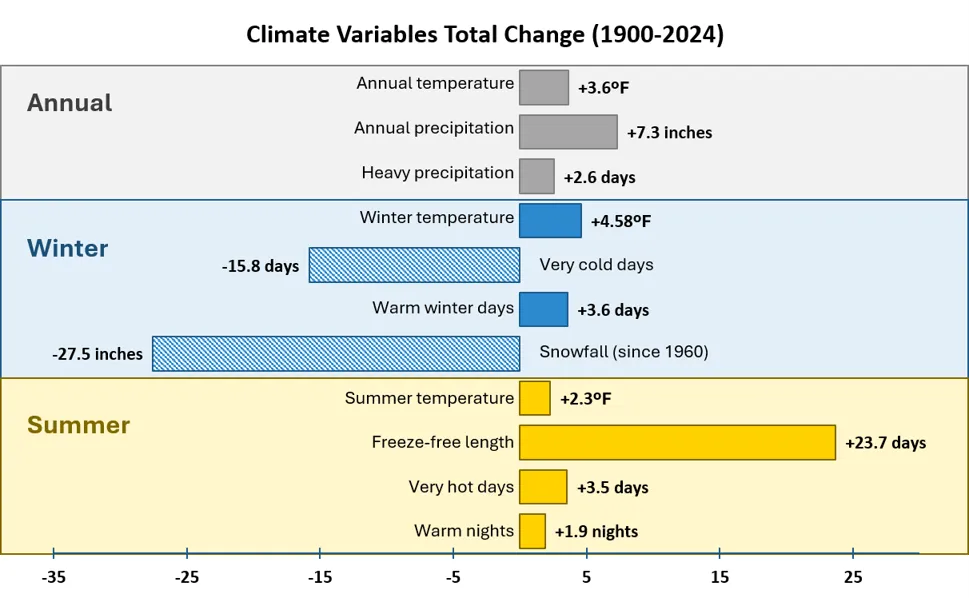
As a result of increasing global atmospheric greenhouse gas concentrations, Vermont’s climate is changing (Figure 2-1). While national and international assessments review the impacts of global climate change, those assessments can be difficult to interpret and apply locally. This chapter focuses on trends in changing climate that reflect Vermonters’ direct experiences and provide the basis for sector-specific (e.g., Infrastructure, Agriculture and Food Systems) impacts covered throughout the Vermont Climate Assessment (VCA).
This chapter examines long-term trends in data collected locally by the National Weather Service (NWS) paired with analysis of extremes (e.g., flooding and drought) from national datasets. Trends are presented for all of Vermont and by NWS climate division (Northeastern, Southeastern, and Western Vermont), which include distinctions such as the Western division’s proximity to Lake Champlain, exposure to winds from the Atlantic Ocean in the Southeastern division, and higher average elevations across the Northeastern division’s Green Mountains.
Analyses were conducted across three time periods following the format of VCA 2021 (Galford et al., 2021): long-term (1900–2024), mid-term (1960–2024), and near-term (1990–2024). To best represent longer-term climate trends, data included in trend analyses were averaged by decade. The most recent period (2020–2024) is represented as a half-decade average.
Vermont’s climate is getting warmer—at an accelerating pace. The total change in average annual temperature is largest since 1900 (+3.6ºF/2.0ºC since 1900, +3.0ºF/1.7ºC since 1960, and +2.5ºF/1.4ºC since 1990), but the rate per decade has been climbing (+0.8ºF/decade; +0.4ºC/decade since 1990 compared to +0.1ºF/decade; 0.06ºC/decade since 1900). The Southeastern climate division experienced the fastest long-term increase in annual temperatures (+4.8ºF/2.7ºC since 1900 or +0.2ºF/decade; 0.1ºC/decade).
High elevation areas (over 1,000 ft) are warming faster than the rest of the state, especially in the near-term when annual average temperatures increased 2.5 times faster each decade than for lower elevations sites (+2.1ºF/decade; 1.2ºC/decade for high elevations compared to +0.5ºF/decade; 0.3 ºC/decade at lower elevations).
Nights are warming faster than days. The average minimum temperature, which generally occurs at night, is 4.8ºF/2.7ºC warmer since 1900, which is two times greater than the change in average maximum temperatures (+2.4ºF/1.3ºC) since 1900. Warm summer nights—when temperatures do not cool below 70ºF (21.1ºC)—have increased a total of 1.9 days since 1900, and the fastest trending increase is in the near-term (+0.5 days/decade). The Western division experienced the greatest total increase (+2.7 days since 1900 ) in warm summer nights.
Cold extremes are vanishing. Very cold winter days (Dec–Feb), with minimum temperatures below 0ºF (-17.8ºC), have dropped nearly 16 days since 1900, driven by a loss of 3.6 days/decade in the near-term. Declining very cold days is strongest in the Northeastern division (-21.4 days/year since 1900) driven by a near-term declining trend of 4.2 days/decade. Warm winter days—when maximum temperatures are above 50ºF (10ºC)—have increased a total of 3.6 days since 1900, with the largest total change in the Southeastern division (4.4 days/year). Freeze-thaw days—when minimum temperatures are below 28ºF (-2.2ºC) and maximum temperatures are above 32ºF (0ºC)—are decreasing in the Southeastern division and increasing in the Western division. This is consistent with temperature trends, as the Western division sees more days above 32ºF (0ºC) with winter warming, while the Southeastern division has seen fewer days reaching below 28ºF (-2.2ºC). Vermont’s average annual freeze-free period (consecutive days above freezing) has lengthened by over three weeks (23.7 days/year) since 1900.
Hot extremes are rising. Days with maximum temperatures over 90ºF/32ºC (hot days) are increasing in the near-term (1990–2024) +0.8 days/decade. Summer temperatures increased 2.3ºF (1.3ºC) since 1900, with faster warming trends in the near term (+0.6ºF/decade; +0.3ºC/decade). In the last five years, the Southeastern division experienced the greatest number of hot days on record since 1900 (15.3 days/year exceeding 90ºF). This is double that of the previous decade (7.6 days/year). Impacts from warm nights and hot days are exacerbated by increasing humidity.
Vermont’s climate is wetter, though recent trends show high variability. Average annual precipitation has increased 7.3 inches/185 mm since 1900 (0.8 inches/decade; 21.1 mm/decade), with all seasons experiencing significant increases. However, precipitation has been highly variable recently, creating insignificant trends in nearer terms, annually and across all seasons. Winter precipitation falls more often as rain than snow; snowfall has decreased almost 25 inches (635 mm) since 1990, driven primarily by decreases in snowfall in the Northeastern and Southeastern divisions.
Extreme weather events (floods/droughts) will likely continue. Heavy precipitation days (24-hour periods with >1 inch/25.4 mm of precipitation) occurred 40% more often in the most recent decade compared to the early 1900s. All three climate divisions have experienced more frequent heavy precipitation events since 1900. This corresponds with both extreme flooding events as well as prolonged periods between precipitation events, which sometimes result in dry spells or drought. Variability in precipitation extremes has been observed across the U.S., and is consistent with slowing, but increasing trends of wet conditions in Vermont alongside increasing dry conditions.
Source: NOAA Regional Climate Centers (2026)
Daily life in Vermont is rapidly changing alongside changing climate trends, requiring planning and adaptation across all sectors. Vermonters can use evidence of climate change statewide and across the climate divisions to develop plans of action to protect the social, economic, and environmental well-being of people, communities and ecosystems. Readers are invited to explore the following chapters of the VCA for sector-specific evidence of the effects of these climate change indicators, as well as adaptation strategies and opportunities to build climate resilience across the state.
2.1 Key messages
Vermont’s annual average temperature has increased by 3.6ºF (2ºC) since 1900, with winters warming faster than summers and Southeastern Vermont warming the most, by 4.9ºF (2.7ºC).
Since 1900, Vermont’s average annual freeze-free period has lengthened by 23.7 days, and the number of very cold winter days has decreased by 15.8 days.
Vermont’s average annual precipitation increased by 20% between 1900 and 2024; from 35.8 inches (909 mm) to 43.1 inches (1,095 mm).
Extreme weather events, such as floods, droughts, and heat waves, will continue to occur. There are 41% more heavy rain days per year today (8.7 days) than in the 1900s (6.2 days) and the number of very hot summer days has doubled (3.4 to 7 days).
With increasing global emissions and temperatures, Vermont is expected to experience wetter, warmer, and more volatile weather in the future along with the rest of the Northeast U.S.
2.2 Background
Both weather and climate pertain to temperature, precipitation, wind, and humidity, but these terms are distinct. Weather describes conditions over days and weeks (“what you get”), while climate describes long-term trends over decades (“what you expect”). A given location’s climate is commonly defined by 30 year timespans; often referred to as climate normals (NOAA National Centers for Environmental Information, 2025). Therefore, fixed 30+ year averages are used throughout this report as a proxy for climate trends.
2.2.1 Climate change and emissions
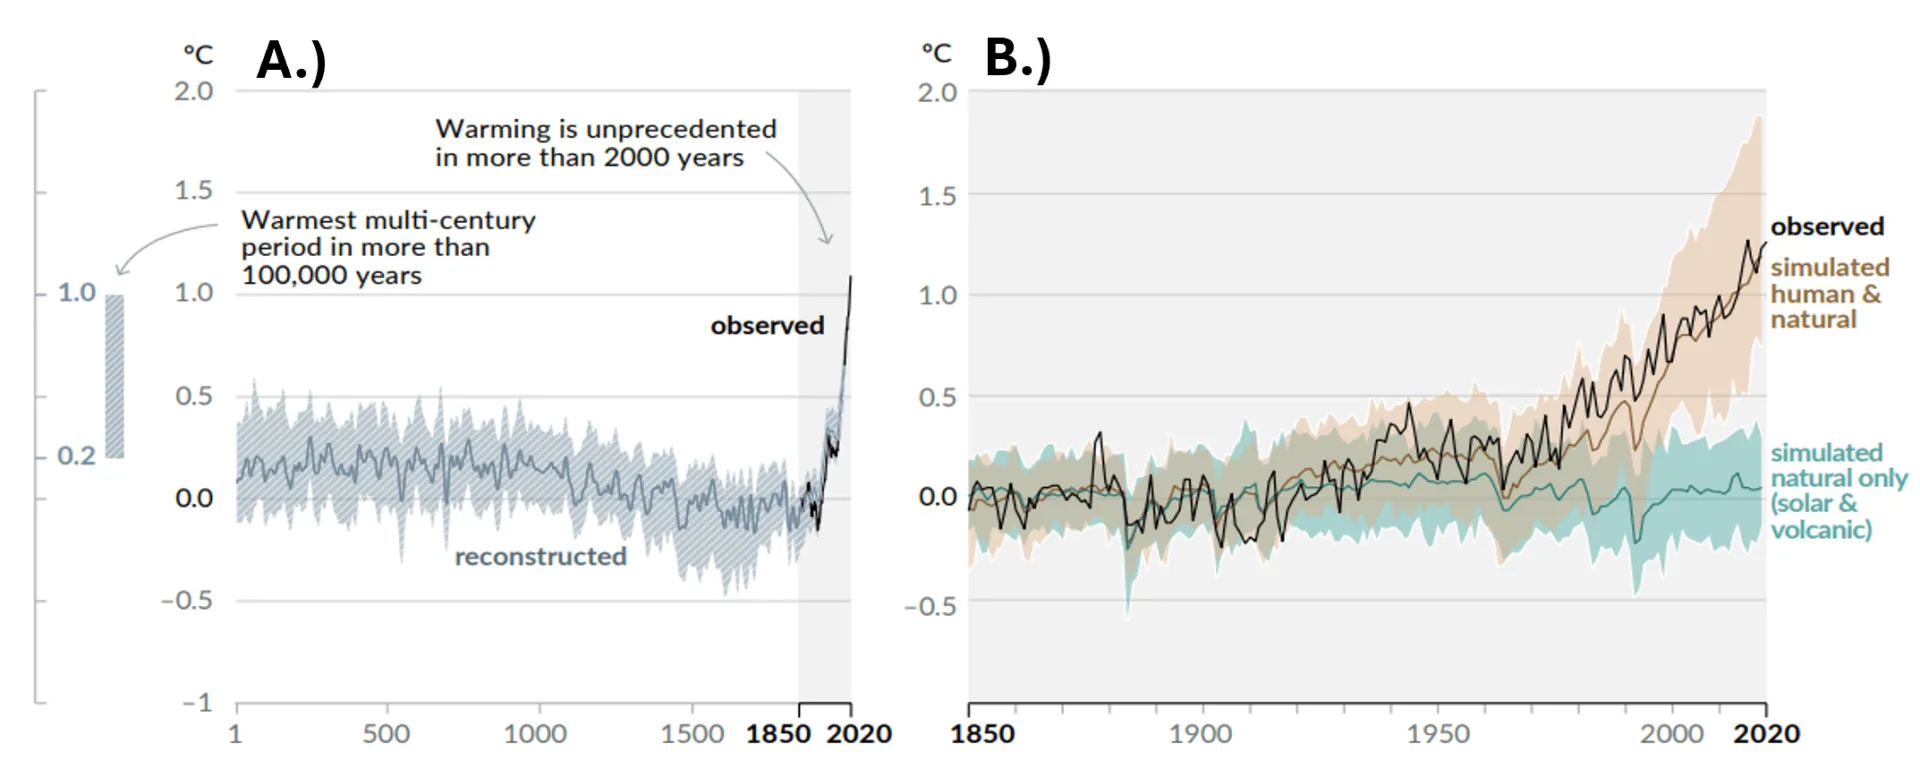
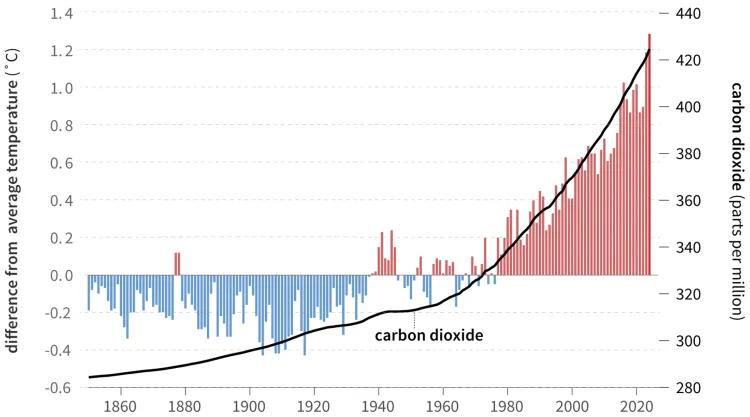
The Intergovernmental Panel on Climate Change (IPCC) is clear: “human activities, principally through emissions of greenhouse gases (GHGs), have unequivocally caused global warming” (IPCC, 2023). GHGs, mostly found in the troposphere of Earth’s atmosphere, trap heat by absorbing the infrared radiation emitted from the earth’s surface and radiating a portion back toward the ground. This is referred to as the greenhouse effect, and causes warming of the Earth’s atmosphere, which, in turn, heats the Earth’s surface. Historically, there has been a balance between naturally released GHGs from biological and geological processes (e.g., decomposition of organic material, volcanic eruptions) with natural uptake of GHGs (e.g., forests, oceans). This balance warmed the surface just enough to be habitable for life on Earth. Human activities, especially since the Industrial Revolution, have disrupted this balance, causing abnormal, extreme warming trends (Figure 2-2A). Historically reconstructed (1 AD–1850) and observed (1850–2020) temperature trends display unprecedented increases in global average temperature over the past 200 years. Comparison between simulated models with both human and natural warming factors (e.g., solar and volcanic activity) determined that natural factors alone cannot explain the unprecedented increase in global temperatures. Instead, the major warming factors are associated with human activities producing GHG emissions (Figure 2-2B, Figure 2-3).
The combined effects of climate change and human development have reduced the functionality of GHG and carbon sinks (i.e., ocean, forests, soil) through deforestation, oceanic warming, and erosion. These functional disturbances further exacerbate the excess accumulation of GHGs in the atmosphere and the associated atmospheric warming potential (United Nations Environment Programme, 2024). Global GHG concentrations and rising temperatures climbed exponentially following the “third industrial revolution,” which began in 1950 (Mohajan, 2021). Following this, societies across the globe began demanding more energy and fuel to support technological advancements resulting in exponential GHG emission levels. Subsequently, GHGs like carbon dioxide and global average temperature anomalies have increased together over time (Figure 2-3).
Rising global temperatures have substantial impacts on the planet’s natural cycles, expediating warming trends and resulting in drastic changes to daily life. Therefore, as global emissions rise, temperature and precipitation extremes are expected to follow (see 2.10.1). Warmer atmospheric temperatures will continue to exacerbate both dry and wet precipitation extremes (Hoerling, 2018), especially as every 1ºF (0.6ºC) of warming increases the air’s moisture-holding capacity by 4%. Warmer, more saturated air maintains more thermal and potential energy, increasing the potential for more intense storms, hurricanes, and winds (Dupigny-Giroux et al., 2018; Hayhoe et al., 2018; see 2.6.1). Conversely, lengthy dry spells can occur when surface water evaporates without replenishment. Dry spells can develop into serious droughts (see 2.6.2), exacerbated by increased evaporation rates from higher air temperatures.
The remainder of this chapter outlines climate trends observed nationally, within the Northeast U.S., and in Vermont. It includes historical and projected trends across temperature, precipitation and weather extremes, to provide Vermonters with a sense of how the state’s climate has already changed, and what is to come. These climate trends serve as a foundation for the following chapters, which discuss climate-change related impacts experienced across the prominent social and economic sectors in Vermont, and establish the urgent need for adaptation and resilience strategies.
2.3 Methods
While national and regional trends are important components in a comprehensive understanding of how the climate is changing, state-specific data is required for effective, localized adaptation. Using data collected from weather stations in Vermont (NOAA Regional Climate Centers, 2026), this chapter connects national and regional trends to those occurring in Vermont, as well as what is projected for the state’s future. This data is then applied across sectors throughout the report to assess how climate trends are impacting the daily lives of Vermonters, allowing for improved local and statewide planning as well as adaptation strategies.
This assessment of Vermont’s changing climate includes temperature trends, precipitation trends, and extreme events (e.g., flooding, droughts) based on historical observations. The changes observed in recent decades are the best predictors of what may come in the next one to two decades; however additional Vermont-specific climate modelling can be found in 2.7.
2.3.1 Vermont’s weather station data and climate divisions
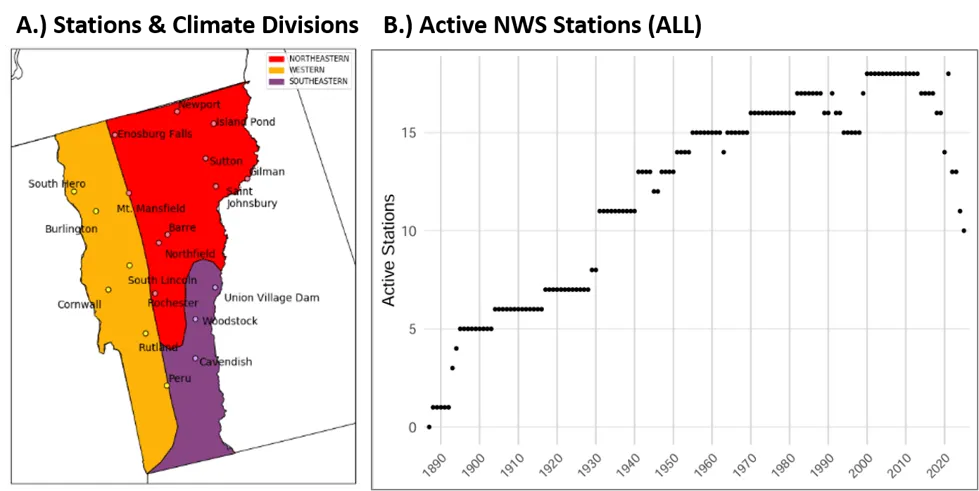
Our climate analysis uses data from 19 weather stations in Vermont, all part of the NWS Cooperative Observer Program (COOP) network (NOAA Regional Climate Centers, 2026; Figure 2-4). These stations were selected because they provide records for at least 30 years, making it possible to compute long-term annual and seasonal climate variables, and maintain methodological consistency with VCA 2021 (Galford et al., 2021). When data were available, climate variables were calculated both statewide (19 stations) and for each of Vermont’s three climate divisions (Northeastern, Western, and Southeastern), which are defined by NWS. Because the division boundaries do not follow county lines, some counties can be included in multiple divisions (Table 2-1); Figure 2-4 displays which divisions represent most of each county to help with localized planning.
Source: NOAA Regional Climate Centers (2026)
Note: Climate divisions are defined by the National Weather Service and indicated by the differently shaded divisions
Climate Division | Counties included |
|---|---|
Northeastern | Caledonia, Essex, Orange, Orleans, Washington |
Southeastern | Bennington, Windham, Windsor |
Western | Addison, Chittenden, Franklin, Grand Isle, Lamoille, Rutland |
Source: NOAA Regional Climate Centers (2026)
Climate divisions in Vermont are areas of monitoring and analysis defined by the NWS. They represent areas influenced differently by the state’s geophysical properties such as elevation and proximity to large bodies of water (NCEI, 2026). Western Vermont encompasses the Champlain Valley and the lower slopes of mountain ranges on both sides of Lake Champlain (around 500 feet (ft) elevation). Climate in this division is largely influenced by the lake’s moderating effects on temperature, and the north-south channeling of wind between the Green Mountains and Adirondacks. The Northeastern division includes upland and mountainous areas such as Jay Peak, Mount Mansfield, and the Northeast Kingdom and its climate is largely influenced by its elevation extremes. Meanwhile, the Southeastern division, which includes Woodstock, Cavendish, and Union Village Dam, is climatologically affected by its relative proximity to the Atlantic Ocean and lower latitude.
2.3.2 Statistical analyses
National and Regional
National and regional analyses were conducted to provide greater context for climate change impacts occurring in Vermont. They used data from the National Time Series and Regional Time Series datasets published by NOAA’s National Centers for Environmental Information (NCEI). National data only included the continental United States (U.S. CONUS), and regional data was representative of the Northeast Climate Region which includes Connecticut, Delaware, Maine, Maryland, Massachusetts, New Hampshire, New Jersey, New York, Pennsylvania, Rhode Island, and Vermont. Data were averaged by decade using all months and years between 1900–2024, and change analyses were conducted mirroring Vermont analyses described below; however, no data filtering was applied (see 2.3.3).
Vermont
Analyses are consistent with those discussed in VCA 2021 (Galford et al., 2021) and were conducted using RStudio (R Core Team, 2026). As mentioned, all measures of change (both total and trending) were calculated using a decadal average of each metric to buffer annual fluctuations and best represent long-term, climate trends.
Time series data from each station was used to assess trends in average annual and seasonal temperature and precipitation measures, as well as the annual frequency of extremes over different time periods (long-, mid-, near-term). Sen slope was calculated to determine the magnitude and direction of climate trends calculated using the decadal average of each metric, then tested for significance using the Mann-Kendall test (Kendall, 1975; Mann, 1945), which indicates the significance of this trend, or its likelihood of occurring by random chance. Both the Mann-Kendall and Sen’s slope tests are not subject to major influences from non-normal data often found when analyzing long-term climate trends (Gocic & Trajkovic, 2013). The strength of climate trends can be interpreted by the magnitude of Sen’s slope when considering each metric. Increasing or decreasing trends were classified as statistically significant when the provided p-value from the Mann-Kendall test was greater than 0.05, meaning that the trend was significant at a 95% confidence interval or 0.10, meaning that the trend was significant at a 90% confidence interval (Gocic & Trajkovic, 2013). However, all trends identified as “significant” throughout the discussion of analyses are indicative of 95% confidence, unless otherwise stated.
Average decadal values were calculated annually, seasonally, statewide, by climate division, and by elevation for many metrics (Table 2-2; Figure 2-4). Seasons were defined meteorologically: winter includes December, January, and February (DJF), spring includes March, April, and May (MAM), summer includes June, July, and August (JJA), and fall includes September, October, and November (SON). Average decadal values for each station were calculated by averaging the annual values of each year within a given decade. Climate division averages were then calculated by averaging all decadal values of stations within each division together as indicated by Table 2-2, while statewide averages used data across all stations. Climate divisions were defined by NWS as described in 2.3.1 (NCEI, 2026). Meanwhile, high-elevation and low-elevation decadal averages were subset by elevation classification, then averaged together. Each station’s recorded elevation (NOAA RCC, 2026) was used to classify high (greater than 1,000 ft above sea level) and low elevation stations. To prevent statistical bias, analyses between elevation classes were only conducted in near- (1990–2024) and mid-terms (1960–2024), as many high elevation stations were not active prior to 1960 (Table 2-2).
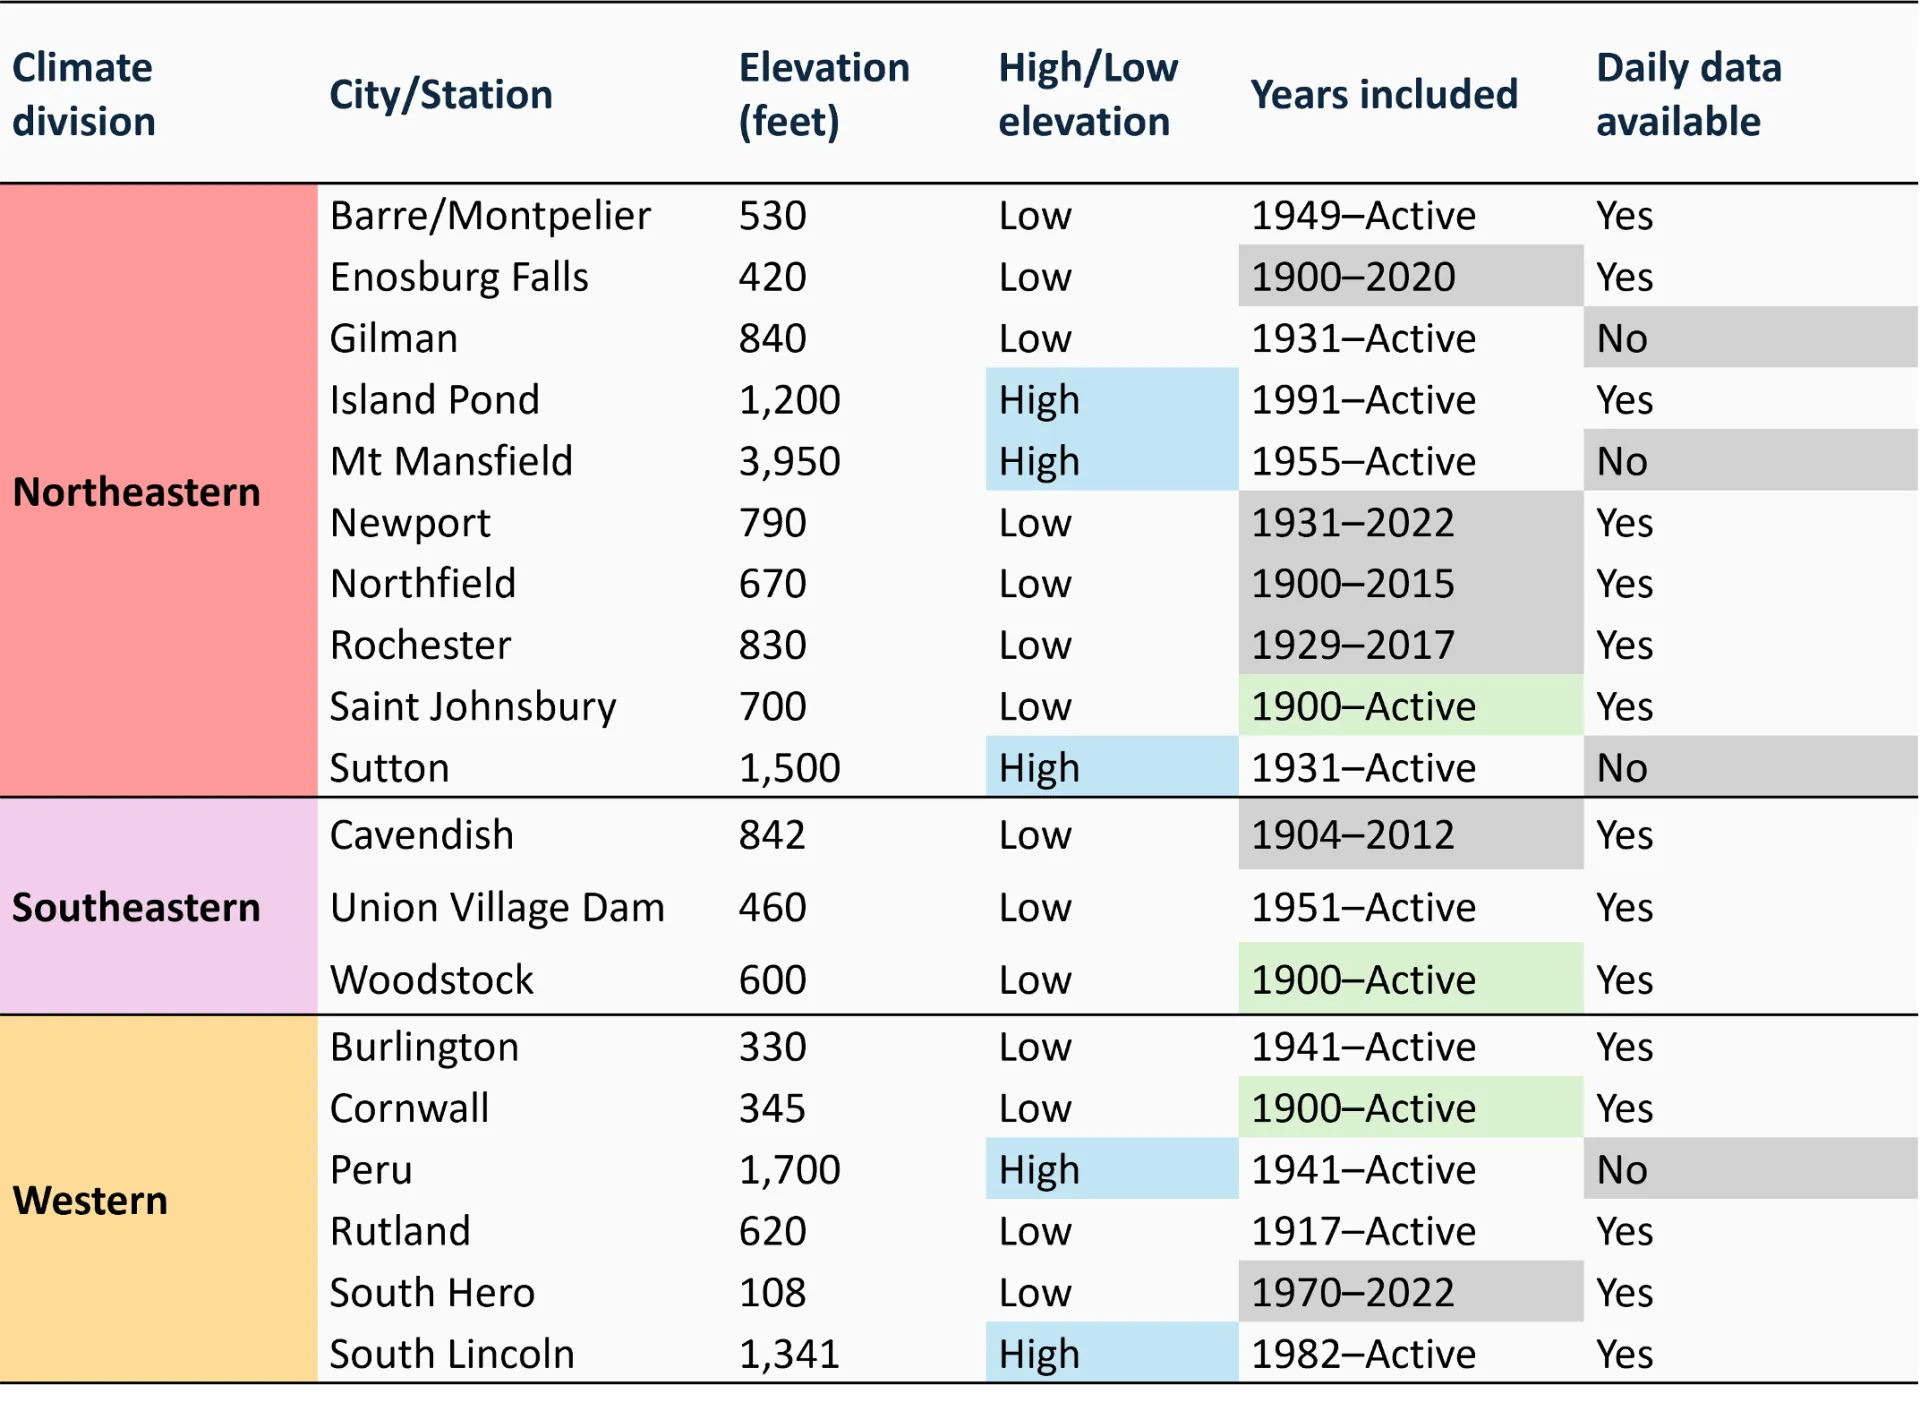
Source: NOAA Regional Climate Centers (2026)
Note: 19 weather stations used in VCA 2021 (Galford et al., 2021) were analyzed in this report. Stations are categorized by their representative climate division, the nearest city/town to the station chosen (often sharing the same name as the station), their elevation, whether that elevation is high (blue) or low (white) based on a 1,000 feet (ft) threshold, and the range of years each station contributed data for use in report analyses. Stations that are currently active and contributed data through 2024 are labelled as “Active,” and those highlighted as green contributed annual data for the entire time period (1900–2024). Gray colored cells under “Years included” indicate the station is no longer active as of 2024. Reliable daily data needed for temperature and precipitation extremes analyses were not available for 4 stations: Gillman, Mt. Mansfield, Sutton, and Peru. Stations were excluded from certain analyses if missing more than five days/month, 65 days/year, or 3 years/decade
To assess changes in absolute humidity in section 2.4.4, hourly time-series data from 1940 through 2024 were sourced from ERA5 reanalysis data provided by the Copernicus Climate Change Service (C3S, 2026). Dewpoint and temperature data were extracted for three locations using the geographical coordinates of 3 stations representing Vermont’s most populous areas within each climate division and corresponding NWS stations used in this report; Burlington (Western), Woodstock (Southern), and Montpelier (Northeastern). Population centers were selected because of the substantial effects of humidity on human health (see Human Health 10.3.1) with urban heat island effects potentially amplifying heat stress impacts (Yang et al., 2023). Absolute humidity was calculated by first converting dew point temperatures into actual vapor pressure, then into a measure of mass per unit of volume (grams per cubic meter [g/m³]). Mean, minimum, and maximum absolute humidity calculations were then averaged by day, then month, then season or by year, and finally by decade both individually and across the three stations. Trends were then calculated by Sen’s slope, and substantiated with Mann-Kendall. While single stations cannot accurately represent an entire climate division’s humidity, they are a proxy for diversified effects of climate change on absolute humidity across the state. Future research should expand this dataset to improve the accuracy of these trend analyses, especially when considering future projections.
2.3.3 Quality assurance and control
The number of stations included in analyses each year varied for two reasons: 1) stations were added or retired over the full period (1900–2024) and 2) stations lacked complete records for certain months or years even when they were active (described further below). For example, only 13 of the 19 stations were active at the time of the data gathering in the fall of 2025 that contributed to analyses through 2024; a subset of 15 out of 19 stations was also used for analyses requiring consistent daily station data (e.g., extremes; Table 2-2). Stations were further subset by climate division. One station within all three climate divisions contributed data across the entirety of the analysis range 1900–2024 and all variables: Cornwall (Western division), Woodstock (Southeastern) and Saint Johnsbury (Northeastern).
Several steps were taken for quality control and to verify the validity of results. Station data were used for annual analyses only for years with ten or more months of available observations, and a month was included only if it had less than five days of missing observations. Seasonal analyses were also limited to stations with usable observations across all three months (that is, when five days or less of observations were missing in a single month).
Sensitivity tests were completed to evaluate the potential effects of a varying number of stations on results. Representative stations for these tests were the stations with the longest complete record in the climate division that were not subject to relocation1. The representative stations’ trend and decadal variability analyses were compared to analyses for the climate division. Results from sensitivity testing showed consistency in the magnitude and direction of trends and decadal variability between individual stations and their climate division over all time periods. The varying number of stations over time generally does not appear to affect the strength or direction of trends. For instance, the annual standard deviation around the long-term (1900–2024) mean temperature does increase as the Mount Mansfield station comes online in 1955, but the inclusion of this station does not appear to have a significant impact on trends overall.
- Some monitoring stations have been relocated since 1900; therefore, the location with the longest consecutive record since the time of its move was selected. For instance, the “Burlington” station has been in three locations in its history, so only the most recent and longest held location was used for analyses.
2.4 Temperature
2.4.1 Regional temperature
U.S. average air temperatures are warming faster than global average temperatures but with substantial regional and seasonal variability (Whitehead et al., 2023; Young & Young, 2025). Rising temperature trends are increasing faster in the Northeast U.S. compared to the rest of the continental U.S. (CONUS; NOAA NECI, 2026; Figure 2-5). Between 1900–2024, the average annual temperature of the Northeast U.S. region warmed twice as fast as the CONUS (0.3ºF/decade; 0.2ºC/decade compared to 0.2ºF/decade; 0.1ºC/decade). In the last 30 years (1995–2024), the Northeast warmed nearly 18 times as much as the CONUS, averaging annual temperatures that were 2.7ºF (1.5ºC) warmer than the early 20th century (1900–1929; Figure 2-5). Additionally, within the most recent half-decade, the Northeast averaged 48.5 ºF (9.2 ºC), a total of 2.5 ºF (1.4ºC) warmer than the long-term average.
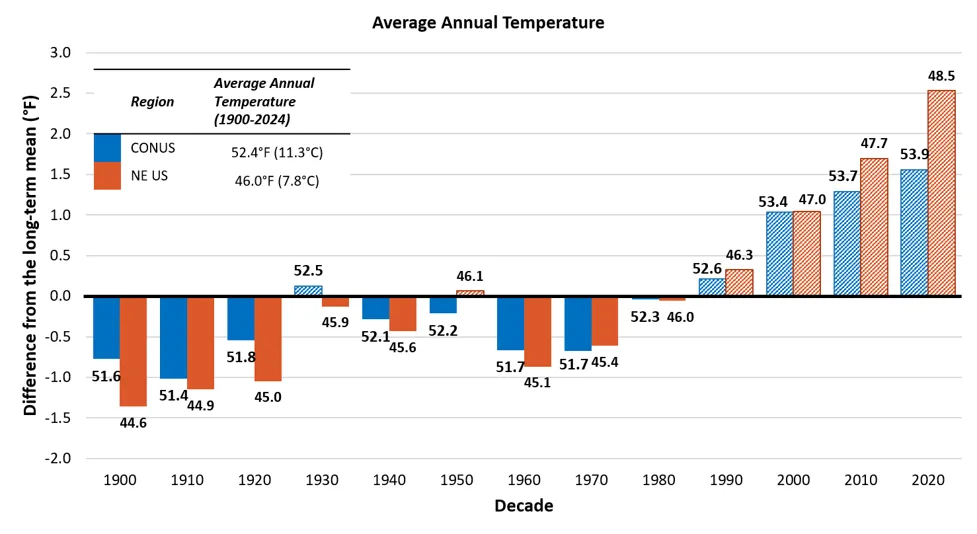
Source: NOAA NECI, National and Regional Time Series (2026)
Note: Averages calculated using a 12-month timescale annually, then by decade using data consolidated in the Average Temperature parameter with no filters and including all months, years 1900–2024. Long-term average is indicated by the horizontal axis (y=0), for CONUS this axis represents an average of 52.4ºF(11.3ºC), while the axis represents an average of 46.0ºF (7.8ºC). Data labels above each bar indicate the decade’s average value, bar heights reflect precise underlying values; labels are rounded to one decimal place
2.4.2 Annual temperature
Vermont’s temperatures are warming at an accelerating rate (Figure 2-6; Table 2-3). Most of the temperature increases in Vermont have occurred within the past 35–60 years and the rate of change is accelerating. Temperatures have significantly increased statewide since 1900 from 42.1ºF (5.6ºC) to 45.7ºF (7.6ºC), a 9% increase or +0.1ºF/decade (+0.06ºC/decade). Since 1960, the rate of change tripled to an average of +0.3ºF/decade (+0.2ºC/decade). While the trend was statistically insignificant, temperatures rose again between 1990–2024 by an average of +0.8ºF/decade (0.4ºC/decade), more than double the amount between 1960–2024. These increases are driven by significant changes in the Southeastern climate division, which experienced the fastest long-term increase in annual temperatures (+4.8ºF/2.7ºC since 1900 or +0.2ºF/decade; 0.1ºC/decade; see 2.10.2). Additionally, within the most recent half-decade the Western climate division saw their greatest average annual temperature on record of 47.2 ºF (8.4 ºC), over 3.0ºF (1.7ºC) warmer than the long-term average (44.0ºF; 6.7ºC).
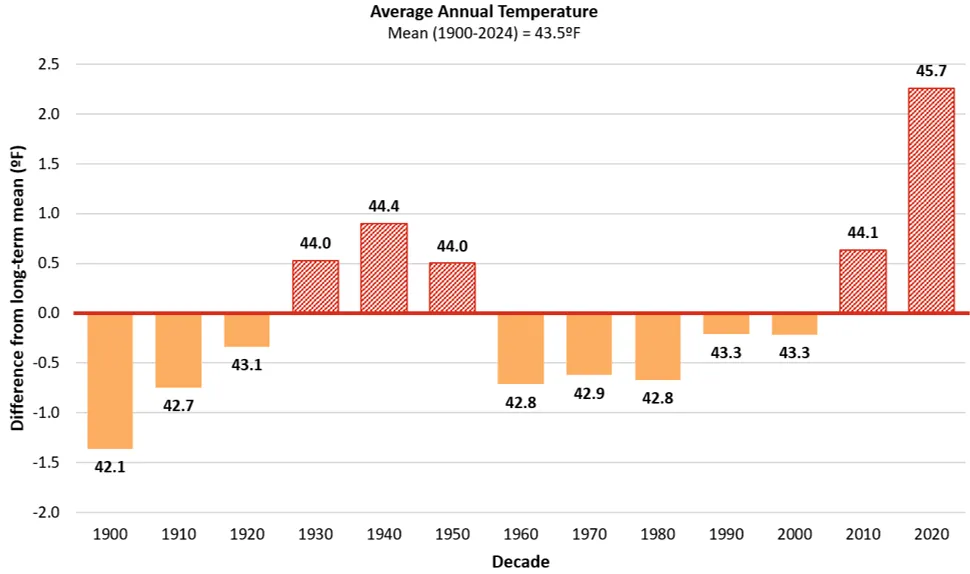
Source: NOAA Regional Climate Centers (2026)
Note: Long-term average annual temperature is indicated by the horizontal axis (y=0), equaling 43.5ºF (6.4ºC). Decades above the long-term average are red and striped, while decades below are orange and solid. Data labels above each bar indicate the decade’s average value, bar heights reflect precise underlying values; labels are rounded to one decimal place
Average minimum daily temperatures have significantly increased statewide by more than 0.2ºF/decade (0.1ºC/decade) since 1900, representing a total increase of 4.8ºF (2.7ºC) and corresponding with reduced nighttime cooling (Table 2-3). In the mid-term (1960–2024), the increasing trend more than doubled to 0.5ºF/decade (0.3ºC/decade) before doubling again in the near term (1990–2024) to 1.0ºF/decade (0.6ºC/decade), signaling an acceleration in warming. Average maximum daily temperatures have increased more slowly from 53.4ºF (11.9ºC) to 55.8ºF (13.2ºC), a 4% total increase. Statewide increases in minimum and maximum temperatures are largely driven by significant changes in the Southeastern climate division (see 2.10.2), which experienced a 4.7ºF/2.6ºC total increase in both minimum and maximum temperatures since 1900. Both minimum and maximum temperatures increased at an accelerating rate in the Southeastern climate division from 0.2ºF/decade (0.1ºC/decade) in the long-term to 1.0ºF/decade (0.6ºC/decade) in the near-term for minimum temperatures and from 0.2ºF/decade (0.1ºC/decade) in the long-term to 0.8ºF/decade (0.4ºC/decade) in the near-term for maximum temperatures.
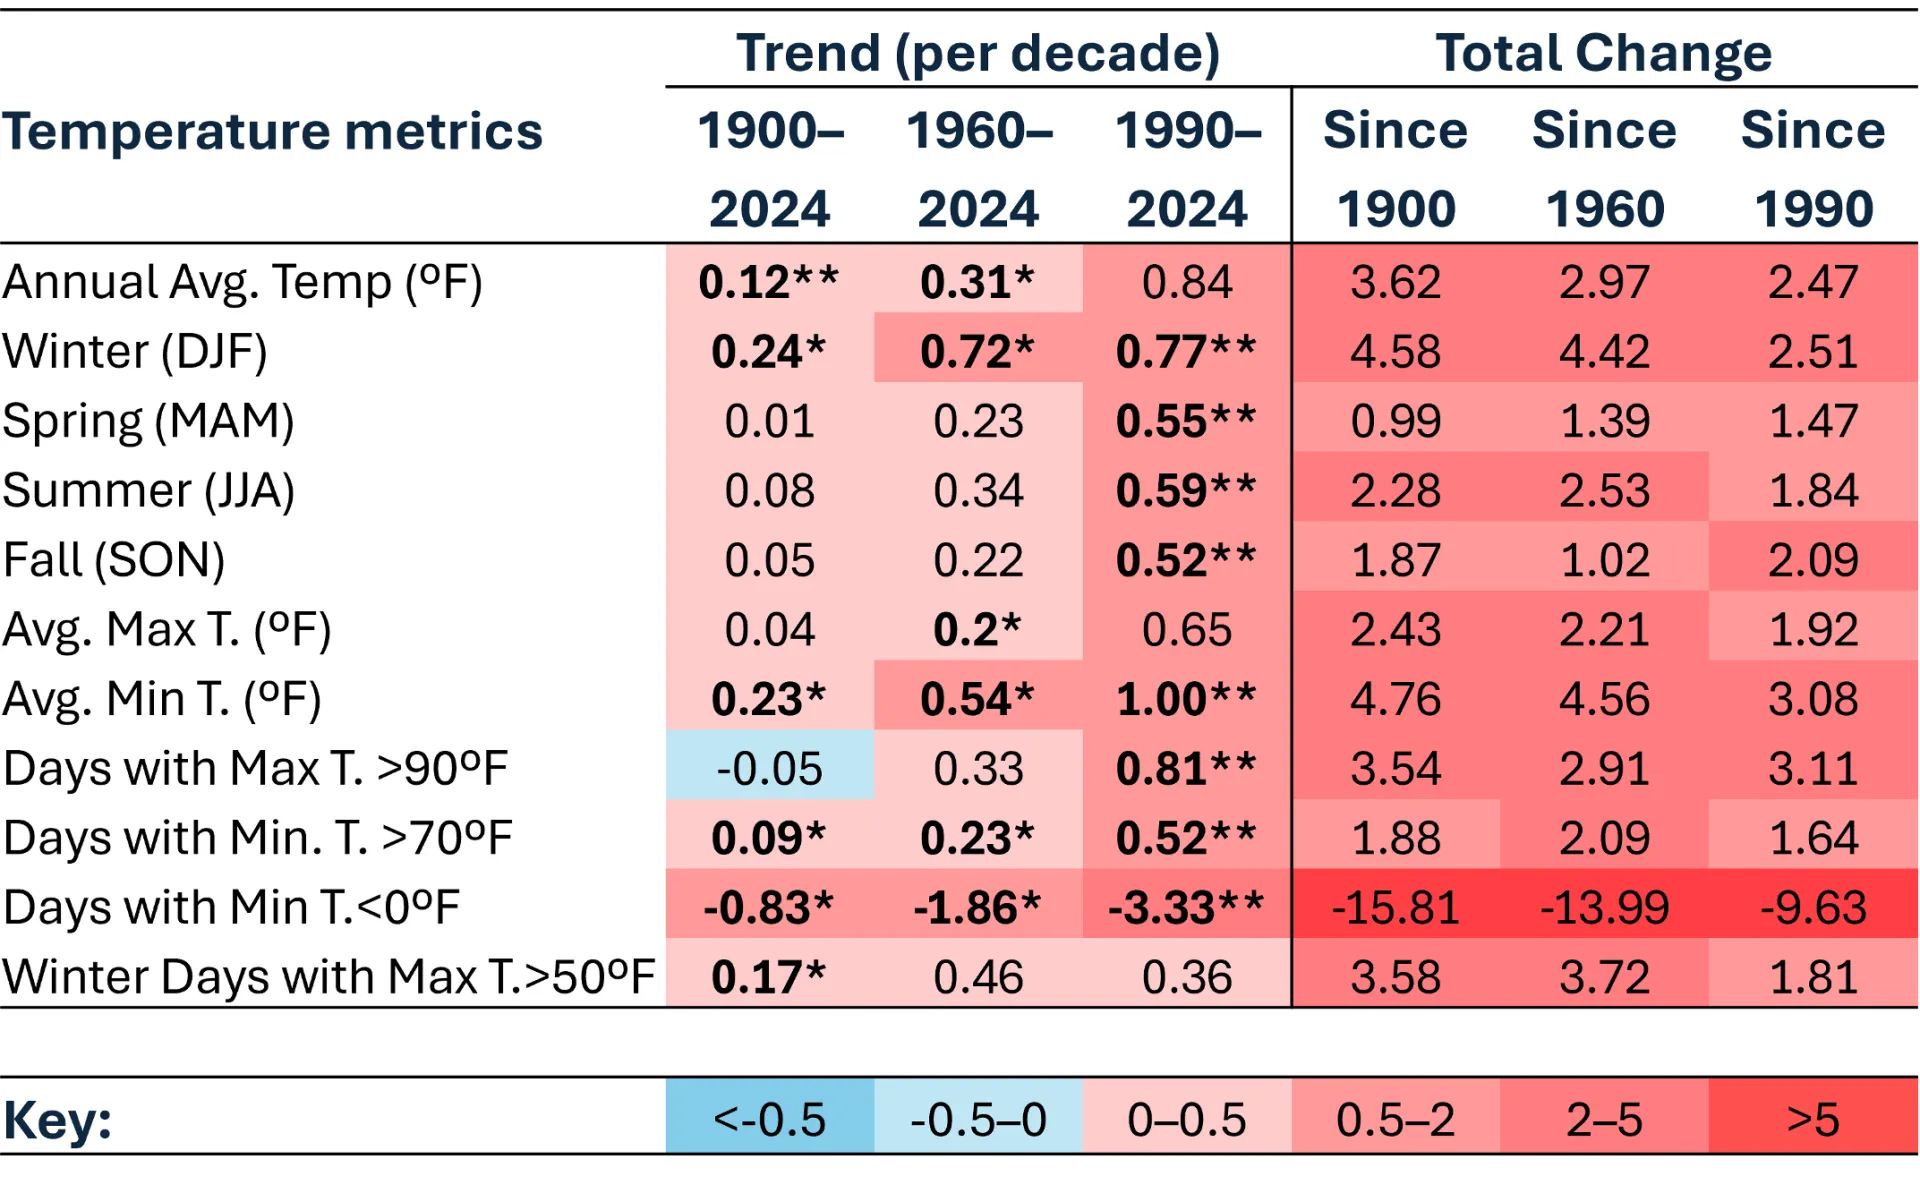
Source: NOAA Regional Climate Centers (2026)
Note: Temperature trends per decade were calculated using Sen’s slope on decadal averages since 1900, 1960, and 1990. Total change in temperature variables was calculated as the difference between the first decade of the target period (1900–1909, 1960–1969, and 1990–1999), and the most recent half-decade (2020–2024). *=statistically significant at 95% confidence interval; **=statistically significant at 90% confidence interval. Colors inverted for Days with Min T.<0 ºF (cold days) to show warming trend.
When comparing stations above and below 1,000 ft (Table 2-2), the average annual temperatures of high elevation stations have increased significantly faster than low elevation stations in the mid- and near-terms. No consistent data is available in Vermont for high elevation stations in the long-term; however, national data indicate that these trends are likely consistent since 1900 (Pepin et al., 2022). Since 1960, average annual temperatures across high elevation stations have increased almost twice as fast as low elevation stations, increasing 0.9ºF/decade (0.5ºC/decade) and 0.5ºF/decade (0.3ºC/decade), respectively. Since 1990, however, this gap increases as high elevations experienced rising temperatures of 2.1ºF/decade (1.2ºC/decade) compared to 0.8ºF/decade (0.4ºC/decade) in low elevations. These results are consistent with findings across the U.S. which indicate that higher elevation areas are experiencing inflated warming trends compared to their low elevation counterparts (Pepin, 2022). Such increases are expected to have consequential effects on seasonal norms across the state, but particularly in areas economically reliant on snow for winter recreation, like the Northeastern climate division which contains three of the five high elevation stations analyzed. See 2.10.2 for additional annual temperature analyses by climate division.
2.4.3 Winter temperature
Winter temperatures are increasing more rapidly than all other seasons at all observed time-periods, more than doubling the rate of change of summer temperatures in the long-term (Table 2-3). When averaging decadal temperatures across winter months (DJF), Vermont's winter temperature increased a total of 4.6ºF (2.6ºC) since 1900. Winter temperatures have increased at faster rates over time; temperatures increased 0.2ºF/decade (0.1ºC/decade) since 1900, 0.7ºF/decade (0.4ºC/decade) since 1960, and 0.8ºF/decade (0.4ºC/decade) since 1990. Furthermore, the average annual winter temperature was 21.9ºF (-5.6ºC) in the most recent half-decade (2020–2024), the highest on record since 1900 (Figure 2-7). These trends are consistent with warming winters across the Northeast U.S., driven largely by increasing minimum temperatures of 0.3ºF/decade (0.2ºC/decade) over the last 100 years (Burakowski et al., 2021). These trends are also consistent with seasonal changes nationally, though, stronger winter warming trends have been identified across higher elevation regions much like that of the Northeastern climate division (US NOAA, 2015; see 2.10.2).
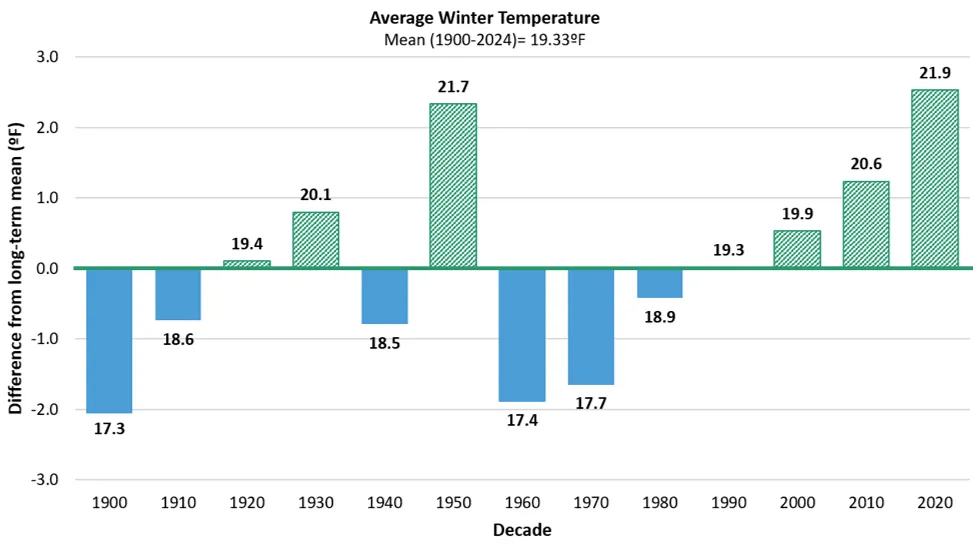
Source: NOAA Regional Climate Centers (2026)
Note: Long-term average winter temperature is indicated by the horizontal axis (y=0), equaling 21.4ºF (-5.9ºC). Decades above the long-term average green and striped, while decades below are blue and solid. Data labels above each bar indicate the decade’s average value, bar heights reflect precise underlying values; labels are rounded to one decimal place
Decreasing frequency of very cold days
Vermonters experienced over two weeks less of very cold days (i.e., days when minimum temperatures fall below 0ºF/-17.8ºC) annually since 1900 (Figure 2-8). While there were an average of 27.3 very cold days between 1900–1910, there were just 11.5 very cold days in the most recent half decade (2020–2024). This half decade (2020–2024) and the previous decade (2010–2020) are the only time periods since 1900 where there were less than 20 very cold days/year, driving the near-term trending decline of 3.6 very cold days/decade. When comparing the most recent 35-year period (1990–2024) to the first 30-year period of 1900 (1900–1929), we find a decline of 7.1 days/decade indicating that over half of the total change since 1900 is represented by the near-term. All decades since 1980 have experienced averages of annual cold day frequencies less than the long-term average of 21.4 days. Statewide decreases in very cold days are largely driven by changes in the Northeastern climate division, which has been experiencing more than three weeks less of annual very cold days since 1900 (see 2.10.3). The Southeastern (-13.1 days/year) and Western (-7.9 days/year) divisions are also experiencing less very cold days but to a lesser extent compared to the Northeastern (-21.4 days/year) division (See 2.10.3).
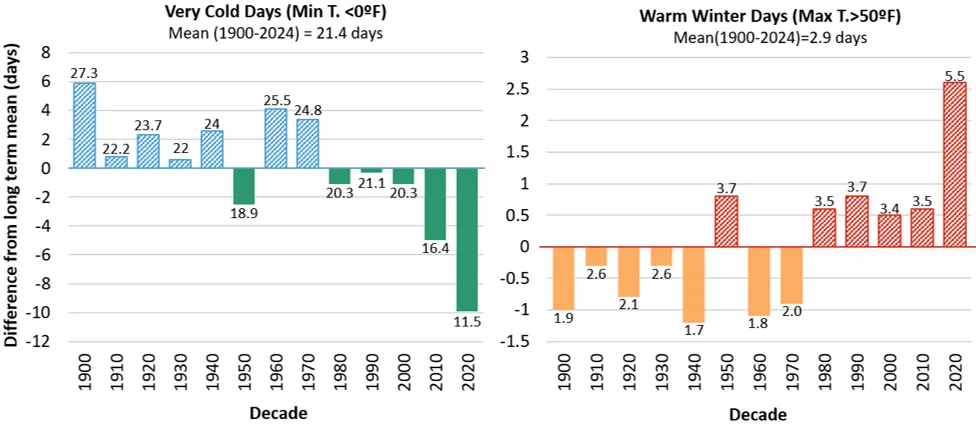
Source: NOAA Regional Climate Centers (2026)
Note: Long-term average is indicated by the horizontal axis (y=0). For warm winter days this axis represents an average of 2.9 days/year; for very cold days, this axis represents an average of 21.4 days/year. Decades above the long-term average are striped, while decades below are solid. Data labels above each bar indicate the decade’s average value, bar heights reflect precise underlying values; labels are rounded to one decimal place
Increasing frequency of warm winter days
The number of warm winter days (i.e., when the maximum temperature exceeds 50ºF/10ºC), has tripled since 1900 (Figure 2-8). The most recent half-decade averaged 5.5 warm winter days annually; a total long-term increase of 3.6 days (from 1.9 days in 1900) or an increase of 0.3 days/decade. All decades since 1980 have experienced averages of warm winter days that are higher than the long-term average of 2.94 days; the most recent half-decade (2020–2024) had the highest frequency of warm winter days on record since 1900. This indicates a continued increasing occurrence of warm winter days compared to historical norms. Trends in statewide increases in warm winter days are similar across the three climate divisions, with the Southeastern division experiencing an increase of 4.4 days/year since 1900, the Northeastern division experiencing an increase in 3.9 days/year since 1900 and the Western climate divisions experiencing an increase in 3.8 days/year since 1900 (see 2.10.3).
Variable changes to freeze-thaw cycles across the state
Increased variability and warming of winter temperatures alter freeze-thaw cycles across Vermont. Freeze-thaw cycles occur when daily minimum air temperatures are below the hard-freeze point of 28ºF (-2ºC) and maximum temperatures warm to above 32ºF (0ºC), water’s melting point (Schmidlin et al., 1987). Statewide, there are no significant changes in the number of freeze-thaw days, but patterns emerge for climate divisions (Figure 2-9; see 2.10.3). Freeze-thaw days increased by 3.1 days/decade since 1900 in the Western division, with acceleration during the last 35 years (+17.7 days/decade from 1990–2024). Conversely, freeze-thaw days decreased by 1.8 days/decade in the Southeastern division since 1900 and there were no significant trends in the Northeastern division.
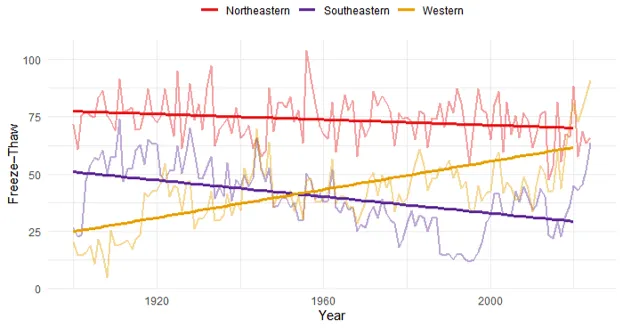
Source: NOAA Regional Climate Centers (2026)
Note: Annual frequency of freeze-thaw days defined when the daily temperature minimum is less than 28ºF (-2ºC), and the daily maximum is greater than 32ºF (0ºC)
Variability in freeze-thaw days across climate divisions could be explained by a variety of climatological factors. The simplest explanation of why there is a decrease in the Southeastern division, and an increase in the Western division comes from examining minimum and maximum temperature trends. Average annual winter temperatures in the Southeastern division increased from 17.8ºF (-7.8ºC) in the 1900s, to 23.2ºF (-4.9ºC) in the 2020s, with the last 35 years experiencing seasonal temperatures above the long-term average. The Southeastern division’s minimum annual temperatures increased significantly (0.8ºF/0.41ºC per decade since 1960). Paired with freeze-thaw data, this indicates that the division is experiencing fewer days that reach the minimum threshold for a freeze-thaw day. While warming is occurring in the Western division across all measures, declining freeze-thaw days there are indicative of more days with minimum temperatures above the freezing threshold, which increases the division’s freeze-thaw frequency. Increases in annual winter temperatures from 19.8ºF (-6.8ºC) in the 1900s to 23.0ºF (-5.0ºC) in the 2020s contribute to this trend. As temperatures continue to rise, the number of freeze-thaw days within this division is likely to taper and then decline as fewer minimum temperatures fall below a hard freeze. Similarly, there is an expectation that increasing freeze-thaw trends will begin to form in the Northeastern division as winter temperatures rise leading to more maximum daily temperatures warm above freezing, creating the conditions for a freeze-thaw event.
Winter temperature changes impact Vermonters
Winter temperature increases have substantial impacts on the daily lives of Vermonters. The loss of seasonal norms will negatively impact both ecosystems and communities, especially those within rural areas (Burakowski et al., 2021; Dupigny-Giroux et al., 2018; Thibeault & Seth, 2014). Increasing warm winter nights affect snowmaking and changes to freeze-thaw cycles inhibit snowpack growth; these combined changes will alter winter recreation activities like skiing, snowboarding, and snowmobiling (see Outdoor Recreation and Tourism 9.3.3). Changes to freeze-thaw cycles also damage infrastructure like roads, bridges, and buildings (see Infrastructure 7.3.4 and 7.4.2) and can negatively impact maple sap yield affecting maple sugar makers across the state (see Agriculture and Food Systems 6.4.6). Finally, when winter temperatures spike well above freezing temperatures, snowmelt occurs rapidly with correlative winter streamflow spikes and flooding risks (see Water Resources 4.4). Such risks are amplified by precipitation events that fall as rain rather than snow during these warm winter days. When this occurs, rain-on-snow events cause exponential snowmelt, placing strain on water managing ecosystems and infrastructure (Hale et al., 2025).
Reduced cold days may offer some benefits, as cold days have a variety of adverse effects on everyday life, especially the physical well-being of those without reliable shelter (see Human Health 10.3.2 and Community Development 11.3.1), the availability and structural integrity of water lines (see Infrastructure 7.5.2) and energy infrastructure (see Energy 8.4.1). A decline in the average number of days with temperatures below 0ºF (-17.8ºC) could mean less stress on such systems, and individuals annually, and may reduce the monetary investments required to prepare against such damage. However, other increasingly frequent seasonal extremes may counteract such benefits.
2.4.4 Summer temperature
Summers (averaged across June, July and August) were the second fastest warming season in Vermont (Table 2-3). Since 1900, Vermont summers have warmed by 2.3ºF (1.3ºC) with the state’s fastest increase in the near-term (+0.6ºF/decade; +0.3ºC/decade since 1990). Summer decadal averages since 1900 hover between 65ºF (18ºC) and 67ºF (19ºC; Figure 2-10). While lower than winter warming trends, analyses of extreme summer temperatures show greater changes. Seasonal extremes such as very hot days (i.e., when maximum temperatures exceed 90ºF/32ºC), and warm summer nights (i.e., when minimum temperatures are above 70ºF/2ºC) are increasing in frequency across all climate divisions with the effects of such extremes exacerbated by rising humidity. Changes in extreme summer conditions coincide with a lengthening freeze-free period (i.e., the number of consecutive days above 32ºF/0ºC) as temperatures remain above freezing for longer periods each year. The Southeastern climate division experienced the greatest summer warming since 1900 (+2.3ºF/+1.3ºC; see 2.10.4). Meanwhile, summer temperatures in the Northeastern division increased approximately half as much as in the Southeastern division in all calculated time periods, and even less than that in the Western division. See 2.10.4 for additional analyses by climate division.
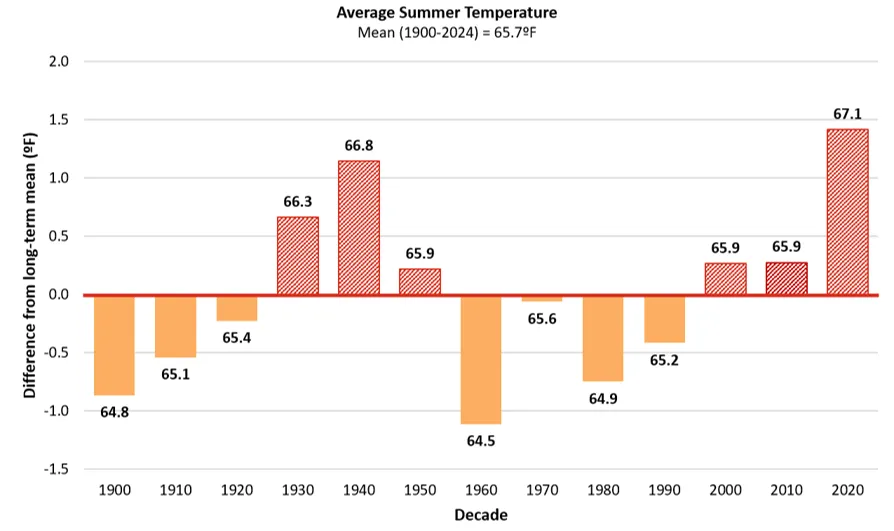
Source: NOAA Regional Climate Centers (2026)
Note: Long-term average summer temperature is indicated by the horizontal axis (y=0), equaling 67.5ºF (19.7ºC). Decades above the long-term average are red and striped, while decades below are orange and solid. Data labels above each bar indicate the decade’s average value, bar heights reflect precise underlying values; labels are rounded to one decimal place
Freeze-free period is lengthening
Vermont’s freeze-free period is lengthening, and this change is happening at an accelerating rate over time. The freeze-free period is the greatest number of consecutive days above 32ºF (0ºC) per year, which overlaps consistently with the summer and growing seasons. VCA 2021 (Galford et al., 2021) used a hard freeze threshold (28ºF/-2.2ºC) to calculate the freeze-free period; however, this chapter uses 32ºF (0ºC) as it is more commonly used in decision-making by NWS and practitioners (e.g., temperature at which sensitive plants or crops are covered). In the long-term, Vermont’s freeze-free period has averaged 128.4 days/year but the freeze-free period lengthened +2.3 days/decade since 1900, +3.3 days/decade since 1960, and +4.5 days since 1990 with a 20% (+23.7 days) total increase in freeze-free length since 1900 (Figure 2-11). Additionally, every decade since 1970 has had an average freeze-free period greater than the long-term average, with the last half decade (2020–2024) representing an average annual freeze-free period that was 3.4 weeks longer compared to 1900. All three climate divisions experienced an increase in the average annual length of the freeze-free period, with lengthening most extreme in the Southeastern division (+35.4 days since 1900), followed by the Western (+21.1 days since 1900) and Northeastern (+20.5 days since 1900) divisions (see 2.10.4).
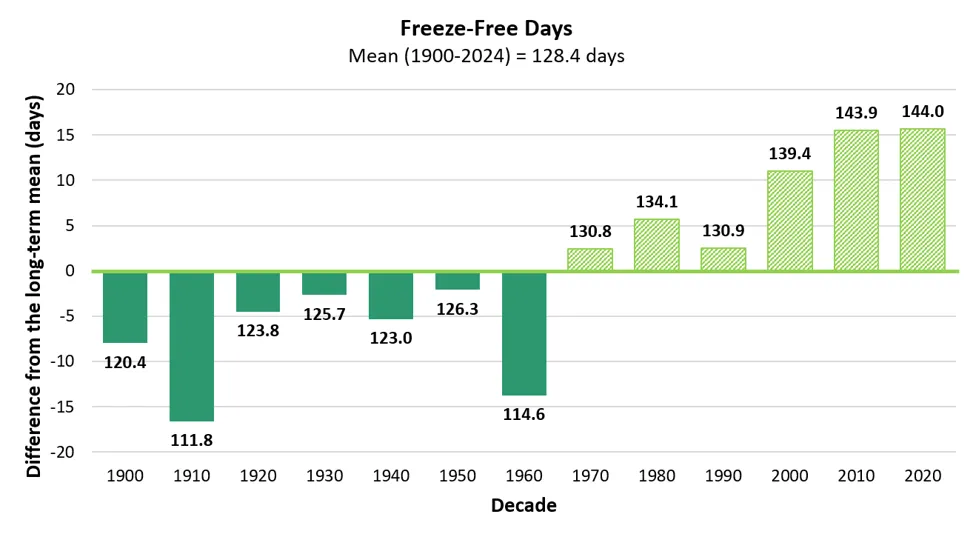
Source: NOAA Regional Climate Centers (2026)
Note: Long-term average freeze-free length is indicated by the horizontal axis (y=0), equaling 128.4 days. Decades above the long-term average are striped, while decades below are solid. Data labels above each bar indicate the decade’s average value, bar heights reflect precise underlying values; labels are rounded to one decimal place
Extremely hot days are more frequent
Extremely hot days (i.e., days over 90ºF/32ºC) are an important metric for tracking impacts of heat on vulnerable populations, agricultural production, water resources, and more. In the long-term, Vermonters experienced approximately 5.6 extremely hot days/year (Figure 2-12). While there is no significant trend in extremely hot days since 1900 (likely due to the addition of several weather stations at cooler, higher altitude locations in the 1930s and 50s), there are significant increases in extremely hot days in the mid- (+0.3 days/decade since 1960) and near-term (+0.8 days/decade since 1990). The total change in extremely hot days since 1900 is +3.5 days with the most recent half decade (2020–2024) averaging 7 extremely hot days per year. No climate division in any time period showed statistically significant trends in extremely hot day frequencies at a 95% confidence level; however, in the near-term, trends in the Southeastern and Western divisions were significant at 90% (p<0.1) with the Southeastern division experiencing 2.5 more days/decade (+10 total days) since 1990 and the Western division experiencing 0.6 more days/decade (+1.7 total days) since 1990 (see 2.10.4).
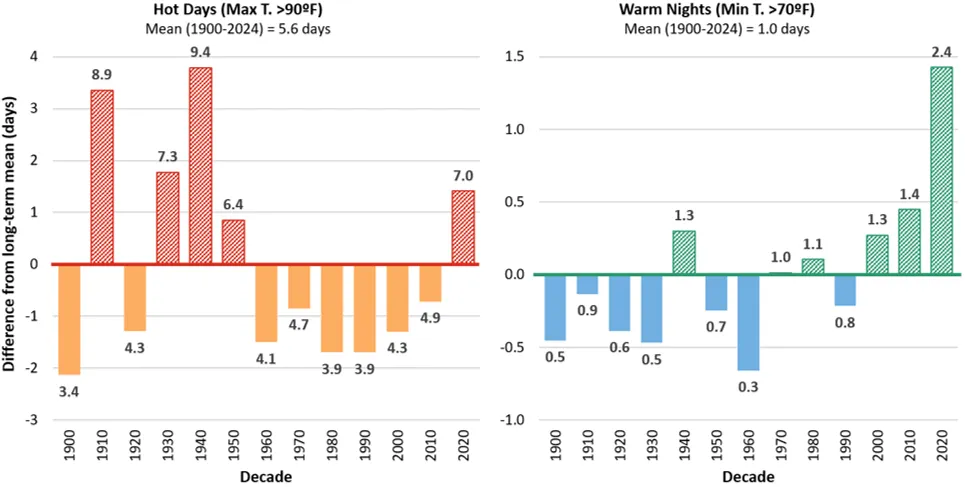
Source: NOAA Regional Climate Centers (2026)
Note: Long-term average is indicated by the horizontal axis (y=0). This axis represents an average of 5.6 days/year for extremely hot days and an average of 1.0 days/year for warm nights. Data labels above each bar indicate the decade’s average value, bar heights reflect precise underlying values; labels are rounded to one decimal place
Warm summer nights are more frequent
Days with warm nights (i.e., when minimum temperatures are at or above 70ºF/21ºC; US EPA, 2024) have risen significantly since 1900. Historically, Vermont averages one warm night per year (1900–2024). Warm nights have more than tripled in the long-term, with the greatest changes in the last several decades that were well above the long-term average (Figure 2-12). The long-term trend for warm nights significantly increased by 0.1 days/decade, then accelerated in the mid-term (0.2 days/decade since 1960), and near-term (0.5 days/decade since 1990). The most recent half-decade (2020–2024) averaged 2.4 warm nights/year, almost 2.5 times that of the long-term average. The Western division had the strongest, increasing trend with a significant increase of 0.2 warm nights/decade (+2.7 total) since 1900 (see 2.10.4). Furthermore, the most recent half-decade average (4.1 nights/year) is more than double the long-term average. In this period, Burlington’s NWS office also reported the first day maintaining a minimum average temperature of 80ºF (27ºC) since 1882 (Frechette, 2024). This trend is especially pertinent to community development, as Burlington, the most populous Vermont city, is within this division. These changes may seem minimal, but they represent substantial interruptions in daily cool cycles. Vermonters and their surrounding ecosystems are experiencing more nights without the natural, atmospheric reprieve from such heat, putting vulnerable human and wildlife communities at risk. See 2.10.4 for additional analyses by climate division.
Increasing humidity annually and seasonally
Humidity, or the amount of water vapor in the air, is important for understanding the severity of impacts from temperature trends or extremes. Relative humidity, or the percentage of water vapor in the air relative to the maximum amount the air can hold at a given temperature, has not increased significantly in Vermont over time (NOAA, 2015). This stability relative to temperature is consistent with a warming climate because warmer air can hold more moisture. Therefore, to evaluate changes in atmospheric moisture associated with changing climate patterns, measurements such as absolute humidity and dewpoint are often preferred because they better reflect the amount of moisture in the air (measured as grams of water per meter squared) at a given time (NOAA, 2015). Three locations (Burlington, Woodstock, and Montpelier) were selected for preliminary absolute humidity analysis with one in each climate division (see 2.3.2). The dataset used for this analysis only contains data from 1940 through the present; therefore, long-term trends are reduced.
Mid-term (1960–2024) measures of absolute humidity increased significantly annually and across all seasons except for spring, with summer and fall months experiencing steeper trending increases. Annual absolute humidity measures exceeded the long-term average (1940–2024) of 6.7 g/m³ every year for the last 2.5 decades, with the most recent half-decade (2020–2024) experiencing the highest average daily absolute humidity on record of 7 g/m³ (Figure 2-13). The annual average humidity increased significantly since 1960 (+1.16 g/m³/decade) and since 1990 (+1.28 g/m³/decade). The greatest increase in annual absolute humidity was recorded at the Burlington station (Western climate division; 1.2 g/m³/ decade since 1960, and 1.5 g/m³/decade since 1990; see 2.10.4).
Annual average minimum and maximum absolute humidities also increased, with significant trends occurring since 1960 (Figure 2-13). In the mid-term, average annual maximum absolute humidities increased 1.2 g/m³/decade, while minimum humidity increased by 0.9 g/m³/decade. An increase in all humidity measures indicates that not only will populations experience elevated humidity highs, but they will also experience less reprieves from humidity as minimums rise. This is concerning when considering other metrics, such as extremely hot days, warm nights, and average temperature increases in the fall and summer months.
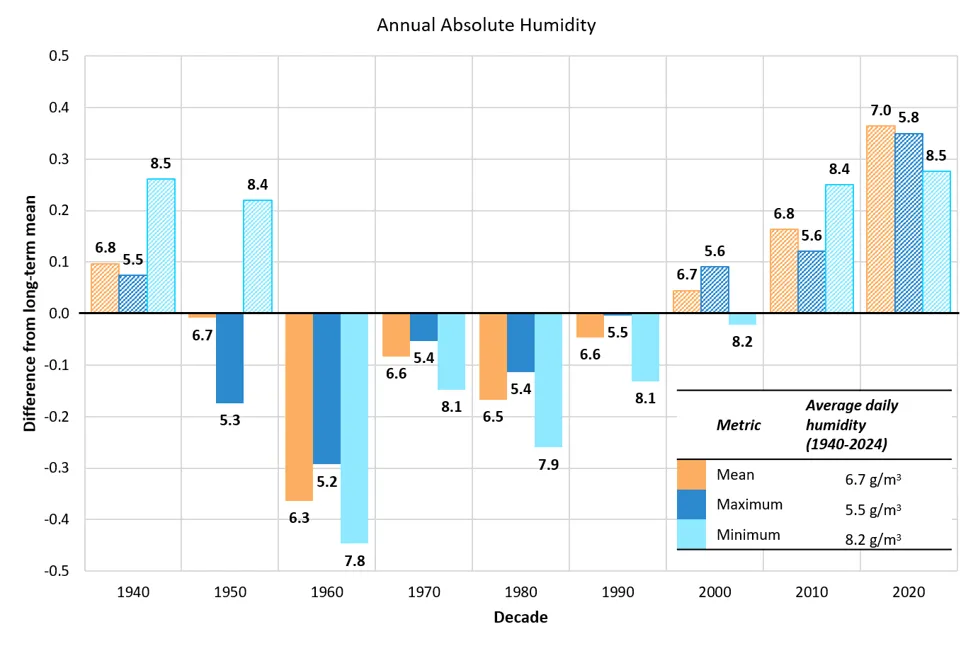
Source: Copernicus Climate Change Service (2026)
Note: Long-term average daily humidity is indicated by the horizontal axis (y axis=0). This equals 6.7g/m3 for daily mean absolute humidity, 5.5 g/m3 for daily maximum, and 8.2 g/m3 for daily minimum. Decades with averages higher than the long-term average rise above this line, and those with lower averages descend below it. ERA5 reanalysis data were obtained from the Copernicus Climate Change Service Climate Data Store (C3S, 2017), using the “single levels time series” product. Data labels above each bar indicate the decade’s average daily measure of each humidity metric, bar heights reflect precise underlying values; labels are rounded to one decimal place
When considering just the summer months (June, July, August), every metric of absolute humidity increased significantly since 1960 (average: 1.8g/m³/decade, maximum: 1.6g/m³/decade, and minimum: 1.6g/m³ respectively). Further, the last 2.5 decades have all surpassed the long-term average (11.9 g/m³; Figure 2-14). Among the three stations analyzed, the greatest increases in all summer absolute humidity metric were again recorded in Burlington (Western division), with significant increases in the average (2.2 g/m³/ decade), maximum (1.8 g/m³/decade), and minimum (1.4 g/m³/ decade) since 1960.
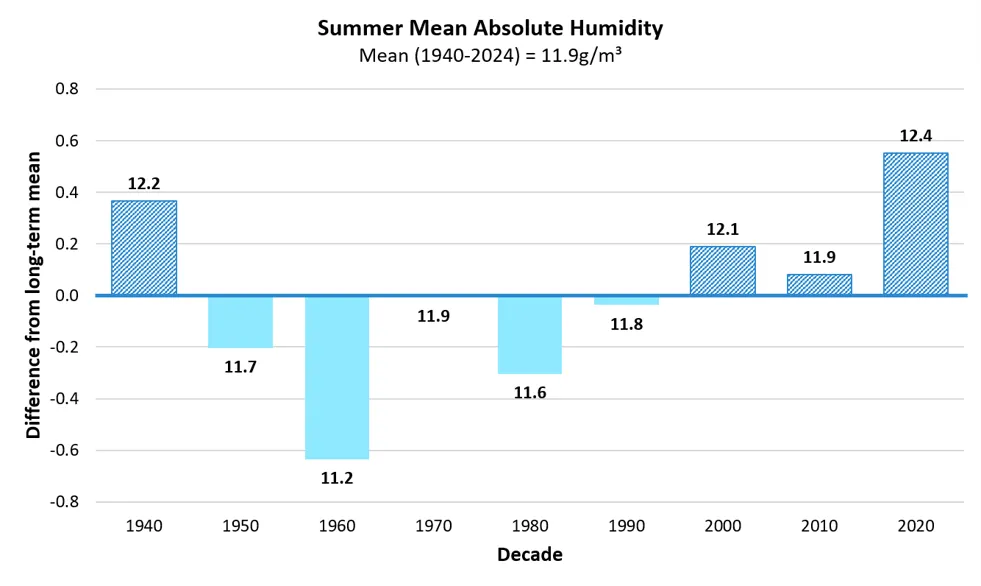
Source: Copernicus Climate Change Service (2026)
Note: Long-term average daily summer humidity is indicated by the horizontal axis (y axis=0), equaling 11.9g/m3 in the Northeast location, 11.7g/m3 in the Southeast, and 12.2g/m3 in the West. Data labels above each bar indicate the decade’s average daily measure of each location, bar heights reflect precise underlying values; labels are rounded to one decimal place. Summer absolute humidity calculated by summarizing hourly time-series data from 1940–2024 of dewpoints and air temperatures across June, July and August. Data collected across three locations with latitude and longitudinal coordinates representative of NWS station locations rounded to the nearest 0.25. ERA5 reanalysis data were obtained from the Copernicus Climate Change Service Climate Data Store (C3S, 2017), using the “single levels time series” product
As other humidity measures beyond absolute and relative humidity can describe relationships between air temperatures and water holding capacities, future research should analyze trends beyond these measures. For example, specific humidity measures grams of water vapor per kilogram (kg) of moist air and may be less influenced by expansion properties of warmer air temperatures.
Summer temperature changes impact Vermonters
Heat waves across the Northeast U.S. are expected to occur more often (see 2.4.1). Combined with observed increases in average and extreme summer temperatures and increases in humidity, summer months pose new and substantial challenges to the health and well-being of Vermonters. While increases in average summer temperatures are small, short periods of extreme heat (e.g., from extremely hot days) can quickly cause heat stress for vulnerable populations (see Human Health 10.3.1). Humid air further reduces the capacity of both humans and animals to regulate their internal temperatures, exacerbating heat stress risk. Hot days and warm nights intensify air conditioning use (see Energy 8.4.3) and the need for cooling shelters for many Vermonters without such amenities (see Human Health 10.3.3). Warmer air temperatures often increase surface water temperatures impacting aquatic ecosystems (see Fish and Wildlife 5.5.1 and 5.6 and Water Resources 4.5.3). Finally, as the freeze-free season lengthens, Vermonters will see benefits, such as potential increases in agricultural productivity (see Agriculture and Food Systems 6.3.1) and summer recreation activities like boating, swimming, and paddling (see Outdoor Recreation and Tourism 9.5.3), as well as drawbacks, such as declines in the total winter recreation season (see Outdoor Recreation and Tourism 9.3.3) and winter pest survival including pathogen-causing ticks (see Human Health 10.6.1 and Fish and Wildlife 5.7.3). With trends highest in the Western climate division, effects are expected to be heightened in the heavily populated areas of Chittenden County.
2.4.5 Fall and spring temperature
While temperatures have increased in spring (March, April, and May) and fall (September, October and November) the only significant trend was found in the Southeastern division’s spring temperatures. While few spring and fall trends were determined as statistically significant in this report, they are approaching significance over time, therefore indicating declining variability in recent years. If this consistency in rising spring and fall temperatures continues, future research will be able to more conclusively determine the average annual warming of these shoulder seasons. See 2.10.5 for additional analyses by climate division.
2.5 Precipitation
2.5.1 Regional precipitation
The Northeast U.S. is experiencing wetter conditions across all seasons (Whitehead et al., 2023; Figure 2-15). In the long-term (1900–2024), average annual precipitation increased nearly 15 times faster in the Northeast U.S. (0.3 inches/decade; 7.6 mm/decade) compared to the CONUS (0.02 inches/decade; 0.5 mm/decade). The Northeast has also consistently seen decade averages above the long-term mean within the near-term (1990–2024), while the CONUS has seen greater variability. Overall, this region experienced 12.7 inches (326 mm) more precipitation annually in the long-term compared to CONUS overall (Figure 2-15).
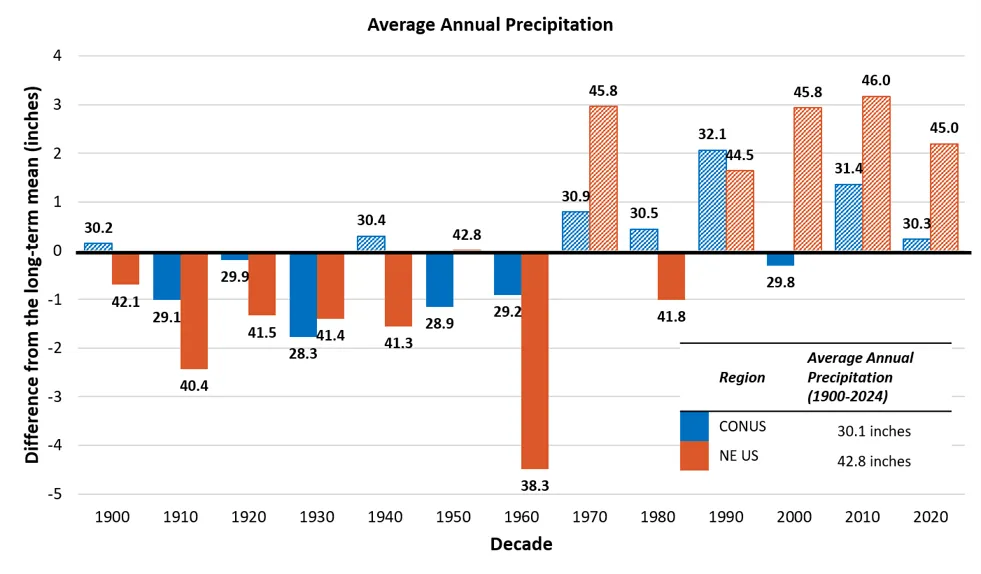
Source: NOAA NCEI, National and Regional Time Series (2026)
Note: Averages calculated using a 12-month timescale annually, then by decade using data consolidated in the Precipitation parameter with no filters and including all months, years 1900–2024. Long-term average is indicated by the horizontal axis (y=0), for CONUS this axis represents an average of 30.1 inches (76.5cm), while the axis represents an average of 42.8 inches (108.7cm). Data labels above each bar indicate the decade’s average value, bar heights reflect precise underlying values; labels are rounded to one decimal place
Annual precipitation is expected to continue increasing in the Northeast U.S. across all future warming scenarios (2.7–7.2ºF; 1.5–4.0ºC; Figure 2-16; see 2.10.1). The most likely warming scenario (3.6ºF/2.0ºC) estimates 0–10% increases in precipitation for the region, while the most extreme scenario (7.2ºF/4ºC) could result in 10–20% increases by 2100 (Chen et al., 2020).
Snow cover in the Northeast U.S., calculated as the number of days with snow on the ground observed by satellite imagery, has decreased in all states (no data available for New York) between the 2000s and the 2020s (Young & Young, 2025). Within the last half decade (2020–2024), Vermont, New Hampshire, and Maine averaged just over 119 days of annual snow cover, representing a 15% decline since 2000 (Young & Young, 2025). Although annual precipitation has increased, the freezing temperatures necessary for snow production and retention are becoming less frequent, thereby resulting in less snow cover. With projected warming winter temperatures across the region, snow cover is expected to continue to decline as less winter precipitation falls as snow and increasing freeze-thaw cycles reduce annual snowpack accumulation and snow cover retention.
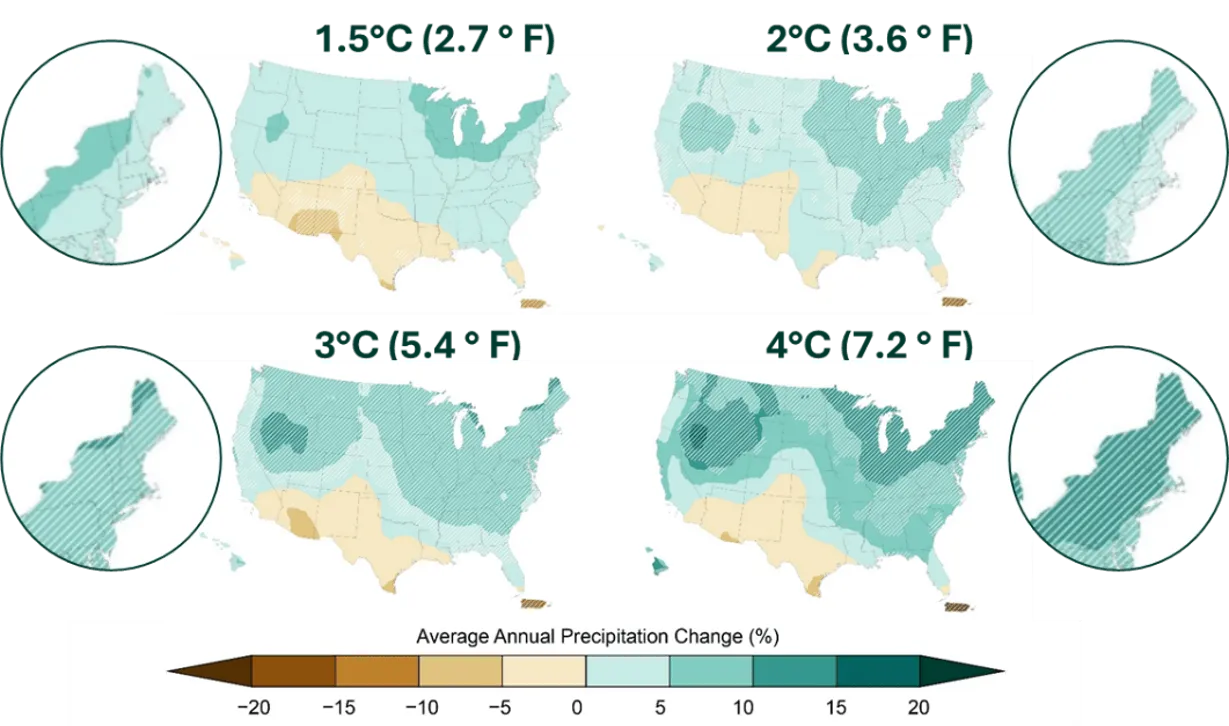
Source: Cornell University (2023)
2.5.2 Annual precipitation
Vermont has gotten wetter in the long-term but with increased variability in precipitation in recent decades (Table 2-4). Average annual precipitation has increased 7.3 inches (185.4 mm) since 1900 (0.8 inches/decade; 20.3 mm/decade) from 35.8 inches/year (909 mm/year) to 43.1 inches/year (1,095 mm/year). Furthermore, when comparing the first 30-year period (1900–1929) to the most recent 35-year period (1990–2024), total annual precipitation has increased by 24%. There are no significant trends in the mid- and near-terms, though decadal averages of annual precipitation since 1970 have all been greater than the long-term average of 40.3 inches (1,024 mm; Figure 2-17). The Western (+10.3 inches; +262 mm since 1900), Northeastern (+8.3 inches; +211 mm since 1900), and Southeastern (+6.7 inches; +170 mm since 1900) climate divisions had significantly increasing trends in annual precipitation in the long-term (see 2.10.6). The Northeastern division experienced the strongest increasing trend in both annual precipitation and heavy precipitation days in the long-term (Table 2-11). Annual precipitation significantly increased in this division by 1.2 inches/decade (30.5 mm/decade) since 1900, for a total change of 23% (8.3 inches; 210.8 mm), while heavy precipitation days also significantly increased by 0.37 days/decade since 1900, for a total change of 61% (3.3 days).
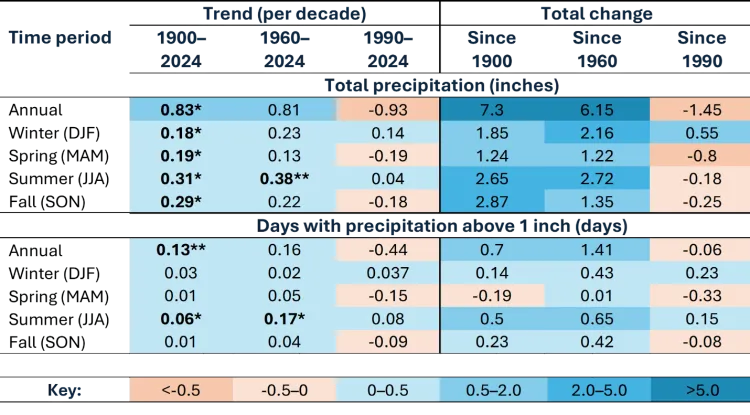
Source: NOAA Regional Climate Centers (2026)
Note: Total precipitation in inches and days with heavy precipitation (defined as >1 inch or 25.4 mm in 24 hours) are provided numerically. *=statistically significant at 95% confidence interval; **=statistically significant at 90% confidence interval
The most recent half-decade illustrates increasing precipitation variability, with dramatic swings between annual precipitation totals. Individual years ranged from the notably dry 2020 (34.5 inches; 876 mm) and 2021 (39.0 inches; 991 mm) to the exceptionally wet 2023 (52.1 inches; 1,323 mm), the second wettest year on record. Just one year later, Vermont received 46.3 inches (1,176 mm) in 2024, still well above the long-term average of 40.3 inches (1,024 mm) calculated for the 1900–2024 period. Then from July through October 2025, the state received well-below-average precipitation, putting 2025 on track to be another notably dry year. The contrast between record wetness in 2023 and the statewide 2025 drought, occurring within just two years, exemplifies the new reality of rapid transitions between extremes that climate models have projected and that Vermonters are now witnessing firsthand. Although year-to-year fluctuations remain a normal part of Vermont's climate, the long-term upward trend in precipitation is unlikely to be explained by natural variability alone and is consistent with broader regional evidence of human-driven climate change (U.S. Global Change Research Program, 2023). The Southeastern division is the only division with both significantly increasing and decreasing trends in annual precipitation, reflecting what might be more common statewide: overall wetter conditions punctuated with precipitation extremes of heavy precipitation events and dry spells that create large variability year-to-year (see 2.5.1). Recent variability in both decadal precipitation trends and annual averages point to an increased frequency, severity and extent of precipitation variability across the state, sometimes resulting in drought.
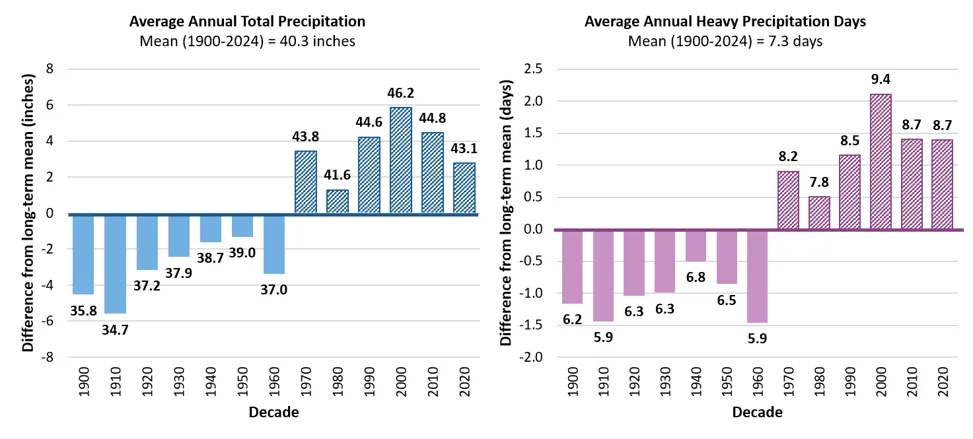
Source: NOAA Regional Climate Centers (2026)
Note: Long-term averages are indicated by the horizontal axis (y=0), which equals 40.3 inches/year (102.4cm) of total annual precipitation and 7.3 days/year of annual heavy precipitation. Decades above the long-term average are striped, while decades below are solid. Data labels above each bar indicate the decade’s average value, bar heights reflect precise underlying values; labels are rounded to one decimal place
Heavy precipitation days
While there are no significant trends in the annual number of heavy precipitation days (i.e., days with >1 inch; 25.4 mm of precipitation in 24 hours) statewide, decadal averages have been higher than the long-term average since 1970, indicating Vermonters have experienced more heavy precipitation days in the last 55 years (Table 2-4; Figure 2-17). Since 1970, the average annual number of heavy precipitation days has been 8.6 days/year, which is 17% higher than the long-term average of 7.3 days/year (1900–2024). This difference rises to 40% when comparing the most recent half-decade (2020–2024; 8.7 days/year) to 1900–1910 (6.2 days/year). Heavy precipitation days have been significantly increasing in the Northeastern climate division since 1930 (0.4 days/decade; 3.3 more days total; 61% increase; see 2.10.6). The current lack of significant annual trends in heavy precipitation days may be due to high year-to-year variability; however, in coming years, these trends may emerge as projected in regional and national models (Cornell University, 2023; Marvel et al., 2023; see 2.6.1). Summer heavy precipitation days have been significantly increasing in the long- and mid-terms, which aligns with Vermonters’ experiences of recent, catastrophic flooding in the summers of 2023 and 2024 (Table 2-4; see 2.5.4).
2.5.3 Winter precipitation
Vermont winters are shifting to more total precipitation, but less snowfall. Winter precipitation can take many forms (e.g., rain, snow, sleet) and is measured here as the total inches of liquid equivalent of snowfall and all other forms of precipitation. Snowfall, when measured separately from total winter precipitation, is measured in inches of snow depth. Changes in precipitation amount and type, especially in winter, reshape how water moves through Vermont's landscapes, and can have varied impacts on dependent social and ecological systems (see Water Resources 4.5, Fish and Wildlife 5.5.1, and Outdoor Recreation and Tourism 9.3.3). The year 1930 was selected as the baseline decade for winter precipitation analyses due to data availability (particularly high elevation stations; see 2.3.2).
While there are no significant trends statewide or by climate division in total winter precipitation, decadal averages have been higher for total winter precipitation since 1970 compared to the long-term average (Table 2-5; Figure 2-18). Between 1930–2024, total precipitation increased by 0.21 inches/decade (5.3 mm/decade), which was consistent through the mid-term (0.23 inches/decade; 5.8 mm/decade), before slowing to 0.14 inches/decade (3.6 mm) in the near-term (Table 2-5). There has been an almost 20% (1.45 inches; 37 mm) total increase since 1930. The Western climate division experienced a 38% (2.6 inches; 66 mm) increase in total precipitation since 1930, the Northeastern division experienced a 15% (1.1 inches; 28 mm) increase since 1930, and the Southeastern division experienced a 12% (1.1 inches; 28 mm) increase since 1930 (see 2.10.7 for additional analysis by climate division).
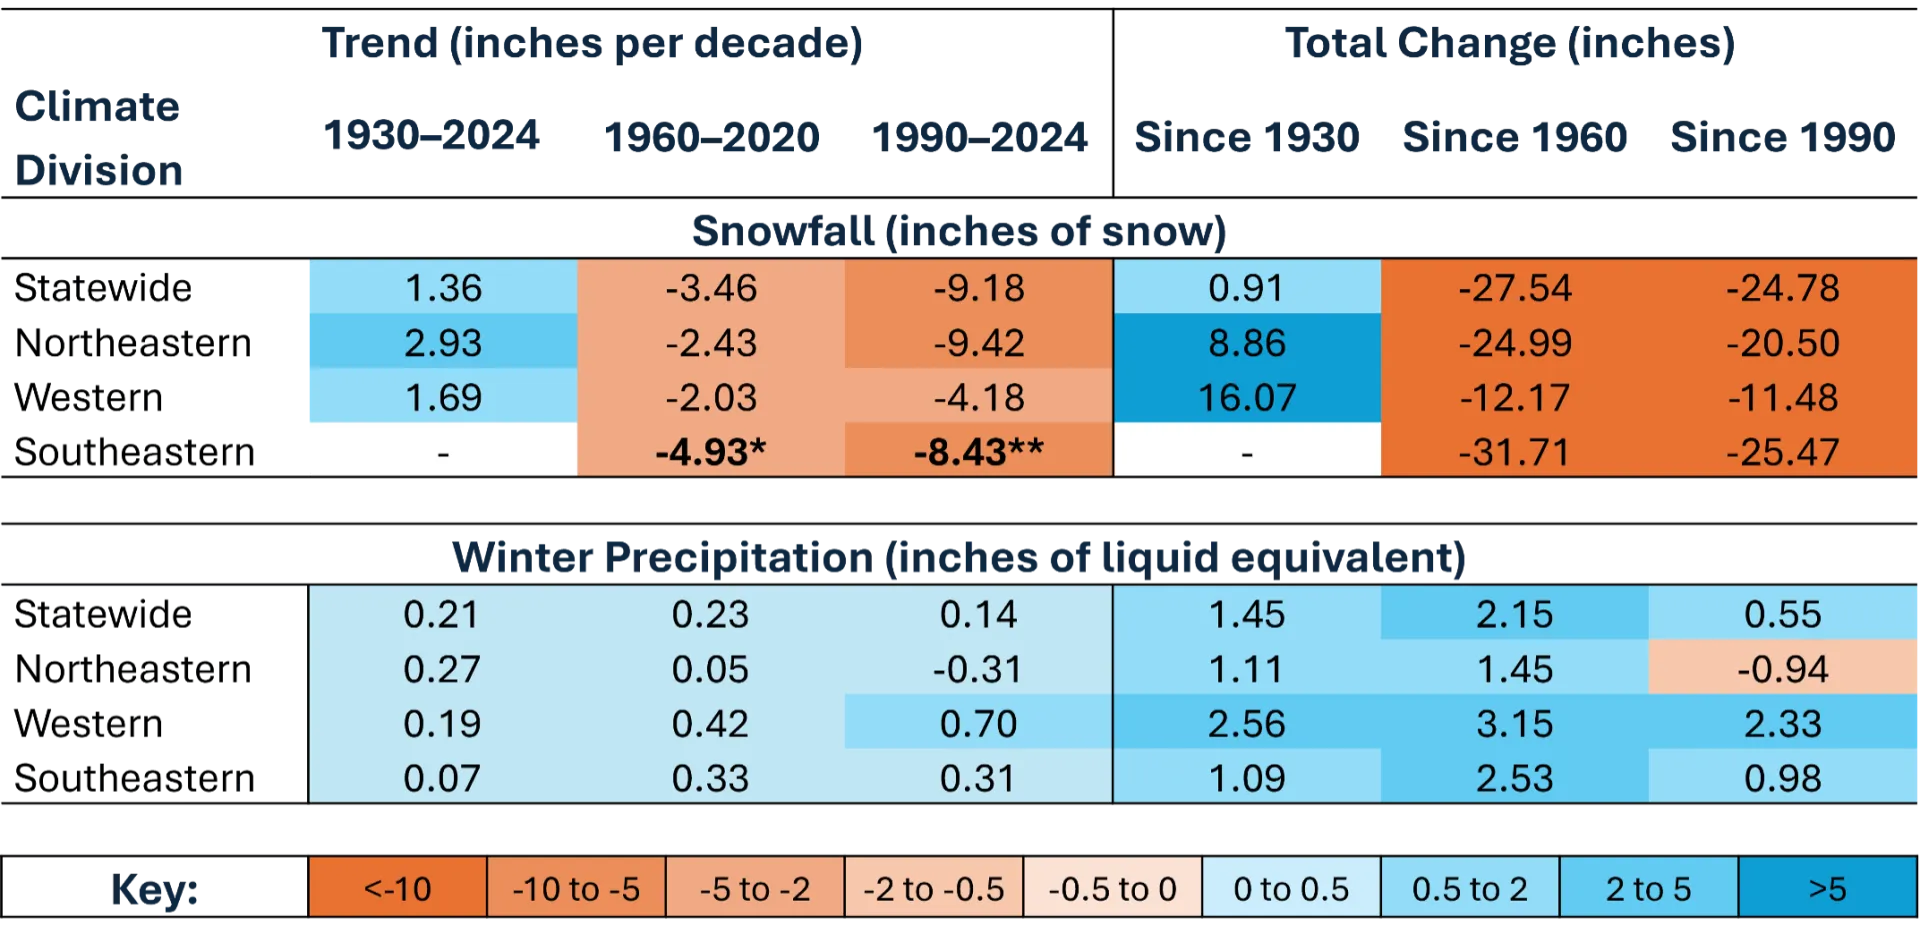
Source: NOAA Regional Climate Centers (2026)
Note: Winter precipitation is the total annual precipitation across the 3 winter months (December, January and February) in liquid equivalents; therefore, it is the summation of snowfall and any other precipitation that fell. *=statistically significant at 95% confidence interval; **=statistically significant at 90% confidence interval
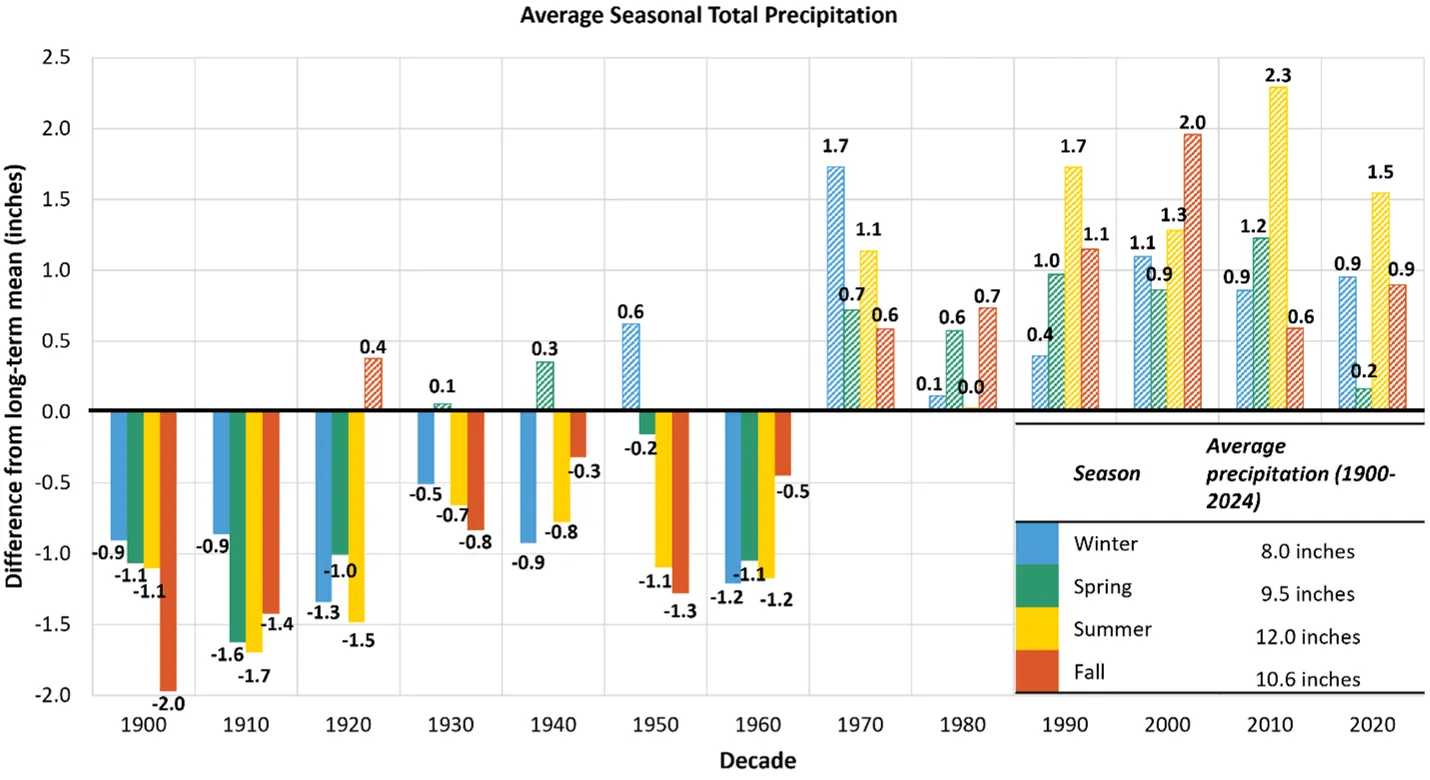
Source: NOAA Regional Climate Centers (2026)
Note: Long-term averages are indicated by the horizontal axis (y=0), equaling 8.0 inches (203 mm) for winter, 9.5 inches (241 mm) for spring, 12 inches (305 mm) for summer, and 10.6 inches (269 mm) for fall of total seasonal precipitation. Decades above the long-term average are striped, while decades below are solid. Data labels above each bar indicate the decade’s average value, bar heights reflect precise underlying values; labels are rounded to one decimal place
Snowfall
Vermont's snowfall trends reveal a complex story that reflects the state's warming climate and an ongoing shift from snow to rain during winter months. Despite increases in total precipitation, snowfall has declined in the most recent half decade. Since 2020, snowfall averaged 68.8 inches/year (1,748 mm/year), which is almost 28 inches (711 mm) lower than the average from 1960–1969 and almost 25 inches (635 mm) lower than the average from 1990–1999 (Figure 2-19). Snowfall was similarly low in the 1930s (67.9 inches/year; 1,725 mm/year) and 1940s (77.2 inches/year; 1,961 mm/year) before rising from 1960 through 2010 (average during this period was 94.3 inches; 2,395 mm), which may explain why there is no significant trend in the long-term. Recent declines in snowfall are not due to declines in winter precipitation overall (Figure 2-18) but instead are due to precipitation events occurring during winter days with above freezing temperatures. NOAA's Vermont State Climate Summary (Vose et al., 2022) projects that winter and spring precipitation will continue to increase throughout the next century. A growing proportion of winter storms produce rain rather than snow, fundamentally altering the form in which winter precipitation reaches the ground and changing the state's winter hydrology and snowpack dynamics (see Water Resources 4.2.2 and 4.4.1).
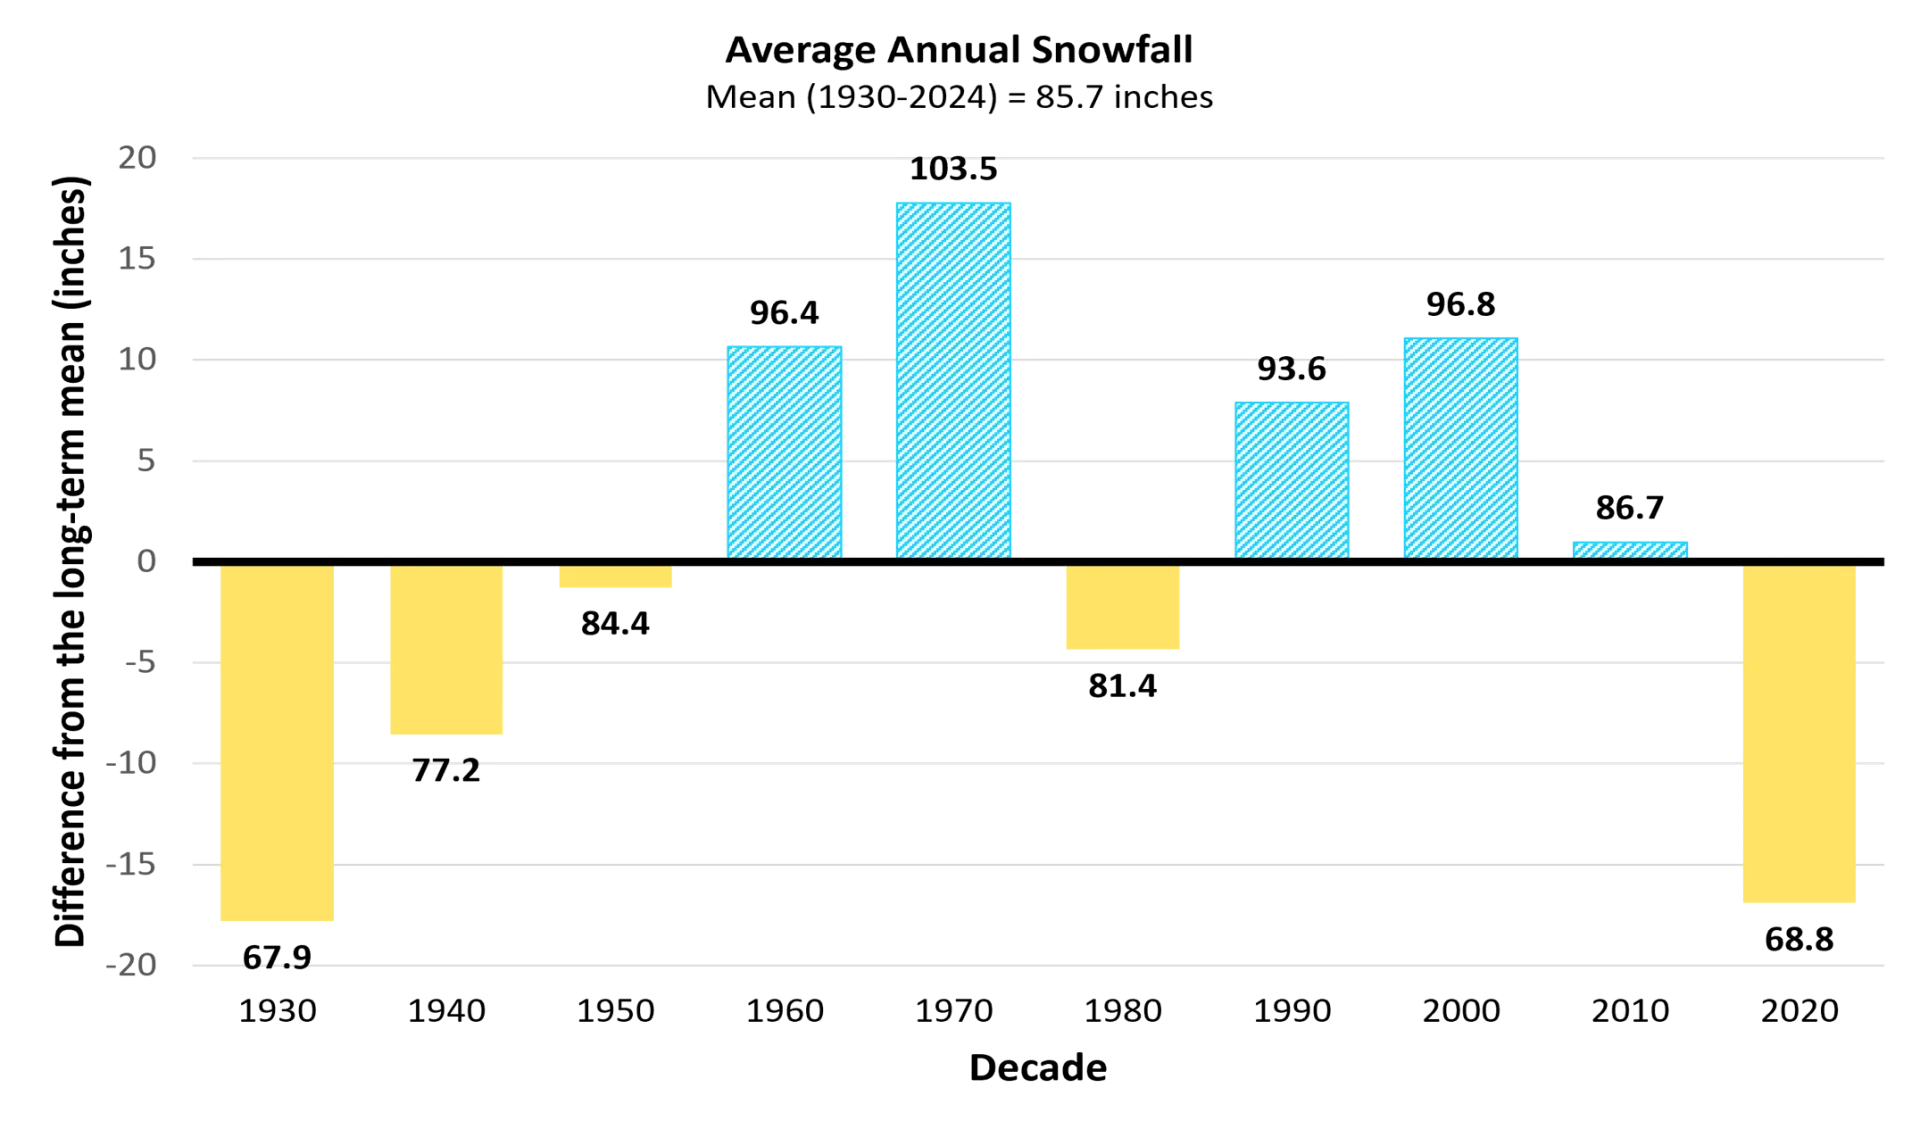
Source: NOAA Regional Climate Centers (2026)
Note: Long-term averages are indicated by the horizontal axis (y=0), equaling 85.7 inches (2,177 mm). Decades above the long-term average are striped, while decades below are solid. Data labels above each bar indicate the decade’s average value, bar heights reflect precise underlying values; labels are rounded to one decimal place
When comparing the ratio of snowfall to total winter precipitation, the data further show a change in the mix of winter precipitation, favoring rain over snow. For every one inch (25.4 mm) of rain that fell within the winter months in the last half-decade (2020–2024), roughly eight inches (203 mm) of liquid equivalent snow fell (Figure 2-20). This ratio is almost three inches (76.2 mm) less than the long-term average (1930–2024, 10.4 inches/inch; 264 mm/mm), half that of the state’s peak snow-producing decade (1960–1969, 14.2 inches/inch; 361 mm/mm), and substantially less than the historical norm in Vermont of 12:1-13:1 (Doesken & Judson, 1996). The declining trend in the snow-to-winter precipitation ratio reflects two concurrent changes: a transition from snow to more rain during winter months, and a decrease in the Snow-to-Liquid Ratio (SLR) of snowfall events (resulting in heavier, wetter snow). Due to the limitations of historical daily observational data, it is not mathematically possible to determine the exact contribution of each factor.
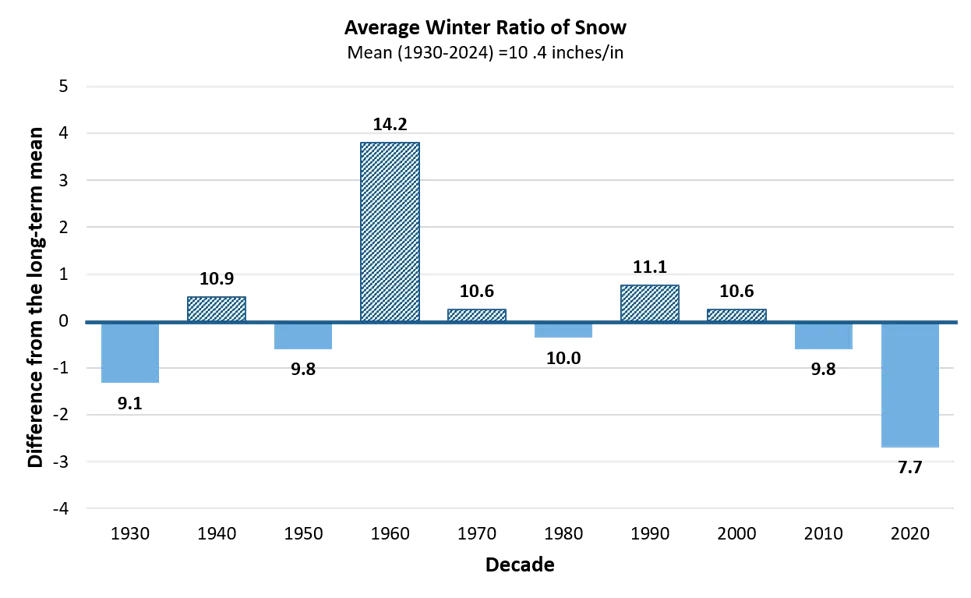
Source: NOAA Regional Climate Centers (2026)
Note: Each bar represents the average ratio within each decade displayed as it diverts away from the long-term average ratio (1930–2024), represented by the primary x axis (0) and equal to 10.4 inches/in. Decadal ratios above the long-term average are striped, and those below are solid. Each ratio represents how many inches of snow fell compared to every 1 inch of all liquid equivalent precipitation during winter months (DJF). The last bar represents a half-decade average (2020–2024). Data labels above each bar indicate the decade’s average value, bar heights reflect precise underlying values; labels are rounded to one decimal place
The Southeastern division had the only significantly decreasing trend in snowfall of the three divisions; this is likely due to its lower elevations and stronger influence from moisture from the Atlantic Ocean (see 2.10.7). Since 1960, the Southeastern division has experienced a 35% decline in snowfall, equal to a total loss of 31.7 inches (805 mm) or -5.0 inches/decade (-127 mm/decade). When comparing the high to low elevation stations, high elevation stations experienced 30.7 inches (780 mm) less snowfall in the most recent half-decade (2020–2024) compared to the 1960s, while the low elevation stations experienced 25.0 inches (635 mm) less snowfall when comparing those same time periods. Despite these declining trends, Vermont's annual snowfall remains highly variable from year to year. Individual winters can still produce heavy snowfall totals well above the long-term average. Looking forward, as Vermont's climate continues to warm by an expected 5.0–9.0°F (2.7–5.0ºC) by 2100, the long-term trajectory points toward less snow, more winter rain, and a continued decline in average annual snowfall and snowpack across the state (Vose et al., 2022) consistent with national and Northeast U.S. trends (see 2.5.1).
2.5.4 Summer precipitation
Total summer (June, July, August) precipitation and heavy precipitation days (i.e., days with >1 inch; 25 mm of precipitation) have both increased significantly since 1900 but remain highly variable in recent years (Table 2-4). Total summer precipitation now averages 13.7 inches/year (348 mm/year) in the near-term (1990–2024) compared to 12.0 inches/year (305 mm/year) in the long-term (1900–2024), while heavy precipitation days now average 3.1 days in the near-term compared to 2.5 days in the long-term. Further, all decadal averages for both total summer precipitation and heavy precipitation days have been above the long-term average since 1990 (Figure 2-17).
Over time, the rate of increase in total summer precipitation has slowed: summer precipitation increased 0.3 inches/decade (7.6 mm/decade) since 1900 and 0.4 inches/decade (10.2 mm/decade) since 1960 but increased almost negligibly since 1990 (+0.04 inches/decade; 1.02 mm/decade; Table 2-4). The slowing rate of change in summer precipitation in recent decades aligns with strong variability in annual precipitation between years (see 2.5.2). Summer 2024 received 21.1 inches (536 mm) of precipitation, and 4.4 days with heavy precipitation—almost double that of the long-term average (2.5 days). These intense pulses of precipitation contributed to serious flooding just one year after another “100-year” flooding event in July 2023 (see 2.6.2). By contrast, summer into the fall of 2025 (through October) was characterized by severe drought after months of abnormally low amounts of precipitation and high surface evaporation (see 2.6.3). These huge seasonal swings underscore the high degree of precipitation variability that have defined Vermont summers in the recent past, and are projected to continue, if not strengthen in the future.
All three climate divisions exhibit significant increasing trends in total summer precipitation since 1900, and the Northeastern and Western divisions exhibit significant increasing trends in summer heavy precipitation days since 1900 (see 2.10.8). The Southeastern division now has 4.4 more inches/year (+112 mm/year) of summer precipitation; the Western division has 2.7 more inches/year (+69 mm/year), and the Northeastern division has 1.7 more inches/year (+43 mm/year). The Western division has 1.1 more heavy precipitation days/year, while the Northeastern division has 0.05 more days/year. Total summer precipitation and heavy precipitation days continued to significantly increase in the Western and Southeastern climate divisions in the mid-term but not the near-term; trends in total summer precipitation and heavy precipitation days were insignificant in the mid- and near-term for the Northeastern climate division. These results illustrate the variability in precipitation trends over time.
2.5.5 Fall and spring precipitation
Fall and spring precipitation increased significantly statewide in the long-term, but annual and decadal variability created insignificant trends in the mid- and near-terms (Table 2-4). Statewide, spring precipitation increased by 1.2 inches (31 mm) since 1900, representing a trend of +0.2 inches/decade (5.1 mm/decade). Spring precipitation averaged 9.7 inches/year (246 mm/year) in the most recent half-decade (2020–2024) compared to 8.4 inches/year (213 mm/year) from 1900–1909. The Western division had the fastest, significant long-term total increase of 3.2 inches (81 mm) since 1900 or 0.27 inches/decade (6.9 mm/decade) followed by the Northeastern division, which increased 1.0 inches (25 mm) or 0.25 inches/decade (6.4 mm/decade; see 2.10.9). The Southeastern division had an insignificant trend for spring precipitation in the long-term and all three climate divisions had insignificant trends in the mid- and near-terms (except for the Western division which increased 0.22 inches/decade or 5.6 mm/decade in the mid-term).
Fall precipitation also reflects variable trends across time-steps, statewide and across divisions as indicated by the very few significant trends beyond the long-term (Table 2-4; see 2.10.9). Statewide, fall precipitation increased significantly 2.9 inches (74 mm) or 0.3 inches/decade (7.6 mm/decade) since 1900. Fall precipitation averaged 11.5 inches/year (292 mm/year) in the most recent half-decade (2020–2024) compared to 8.6 inches/year (218 mm/year) from 1900–1909. The Western division had the fastest, significant long-term total increase of 4.2 inches (107 mm) since 1900 or 0.34 inches/decade (8.6 mm/decade) followed by the Northeastern division, which increased 3.2 inches (81 mm) or 0.32 inches/decade (8.1 mm/decade). The Southeastern division had a marginal increase of 1.4 inches (36 mm) or 0.19 inches/decade (4.8 mm/decade). All three climate divisions had insignificant trends in the mid- and near-terms (except for the Western division which increased 0.37 inches/decade or 9.4 mm/decade in the mid-term).
Trends in heavy precipitation days in the spring and fall were generally insignificant both statewide and across divisions (Table 2-4; see 2.10.9). The only significant trend in spring heavy precipitation days was in the Western climate division, which increased a total of 1.0 day or 0.1 days/decade since 1900. The only significant trend in fall heavy precipitation days was in the Northeastern division, which increased by 1.1 days or 0.1 days/decade.
2.6 Extreme weather events
Extreme weather events are becoming increasingly common and have significant economic, environmental, and social costs; since 1980, NOAA identified 19 weather and climate disaster events with financial impacts of more than $1 billion to the state of Vermont, four of which have occurred within the most recent half-decade (2020–2024; NOAA NCEI, 2025; see Water Resources 4.4.1 and Community Development 11.5.1). Vermont is particularly vulnerable to extreme weather events due to a combination of factors. Historically, Vermont’s major disasters largely resulted from winter extremes such as the Great Blizzard in 1888 (Vermont Historical Society, 2025), and the ice storm in 1998 (Whittier, 2023). As annual and seasonal temperatures rose and precipitation became more variable, flooding and drought events took the spotlight. Looking forward, these dramatic swings are likely to continue (see 2.4.2 and 2.5.2) and cause compounding impacts due to additional related extremes from heatwaves, wind, and wildfires. For instance, extreme heat combined with gaps in precipitation lead to drought and longer freeze-free seasons, which, in combination, substantially amplify wildfire season length and intensity (Robinson, 2021). These extreme weather events have already caused significant economic, ecosystem, and human health impacts in Vermont, and will likely continue to do so.
2.6.1 Regional extreme weather events
The U.S. has experienced an increase in the frequency, severity, and area affected by extreme weather events. The U.S. Climate Extremes Index tracks land area experiencing extremes in: maximum temperature, minimum temperature, drought severity, extreme daily precipitation, landfalling tropical storms, and wind velocity. Extremes are counted when an observation reaches the 10th percentile (e.g., when temperature maximums are 90% above average). The mean percent area affected by extreme weather was 20% between 1910–2024; however, over time, extreme weather events are increasingly affecting larger portions of the US. Since 1910 there has been a total area increase of 16% annually, a change that is heavily weighted by the last 15 years, which saw decadal area averages of 34% (2010–2019) and 45% (2020–2024)—more than doubling the long-term average (Figure 2-21).
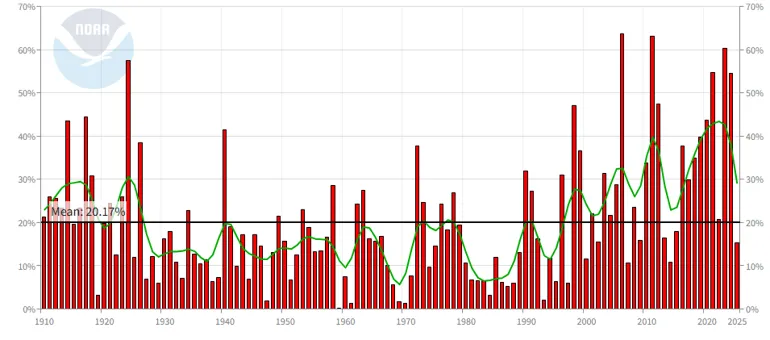
Source: NOAA NECI (2025)
Note: Extreme weather includes maximum temperature, minimum temperature, heavy daily precipitation, days with or without precipitation, and drought
The frequency of heavy precipitation days (i.e., >1 inch; 25 mm of precipitation in 24 hours), is on the rise in the Northeast U.S. Heavy precipitation trends are projected to continue under the expected 3.6°F (2.0°C) global warming scenario. For Vermont and the broader Northeast U.S., projections show increases in the total precipitation that occurs on heaviest 1% of precipitation days (20 to 40% change), the 5-year maximum daily precipitation (-5 to +15% change), and the annual maximum daily precipitation (5 to 15% change; Figure 2-22). While all metrics are projected to increase, the starkest change is projected to be heavier single-day precipitation events (Figure 2-22A), rather than more frequent precipitation overall. These sudden onset conditions may have diverse, extreme, and lasting impacts on various sectors across the division, including more destructive and costly flooding events (see Forests 3.6.1, Water Resources 4.4.1, Agriculture and Food Systems 6.5, Infrastructure 7.3.1, 7.4.1, and 7.5, and Community Development 11.5), increased runoff and water pollution (see Water Resources 4.3.1 and 4.5), wet soil impeding agricultural practices (see Agriculture and Food Systems 6.4.1), and increased snowmelt affecting winter recreation (see Outdoor Recreation and Tourism 9.3.3).
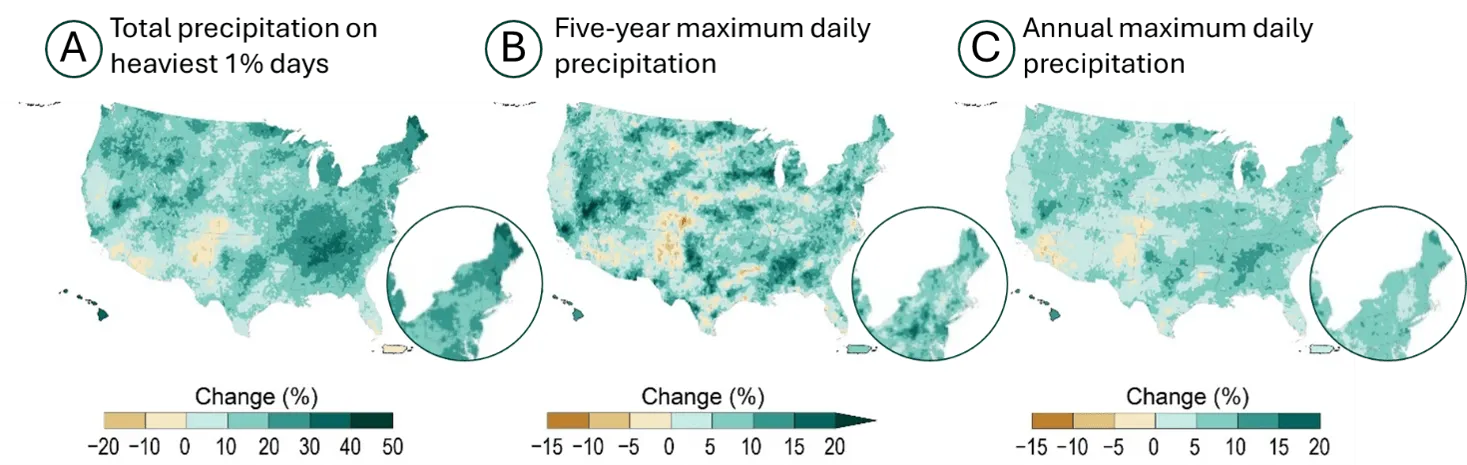
Source: Cornell University (2023)
Increasing temperatures, frequencies of extreme heat events, and variable precipitation rates, all increase the likelihood of drought occurrences (Pizzorni et al., 2024). The presence and strength of droughts are impacted by a variety of factors (e.g., low atmospheric humidity, vegetation health, topography), but are identified by prolonged periods with precipitation below expected levels (NOAA NESDIS, 2026). The U.S. Drought Monitor (USDM) uses five drought severity categories, from D0 (abnormally dry) to D4 (exceptional drought). Since 1900, the Northeast U.S. has seen a decline across all drought categories with more severe categories declining the fastest from 46% (D0) to 88% (D4).
However, flash droughts, which occur more suddenly than the USDM can often capture, are becoming more frequent in the Northeast (Christian et al., 2019; Otkin et al., 2024; Xue & Ullrich, 2022), likely due to increasingly variable precipitation extremes and above average evaporation rates (Christian et al., 2019; Xue & Ullrich, 2022). Frequency of flash droughts is increasing across all seasons, but those occurring toward the end of the growing season are more likely to develop into long-term drought events (Christian et al., 2019; Xue & Ullrich, 2022). The long-term drought in 2025 across the Northeast U.S. is an example of this, when almost the entire region experienced abnormally dry or drought conditions (D0–D3) across a 4-month period (NOAA NIDIS, 2025; see 2.5.2). Flash droughts are expected to be more frequent, increasing to once every 2.9 years rather than once every 6.3 years observed today (Xue & Ullrich, 2022).
Heat waves are when two or more consecutive days have air temperatures hotter than historical averages, with exacerbated effects in warmer seasons. These events are responsible for more U.S. deaths than all other weather-related disasters combined (NOAA, 2026a; see Human Health 10.3.1). When combined with high humidity, heat waves become progressively more dangerous (see 2.4.4). The heat index accounts for the combined effect of temperatures and relative humidities on human health with higher values indicting increased likelihoods of heat disorders or stress from prolonged exposure (NOAA, 2026b; see Human Health 10.3.1). Heat waves are expected to increase in frequency in the Northeast U.S. across all warming scenarios. In the near-future (2050s), heat waves occurring during nighttime hours are expected to increase the most (4.4% annually) for the middle of the road emissions projection (SSP2-4.5), and 4.2% annually for the high emissions projection (SSP5-8.5; Bhattarai et al., 2025; Figure 2-23; see 2.10.1). When drought and heat waves occur concurrently, they can create a reinforcing feedback loop due to decreases in soil moisture.
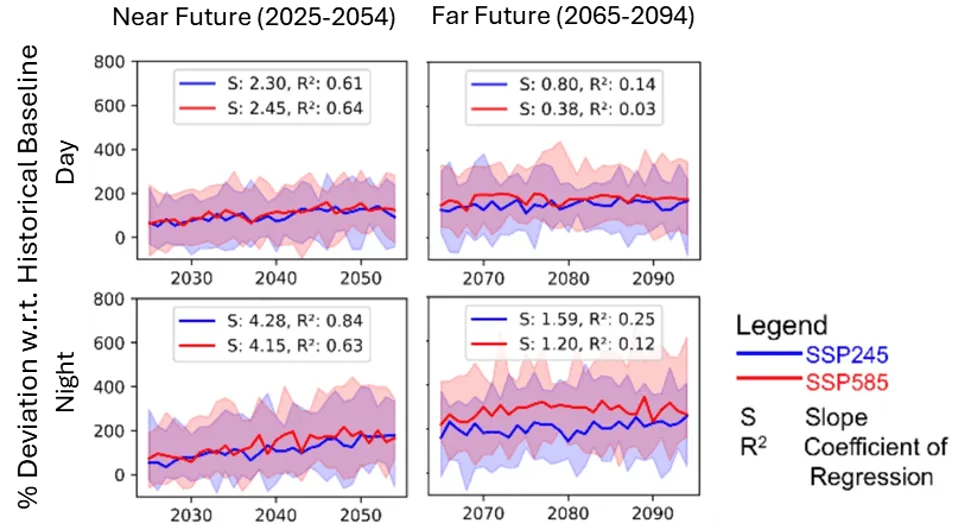
Source: Bhattarai et al. (2025)
2.6.2 Flooding
Vermont has experienced multiple flooding events in recent years that have exceeded flood magnitudes historically expected to occur only once every 100 or 250 years. Over 80 years spanned between the Great Vermont Flood of 1927 (Vermont Historical Society, 2025) and Tropical Storm Irene in 2011 (NWS, 2025). However, the widespread flash flooding event of 2023, just 12 years after Irene, was quickly followed by similarly catastrophic flooding in 2024. Despite such a low historic probability, these types of floods appear to be increasing in Vermont, which is consistent with regional and national trends (Cornell University, 2023; Marvel et al., 2023).
Precipitation during extreme storm events has increased by 70% in the Northeast U.S. since 1958; indicating that a greater share of annual precipitation is falling quickly and intensely in conjunction with extreme weather (EPA, 2016). In Vermont, there’s currently no significant trend in increasing heavy precipitation days (>1 inch; 25 mm in 24 hours) in the long-, mid-, or near-terms (2.5.2). However, the number of heavy precipitation days has been above the long-term average every decade since 1970 indicating more precipitation has been falling on singular days more often now than in most of the 1900s (Figure 2-17). An evaluation of heavier precipitation days (e.g., >2 inches; 51 mm or >4 inches; 102 mm of precipitation in 24 hours) may show significant trends and should be conducted in future assessments. Heavy precipitation days have the potential to overwhelm natural and constructed infrastructure used to regulate the flow and collection of water causing flooding (see Water Resources 4.4.3 and Infrastructure 7.6). As a mountainous state, many developed regions in Vermont are already more susceptible to rapid runoff from steep terrain during heavy precipitation (see Water Resources 4.4.4). Subsequent impacts are then compounded by urban and rural development along rivers and floodplains, aging infrastructure, and intensifying storms (see Water Resources 4.4.3, Infrastructure 7.3.1, 7.4.1, and 7.5, and Community Development 11.5).
July 2023 was the first flood event to accrue damages totaling over $1 billion (NOAA NCEI, 2025), and was triggered by a single 48-hour rainstorm (Smith et al., 2025). The Montpelier NWS station measured the highest average July precipitation on record of 12.1 inches/day in 2023 (307 mm/day; Banacos, 2023). This event occurred as a result of variable and strong wind patterns, regional moisture accumulation and rising dewpoints, as well as an atmospheric pressure block that restricted the storm's movement and concentrated it over Vermont (Banacos, 2023). While atmospheric or weather blocking (i.e., when atmospheric pressure remains stationary) is expected to decline with climate change (Kennedy et al., 2016), increasing temperatures and absolute humidity as well as the weakening of the jet stream are expected to fuel similar extreme weather events at increasing frequencies in the future (Stendel et al., 2021).
While both the July 2023 and 2024 floods occurred during the summer, winter and spring flooding events are also expected to increase in frequency across Vermont (EPA, 2016), likely resulting from intensifying Nor’easters. These storm systems form over the Atlantic Ocean along the East Coast often resulting in rain-on-snow and ice jam floods (National Environmental Satellite, Data, and Information Service, 2026). Other flood events are linked to the remnants of tropical storms and hurricanes, which are also becoming more frequent, intense, and variable over time (e.g., Tropical Storm Irene in 2011; NOAA, 2024).
2.6.3 Drought
Drought can be viewed in many ways: meteorological, hydrological (see Water Resources 4.3.2), agricultural (see Agriculture & Food Systems 6.4.1), as well as ecological, and even socioeconomic. The meteorological component of a drought is characterized by the degree and duration of dryness. The definition of “dryness” varies by region and its typical climate; therefore, a drought in Vermont is different from one in the Southwestern U.S. This report uses the USDM index (U.S. Drought Monitor, 2026b) which classifies dryness into five categories, from D0 (abnormally dry) to D4 (exceptional drought) based on aggregated data across the region. Concurrently, the Standard Precipitation Index (SPI) displays how monthly precipitation deviates from historical averages, allowing a direct comparison between the percent of land area experiencing abnormalities ranging from “exceptionally dry” to “exceptionally wet” conditions (Figure 2-24; National Integrated Drought Information System, 2026).
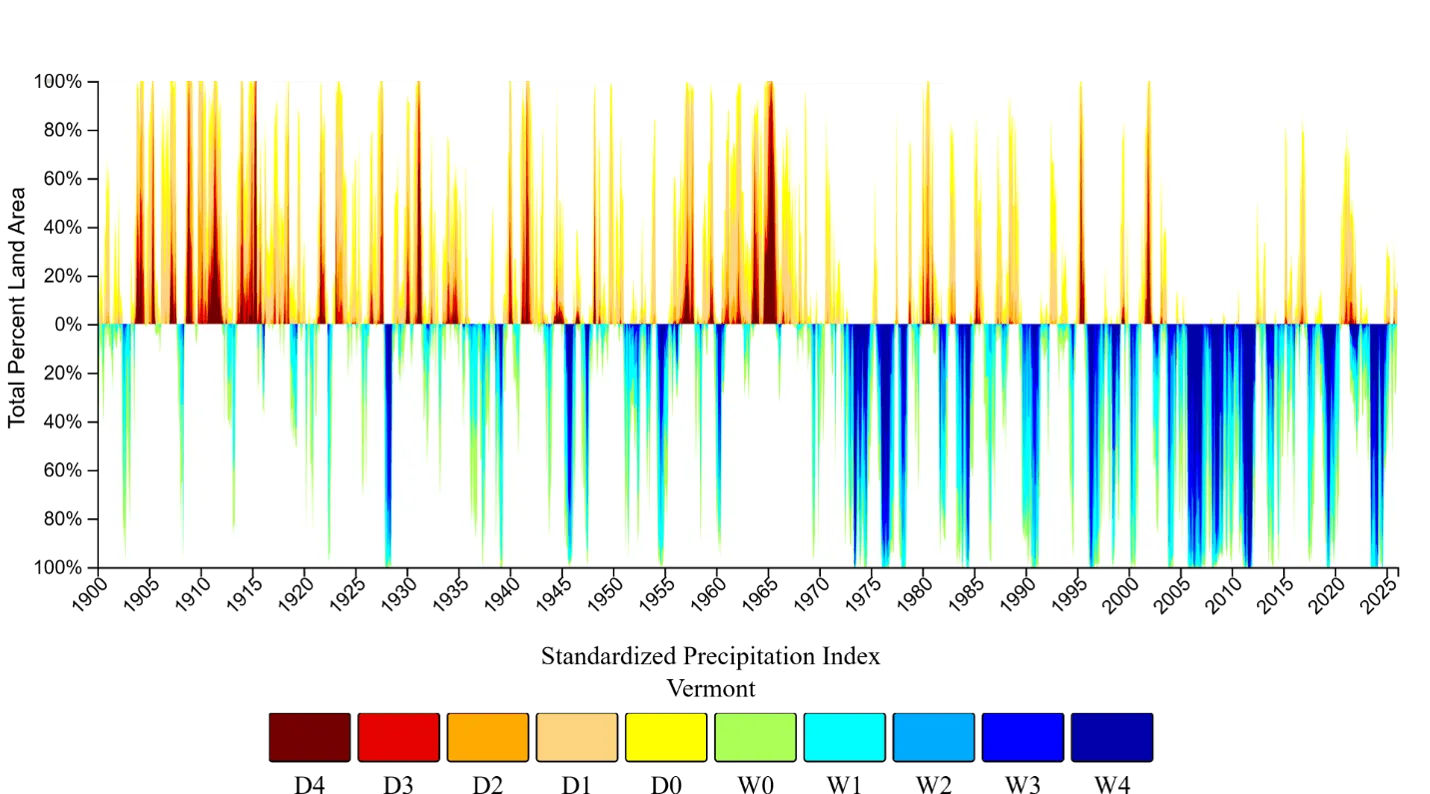
Source: National Integrated Drought Information System (2026)
Note: Percent area of Vermont experiencing above average dry conditions with drought conditions ranging from D0 (abnormally dry) to D4 (exceptional drought), and abnormally wet conditions classified as W0 (abnormally wet) to W4 (exceptionally wet)
The recent June–October 2025 drought that plagued the Northeast U.S. is a stark reminder that floods are not the only type of extreme event that affects Vermonters. Drought risk in Vermont is exacerbated by warming temperatures and highly variable summer precipitation (see 2.5.4). Vermont has experienced decreasing trends in abnormal dry conditions in the long- and mid-terms, with matching increasing trends in abnormal wet conditions in those same time periods (Table 2-6); however, these trends have weakened and sometimes inverted in the near-term (1990–2024). The proportion of Vermont’s area affected by abnormally dry conditions (D0) decreased by 3.1 percent/decade since 1900 and 3.3 percent/decade since 1960 before slowing to 0.1 percent/decade since 1990. Similarly, the proportion of Vermont’s area affected by abnormally wet conditions (W0) increased by 3.9 percent/decade since 1900 and 5.4 percent/decade since 1960 before inverting to a decrease of 2.7 percent/decade since 1990. When considering both trends, dry conditions are likely to become more common across Vermont in the future and should be monitored closely in future assessments.
Time periods | Trending Dry Conditions | Trending Wet Conditions | ||||||||
|---|---|---|---|---|---|---|---|---|---|---|
| D0 | D1 | D2 | D3 | D4 | W0 | W1 | W2 | W3 | W4 | |
1900–2024 | -3.09* | -2.24 | -0.96 | -0.56 | -0.22 | 3.88* | 3.40 | 2.25 | 1.56 | 0.81 |
1960–2024 | -3.27* | -1.96 | -1.12 | -0.21 | -0.10 | 5.41* | 4.69 | 3.59 | 2.74 | 1.35 |
1990–2024 | -0.06* | -0.22 | 0.09 | -0.30 | -0.25 | -2.73* | -0.77 | 0.72 | 1.47 | 1.31 |
Source: National Integrated Drought Information System (2026)
Note: Percent area of Vermont experiencing above average dry conditions with drought conditions ranging from D0 (abnormally dry) to D4 (exceptional drought), and abnormally wet conditions classified as W0 (abnormally wet) to W4 (exceptionally wet). All values represent percentages; those with an asterix (*) are statistically significant at a 95% confidence level
Vermont has experienced more frequent flash droughts in recent years, aligned with projections for the Northeast U.S. While conventional droughts develop gradually (months to years), flash droughts develop and intensify rapidly (within days or weeks), quickly damaging crop and water supplies (see Agriculture and Food Systems 6.4.1). Because of their sudden onset, flash droughts are more difficult to predict and prepare for, sometimes exacerbating impacts across sectors.
The most recent flash drought in Vermont occurred in the summer of 2025. While May 2025 was 49% wetter than the long-term monthly average, the following July–September 2025 were substantially drier than average setting the stage for a flash drought (Moynihan, 2025). The drought began in July with 56% less precipitation than the long-term average (1900–2025), and was followed by a 70% drier August, and 31% drier September. Normal precipitation levels finally arrived in late October, though drought conditions continued until ecosystems rebounded from the recent extremes in November 2025. Drought conditions in 2025 were the most severe on record since 2000, with 100% of the state under drought conditions on 9/16/2025 (Sanders, 2025). By October 14, 2025, the drought reached its peak with 67% of Vermont under extreme drought conditions (D3) while the rest of the state experienced severe (D2) or moderate drought conditions (D1); the drought intensity varied by location with the Northeast division and central Vermont suffering the most. The absence of extreme drought conditions and the return to a no-drought status in northwest Vermont along Lake Champlain signaled a return to normal around November 2025 (Figure 2-25). This event followed a series of flash droughts across the Northeast U.S. and New York with fewer years of reprieve between them. Across this region, 2000, 2016, 2020, 2022, and 2025 all experienced drought conditions only previously seen in the 1960s (NIDIS 2026).
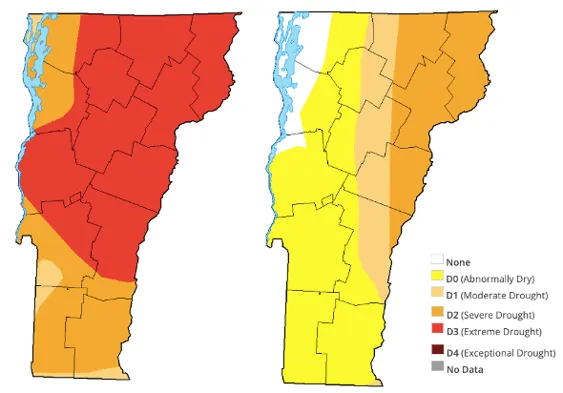
Source: U.S. Drought Monitor (2026)
Note: Map on the left (Oct 14, 2025) shows drought at its peak: 100% of Vermont under drought conditions; 67% under extreme drought (D3 status in red), 33% experiencing severe (D2 status in orange) or moderate drought (D1 status). Map on the right (Nov 18, 2025) shows no extreme drought, 25% of the state under severe drought (D2 in orange), 17% under moderate drought (D1 in tan), and less than 50% remaining abnormally dry
2.6.4 Wind
In Vermont, there is no current research demonstrating changes in average wind speeds, but recent years have seen notable extreme wind events that have impacted infrastructure and caused significant power outages (see Infrastructure 7.5.1 and Energy 8.4.1). When Green Mountain Power announced its Zero Outages Initiative in 2023, it cited the "urgent need following [a] devastating year of severe climate change-driven storms" (Green Mountain Power, 2023). Vermont Public explained, "most outages come from local distribution line problems, like a windstorm knocking down a tree limb that then falls on a transmission line bringing power from a substation into a home or business" (Jarecki & Wilson, 2023).
During the January 9–10, 2024 storm, high winds blew trees across roads, ensnared power lines, and damaged homes across Vermont. Wind gusts reached up to 70 mph (113 km/h), with the National Weather Service at the Burlington Airport recording 69 mph (111 km/h)—the fourth highest wind gust on record at that location. The storm left nearly 30,000 Vermont customers without power and resulted in a federal disaster declaration for five counties, with over $2.3 million in identified damages (Vermont Emergency Management, 2024). This "Southeaster" storm was particularly damaging because strong winds came from the southeast, a direction that Vermont's infrastructure is less prepared to handle. Beyond energy and infrastructure concerns, changes in wind patterns could threaten the risk of wildfire spread and smoke exposure (see Forests 3.6.3, and Human Health 10.5.1).
Other notable high wind events include a December 2022 storm, when the NWS recorded a 71 mph (114 km/h) gust, which was the second highest on record for the Burlington station. On April 15, 2007, a windstorm brought powerful easterly downslope winds to Rutland, Vermont, uprooting approximately 100 city-owned trees and over 1,000 private trees, leaving nearly 60,000 customers without power (NOAA, 2010).
While average winds may remain relatively stable, extreme wind events or shifting wind directions could become more intense under climate change. Warmer oceans mean that hurricanes or tropical storms reaching the shores of the Northeast U.S. carry more energy, potentially yielding higher peak gusts in Vermont. Likewise, warmer winters with more frequent and intense mid-latitude cyclones can produce occasional powerful windstorms. The occurrence of high winds in Vermont shows a strong correlation with elevation, with mountains and hills seeing higher wind speeds especially in winter, while valleys remain calmer (Dupigny-Giroux & Shafer, 2021).
More research is needed on direct correlations between climate change and extreme wind events in Vermont as well as trends in average, seasonal, and extreme wind speeds. While the physical mechanisms linking warming to more energetic storms are well-established, Vermont-specific data on wind speed trends and their relationship to climate change remain limited.
2.7 Vermont's future climate
Over 190 countries and territories decided in the Paris Climate Agreement (2015)—a legally binding, international climate treaty—that their highest peak of GHG emissions would occur before 2025 to limit global warming to an average of 2.7ºF (1.5ºC) above pre-industrial levels (1850–1900; United Nations, 2026). Ten years after the Paris Agreement, GHG emissions continue to outpace emission reductions achieved through efficiency. Both 2024 and 2025 surpassed the 2.7ºF (1.5ºC) threshold, with 2024 marked as the warmest year on record since 1850 (NOAA, 2025a). Globally, the past 10 years (2015–2024) were the warmest years on record (World Meteorological Organization, 2025). However, because climate change is measured across multi-decadal averages, the goal of the international accord has not yet technically been surpassed.
With emissions continuing to rise and climate change impacts only worsening, Vermont’s climate is projected to become warmer and wetter. Average temperatures could increase by 2.0°F (1.1°C) by 2050 and 4.0–9.0°F (2.2–5.0°C) by 2100 (Vermont Climate Council, 2025). A low emissions scenario projects annual average temperatures to stabilize at 48°F (8.9°C) in the 2090s, while a high emissions scenario predicts annual average temperatures will continue to rise past 54°F (12.2°C; Figure 2-26). These scenarios are derived from the IPCC scenarios “Sustainability” and “Inequality,” respectively (see 2.10.1). Other modeling efforts predict that winter temperatures will increase 5.3–6.7°F (2.9–3.7°C) for maximum and minimum temperatures across Vermont (Burakowski et al., 2021). By 2050, annual rainfall is expected to increase by 1–2 inches (25–51mm), and between 4–9 inches (102–229 mm) by 2100. Given temperature and precipitation trends, Vermonters can expect increasing frequencies of both flooding and drought. Snowfall declines will likely coincide with these shifts, further challenging outdoor recreation economies dependent on Vermont’s historical winter wonderland. Meanwhile summer extremes including the number of hot days (over 90° F/32° C) are expected to double by 2050, placing undue stress on social and ecological systems (Vermont Climate Council, 2025).
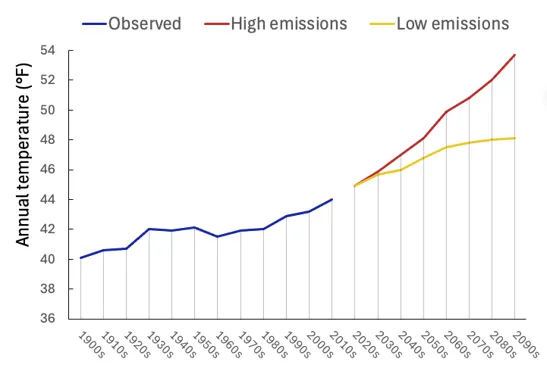
Source: Vermont Climate Council (2025)
The state of Vermont has been proactive in working towards climate change mitigation and adaptation solutions. Vermont serves as an active member of the U.S. Climate Alliance, a coalition of 24 states seeking to reduce GHG emissions (U.S. Climate Alliance, 2026), and passed the Global Warming Solutions Act (GWSA) in 2020 (Vermont General Assembly, 2020). The GWSA sets ambitious, legally binding GHG emissions reduction targets, and led to the creation of the Vermont Climate Council, which is responsible for developing Vermont’s Climate Action Plan (Vermont Climate Council, 2025). The Climate Action Plan is Vermont’s long-term planning roadmap for reducing GHG emissions, preparing for climate-change-related impacts, and transitioning the state toward a cleaner and more resilient economy. The Climate Action Plan was first released in 2021 then updated in 2025 (updates are required every four years; Vermont Climate Council, 2021, 2025). While the GWSA demonstrates a clear intention to reduce or mitigate GHG emissions, it lacks enforcement mechanisms, and the 2025 targets (26% below 2005 levels) were likely not met (Vermont Climate Council, 2025).
The Vermont Legislature further passed the Vermont Climate Superfund Act in 2024 (State of Vermont, 2024). Vermont was the first state to pass such legislation to hold fossil fuel companies financially responsible for climate-related damages incurred statewide. The funds generated would be used to progress adaptation projects in the Climate Superfund Cost Recovery Program (Layne & Severns, 2024). The Act has been challenged in court by the Trump administration and the extent to which this legislation will be able to fund adaptation remains to be seen (Gaffney, 2025). To address climate change risks, Vermont needs to develop and implement adaptation solutions on three fronts: social programs (to improve equity and justice), ecosystem-based adaptation (based on collaboration with Indigenous groups and local communities), and new technologies and infrastructure (IPCC, 2023). The following chapters in this assessment will discuss both climate change impacts and potential adaptation strategies specifically related to the prominent sectors across Vermont.
2.9 References
Banacos, P. (2023, October 28). The Great Vermont Flood of 10-11 July 2023: Preliminary Meteorological Summary. NOAA’s National Weather Service. https://www.weather.gov/btv/The-Great-Vermont-Flood-of-10-11-July-2023-Preliminary-Meteorological-Summary
Ben Frechette. (2024, June 20). Historic temperature records broken and tied in Burlington on second day of June heat wave. NBC5. https://www.mynbc5.com/article/historic-temperature-records-burlington/61187527
Bevacqua, E., Schleussner, C.-F., & Zscheischler, J. (2025). A year above 1.5 °C signals that Earth is most probably within the 20-year period that will reach the Paris Agreement limit. Nature Climate Change, 15(3), 262–265. https://doi.org/10.1038/s41558-025-02246-9
Bhattarai, S., Bokati, L., Sharma, S., & Talchabhadel, R. (2025). Understanding spatiotemporal variation of heatwave projections across US cities. Scientific Reports, 15. https://doi.org/10.1038/s41598-025-95097-5
Burakowski, E. A., Contosta, A. R., Grogan, D., Nelson, S. J., Garlick, S., & Casson, N. (2021). Future of Winter in Northeastern North America: Climate Indicators Portray Warming and Snow Loss that will Impact Ecosystems and Communities. Northeastern Naturalist, 28, 180–207. https://doi.org/https://www.jstor.org/stable/48696335
Chen, Z., Zhou, T., Zhang, W., Li, P., & Zhao, S. (2020). Projected Changes in the Annual Range of Precipitation Under Stabilized 1.5°C and 2.0°C Warming Futures. Earth’s Future, 8(9), e2019EF001435. https://doi.org/https://doi.org/10.1029/2019EF001435
Christian, J. I., Basara, J. B., Otkin, J. A., & Hunt, E. D. (2019). Regional characteristics of flash droughts across the United States. Environmental Research Communications, 1(12), 125004. https://doi.org/10.1088/2515-7620/ab50ca
Copernicus Climate Change Service (2025). (2026). ERA5 hourly time-series data on single levels from 1940 to present [Dataset]. Copernicus Climate Change Service (C3S) Climate Data Store (CDS). https://cds.climate.copernicus.eu/datasets/reanalysis-era5-single-levels-timeseries
Cornell University. (2023). Climate Change Impacts in the Northeast. Northeast Regional Climate Center. https://www.nrcc.cornell.edu/services/blog/2023/11/15/
Doesken, N. J., & Judson, A. (1996). The Snow Booklet: A Guide to the Science, Climatology, and Measurement of Snow in the United States. Colorado State University. https://mountainscholar.org/items/f69459f7-b1c0-4332-9d8f-d40bc165ecbf/full
Dupigny-Giroux, L.-A., Mecray, E., Lemcke-Stampone, M., Hodgkins, G. A., Lentz, E. E., Mills, K. E., Lane, E. D., Miller, R., Hollinger, D., Solecki, W. D., Wellenius, G. A., Sheffield, P. E., MacDonald, A. B., & Caldwell. (2018). Chapter 18: Northeast. Impacts, Risks, and Adaptation in the United States: The Fourth National Climate Assessment, Volume II. (U.S. Global Change Research Program). https://repository.library.noaa.gov/view/noaa/19487
Dupigny-Giroux, L.-A., & Shafer, S. (2021). Climate Change in Vermont. Vermont Climate Council. https://outside.vermont.gov/agency/anr/climatecouncil/Shared%20Documents/(3)%20CLIMATE_CHANGE_IN_VERMONT_DUPIGNY-GIROUX_SHAFER…
EPA. (2016). What Climate Change Means for Vermont. United States Enviromental Protection Agency. https://archive.org/details/climate-change-vt/mode/2up
Flood Risk America. (2024, June 27). The Effects Of Droughts: Why Floods Follow Periods Of Drought. https://floodriskamerica.com/blog/why-floods-follow-periods-of-drought/
Gaffney, A. (2025). Trump administration asks judge to rule against Vermont’s climate superfund law—VTDigger. https://vtdigger.org/2025/09/16/trump-administration-asks-judge-to-rule-against-vermonts-climate-superfund-law/
Galford, G. L., Faulkner, J., Dupigny-Giroux, L.-A., Posner, S., & Edling, L. (2021). The Vermont Climate Assessment 2020. Gund Institute of Environment, University of Vermont. https://doi.org/10.18125/kowgvg
Global Warming Solutions Act, 153, H.688 (2020). https://legislature.vermont.gov/Documents/2020/Docs/ACTS/ACT153/ACT153%20As%20Enacted.pdf
Gocic, M., & Trajkovic, S. (2013). Analysis of changes in meteorological variables using Mann-Kendall and Sen’s slope estimator statistical tests in Serbia. Global and Planetary Change, 100, 172–182. https://doi.org/10.1016/j.gloplacha.2012.10.014
Green Mountain Power. (2023, October 10). Green Mountain Power Launches First in Nation 2030 Zero Outages Initiative. https://greenmountainpower.com/news/green-mountain-power-launches-first-in-nation-2030-zero-outages-initiative/
Hale, K., Schroth, A., Shanley, J., & Wemple, B. (2025). Warmer Winters Drive Declines in Snowpack and Consequent Increases in Annual and Seasonal Runoff in a Headwater Region of the Northeastern United States. Hydrological Processes, 39(2), e70092. https://doi.org/10.1002/hyp.70092
Hayhoe, K., Wuebbles, D. J., Easterling, D. R., Fahey, D. W., Doherty, S., Kossin, J. P., Sweet, W. V., Vose, R. S., & Whner, M. F. (2018). Chapter 2: Our Changing Climate. Impacts, Risks, and Adaptation in the United States: The Fourth National Climate Assessment, Volume II. (U.S. Global Change Research Program). https://repository.library.noaa.gov/view/noaa/19487
Hoerling, M. (2018). Temperature and drought: A science assessment by a subgroup of the Drought Task Force. https://repository.library.noaa.gov
IPCC. (2023). Climate Change 2021 – The Physical Science Basis: Working Group I Contribution to the Sixth Assessment Report of the Intergovernmental Panel on Climate Change (1st ed.). Cambridge University Press. https://doi.org/10.1017/9781009157896
IPCC, 2023: Summary for Policy Makers. (First, Climate Change 2023: Synthesis Report. Contribution of Working Groups I, II and III to the Sixth Assessment Report of the Intergovernmental Panel on Climate Change, pp. 1–34). (2023). Intergovernmental Panel on Climate Change (IPCC). https://doi.org/10.59327/IPCC/AR6-9789291691647
Jarecki, J., & Wilson, N. (2023, October 31). Green Mountain Power Plans to End Outages by 2030. How Realistic Is That?Vermont Public. https://www.vermontpublic.org/local-news/2023-10-31/green-mountain-power-plans-to-end-outages-by-2030-how-realistic-is-that
Sanders, Jeff. (2025, September 24). Vermont’s 2025 Drought and Cover Cropping: Stay the Course. https://www.uvm.edu/extension/nwcrops/news/vermonts-2025-drought-and-cover-cropping-stay-course
Kendall, M. (1975). Rank correlation measures. (4th ed.). Charles Griffin.
Kennedy, D., Parker, T., Woollings, T., Harvey, B., & Shaffrey, L. (2016). The response of high-impact blocking weather systems to climate change. Geophysical Research Letters, 43(13), 7250–7258. https://doi.org/10.1002/2016GL069725
Kunkel, K. E. (2022). State Climate Summaries for the United States 2022. NOAA Technical Report NESDIS 150. NOAA NESDIS. https://statesummaries.ncics.org/chapter/vt
Layne, R., & Severns, A. (2024, June 20). Vermont and New York Climate Acts are First in a Wave of Likely Climate Change Cost Recovery Laws. Sidley. https://www.sidley.com/en/insights/newsupdates/2024/06/vermont-and-new-york-climate-acts-are-first-in-a-wave-of-likely-climate-…
Mann, H. B. (1945). Nonparametric Tests Against Trend. Econometrica, 13(3), 245. https://doi.org/10.2307/1907187
Marvel, K., Su, W., Delgado, R., Aarons, S., Chatterjee, A., Garcia, M. E., Hausfather, Z., Hayhoe, K., Hence, D. A., Jewett, E. B., Robel, A., Singh, D., Tripati, A., & Vose, R. S. (2023). Chapter 2: Climate trends. In Fifth National Climate Assessment. https://nca5.climate.us/chapter/2
Mohajan, H. (2021). Third Industrial Revolution Brings Global Development. 7, 239–251. https://www.researchgate.net/publication/356831155_Third_Industrial_Revolution_Brings_Global_Development
Moynihan, K. (2025, September 20). Vermont drought is hitting dairy farmers hard as they turn to costly measures to care for cattle. CBS News. https://www.cbsnews.com/news/vermont-drought-dairy-farmers-costly-measures-cattle/
National Centers for Environmental Information (NCEI). (2026). Geographical Reference Maps | CONUS Climate Divisions. https://www.ncei.noaa.gov/access/monitoring/reference-maps/conus-climate-divisions
National Environmental Satellite, Data, and Information Service (2026). What Is a Nor’easter? https://www.nesdis.noaa.gov/about/k-12-education/severe-weather/what-noreaster
National Integrated Drought Information System. (2026). Explaining Drought Category Maps | Drought.gov. National Integrated Drought Information System. https://www.drought.gov/explaining-drought-category-maps
NOAA. (2010). WFO BTV Top 10 Weather Events of 2000 to 2009. National Weather Service Forecast Office, Burlington, VT. https://www.weather.gov/media/btv/events/TopTen2000/TopTen2000.pdf
NOAA. (2015). Discussion on Humidity. NOAA’s National Weather Service. https://www.weather.gov/lmk/humidity
NOAA. (2015, November 24). Climate change rule of thumb: Cold “things” warming faster than warm things | NOAA Climate.gov. https://www.climate.gov/news-features/blogs/beyond-data/climate-change-rule-thumb-cold-things-warming-faster-warm-things
NOAA. (2025a, January 10). 2024 was the world’s warmest year on record. https://www.noaa.gov/news/2024-was-worlds-warmest-year-on-record
NOAA. (2025b, May 29). Increases in atmospheric carbon dioxide and global temperature (1850-2024). Climate.Gov. https://www.climate.gov/media/16969
NOAA. (2026a). During a Heat Wave. National Weather Service. https://www.weather.gov/safety/heat-during
NOAA. (2026b). What is the heat index? NOAA’s National Weather Service. https://www.weather.gov/ama/heatindex
NOAA National Centers for Environmental Information. (2025). Climate Division Data for Vermont [Dataset]. https://www.ncei.noaa.gov/access/monitoring/climate-at-a-glance/divisional/time-series
NOAA NCEI. (2025). U.S. Billion-Dollar Weather and Climate Disasters (2025) [Dataset]. NOAA National Centers for Environmental Information. https://www.ncei.noaa.gov/access/billions/
NOAA NCEI. (2025). U.S. Climate Extremes Index. NOAA Centers for Environmental Information. https://www.ncei.noaa.gov/access/monitoring/cei/graph/ne/01-12/cei
NOAA NCEI. (2026). Climate at a Glance: National Time Series. NOAA National Centers for Environmental Information. https://www.ncei.noaa.gov/access/monitoring/climate-at-a-glance/regional
NOAA NESDIS. (2026). What Causes a Drought? National Environmental Satellite, Data, and Information Service. https://www.nesdis.noaa.gov/about/k-12-education/severe-weather/what-causes-drought
NOAA NIDIS. (2025, September 30). Drought Status Update for the Northeast. https://www.drought.gov/drought-status-updates/drought-status-update-northeast-2025-09-30
NOAA NIDIS. (2026). U.S. Drought Monitor (USDM). Drought.gov. NOAA National Integrate Drought Information System. https://www.drought.gov/data-maps-tools/us-drought-monitor
NOAA Regional Climate Centers. (2026). Applied Climate Information System (ACIS) Station Data or XMACIS Climate Database [Dataset]. NOAA/NCDC:GHCN-Daily. https://xmacis.rcc-acis.org/
NOAA’s National Weather Service. (2025). Hurricane Irene: 10 Years Later. NOAA. https://www.weather.gov/gyx/Irene_Anniversary
Otkin, J. A., Zhong, Y., Ford, T. W., Anderson, M. C., Hain, C., Hoell, A., Svoboda, M., & Wang, H. (2024). Multivariate Evaluation of Flash Drought Across the United States. Water Resources Research, 60(11), e2024WR037333. https://doi.org/10.1029/2024WR037333
Pepin, N. C., Arnone, E., Gobiet, A., Haslinger, K., Kotlarski, S., Notarnicola, C., Palazzi, E., Seibert, P., Serafin, S., Schöner, W., Terzago, S., Thornton, J. M., Vuille, M., & Adler, C. (2022). Climate Changes and Their Elevational Patterns in the Mountains of the World. Reviews of Geophysics, 60(1), e2020RG000730. https://doi.org/10.1029/2020RG000730
Pizzorni, M., Innocenti, A., & Tollin, N. (2024). Droughts and floods in a changing climate and implications for multi-hazard urban planning: A review. City and Environment Interactions, 24, 100169. https://doi.org/https://doi.org/10.1016/j.cacint.2024.100169
R Core Team. (2026). R: A language and environment for statistical computing. R Foundation for Statistical Computing, Vienna, Austria. https://www.R-project.org/
Riahi et al. (2017). The Shared Socioeconomic Pathways and their energy, land use, and greenhouse gas emissions implications: An overview, Global Environmental Change (2022) – processed by Our World in Data [Dataset]. https://ourworldindata.org/explorers/ipcc-scenarios?Metric=Greenhouse+gas+concentrations&Rate=Per+capita&Region=Global&country=…
Ribes, A., Tessiot, O., Forster, P. M., Gillett, N. P., Masson-Delmotte, V., Rogelj, J., Vautard, R., & Walsh, T. (2025). Towards annual updating of forced warming to date and constrained climate projections. Nature Communications, 16(1), 9214. https://doi.org/10.1038/s41467-025-63026-9
Robinson, W. A. (2021). Climate change and extreme weather: A review focusing on the continental United States. Journal of the Air & Waste Management Association, 71(10), 1186–1209. https://doi.org/10.1080/10962247.2021.1942319
Schmidlin, T. W., Dethier, B. E., & Eggleston, K. L. (1987). Freeze-Thaw Days in the Northeastern United States. https://journals.ametsoc.org/view/journals/apme/26/1/1520-0450_1987_026_0142_ftditn_2_0_co_2.xml
Smith, T. L., Olson, S. A., LeNoir, J. M., Kalmon, R. D., & Ahearn, E. A. (2025). Flood of July 2023 (Nos. 2025–5016; U.S. Geological Survey Scientific Investigations). https://doi.org/10.3133/sir20255016
State of Vermont. (2024). Climate Superfund Act. https://climatechange.vermont.gov/climate-superfund
Stendel, M., Francis, J., White, R., Williams, P. D., & Woollings, T. (2021). Chapter 15—The jet stream and climate change. In T. M. Letcher (Ed.), Climate Change (Third Edition) (Third Edition, pp. 327–357). Elsevier. https://doi.org/https://doi.org/10.1016/B978-0-12-821575-3.00015-3
Thibeault, J., & Seth, A. (2014). Changing climate extremes in the Northeast United States: Observations and projections from CMIP5. Climatic Change, 127(2), 273–287. https://doi.org/https://doi.org/10.1007/s10584-014-1257-2
United Nations. (2026). The Paris Agreement. United Nations. United Nations. https://www.un.org/en/climatechange/paris-agreement
United Nations Environment Programme. (2024). Keeping the Promise—Annual Report 2023. https://doi.org/10.59117/20.500.11822/44777
U.S. Climate Alliance. (2026). United States Climate Alliance Members. https://usclimatealliance.org/members/
U.S. Drought Monitor. (2026a). Compare Two Weeks. https://droughtmonitor.unl.edu/Maps/CompareTwoWeeks.aspx
U.S. Drought Monitor. (2026b). What is the USDM? National Drought Mitigation Center. Drought Monitor. https://droughtmonitor.unl.edu/About/WhatistheUSDM.aspx
US EPA, O. (2024, November 19). Extreme Heat [Overviews and Factsheets]. https://www.epa.gov/climatechange-science/extreme-heat
USGCRP. (2023). Fifth National Climate Assessment (No. 5th). U.S. Global Change Research Program. https://nca5.climate.us/downloads/NCA5_2023_FullReport.pdf
Vermont Climate Council. (2021). Initial Vermont Climate Action Plan. https://outside.vermont.gov/agency/anr/climatecouncil/Shared%20Documents/Initial%20Climate%20Action%20Plan%20-%20Final%20-%2012…
Vermont Climate Council. (2025). Vermont Climate Action Plan 2025. Vermont Climate Council. https://outside.vermont.gov/agency/anr/climatecouncil/Shared%20Documents/VermontClimateActionPlan2025.pdf?_gl=1*hidmyq*_ga*MzY0…
Vermont Emergency Management. (2024, May). Vermont Emergency Management Newsletter. https://vem.vermont.gov/contact-us/newsletter/may24
Vermont Historical Society. (2025). Blizzard of 1888. Vermont History Explorer. https://vermonthistoryexplorer.org/blizzard-of-1888
Vose, R. S., Applequist, S., Squires, M., Durre, I., Menne, M. J., Williams, C. N., Fenimore, C., Gleason, K., & Arndt, D. (2022). Vermont State Climate Summary 2022 (p. 4). North Carolina Institute for Climate Studies. https://statesummaries.ncics.org/chapter/vt/
Water Science School. (2018, June 11). The 100-Year Flood. https://www.usgs.gov/water-science-school/science/100-year-flood
Whitehead, J. C., Mecray, E. I., Lane, E. D., Kerr, L., Finucane, M. I., Reidmiller, D. R., Bove, M. C., Montalto, F. A., O’Rourke, S., Zarrilli, D. A., Chigbu, P., Thornbrugh, C. C., Curchitser, E. N., Hunter, J. G., & Law, K. (2023). Chapter 21: Northeast. In Fifth National Climate Assessment. https://nca5.climate.us/downloads/NCA5_Ch21_Northeast.pdf
Whittier, S. (2023). 25th Anniversary of the Devastating 1998 Ice Storm in the Northeast. NOAA’s National Weather Service. National Weather Service. https://www.weather.gov/btv/25th-Anniversary-of-the-Devastating-1998-Ice-Storm-in-the-Northeast
Woodsmoke Productions and Vermont Historical Society. (2025). The Flood of ’27, 1927. The Green Mountain Chronicles radio broadcast and background information, original broadcast 1988-89. Vermont Historical Society. https://vermonthistory.org/flood-of-27-1927
World Meteorological Organization. (2025, January 10). WMO confirms 2024 as warmest year on record at about 1.55°C above pre-industrial level. World Meteorological Organization. https://wmo.int/news/media-centre/wmo-confirms-2024-warmest-year-record-about-155degc-above-pre-industrial-level
Xue, Z., & Ullrich, P. A. (2022). Changing Trends in Drought Patterns over the Northeastern United States Using Multiple Large Ensemble Datasets. Journal of Climate, 35(22), 7413–7433. https://doi.org/10.1175/JCLI-D-21-0810.1
Yang, J., Zhao, L., & Oleson, K. (2023). Large humidity effects on urban heat exposure and cooling challenges under climate change. Environmental Research Letters, 18(4), 044024. https://doi.org/10.1088/1748-9326/acc475
Young, S. S., & Young, J. S. (2025). Decreasing Snow Cover and Increasing Temperatures Are Accelerating in New England, USA, with Long-Term Implications. Climate, 13(12), 246. https://doi.org/10.3390/cli13120246
2.10 Appendix
2.10.1 Global climate change
The IPCC developed five climate change trajectories through the year 2100 based on different levels of global mitigation efforts for GHGs (referred to as Shared Socioeconomic Pathways or SSPs) and the resulting warming levels (referred to as radiative forcing). The SSPs range from high mitigation to absence of mitigation: SSP1: sustainability, SSP2: Middle of the road (slow progress on sustainability, moderate emissions), SSP3: Regional rivalry (nationalism, regional conflicts), SSP4: Inequality (haves and have-nots), and finally SSP5: Fossil-fueled development (high energy demand, focus on rapid economic development; Figure 2-27).
The IPCC combines 20–40 global climate models to characterize climate change under the SSPs. These global climate models are complex computer programs designed to quantify interactions between ocean, atmosphere, and land use inputs such as CO2 and temperatures. Projections are generated to capture long-term trends in large geographical areas to help with decision-making. The 2023 IPCC projections may be a conservative representation as recent studies suggest these projections should be revised upward (Ribes et al., 2025).
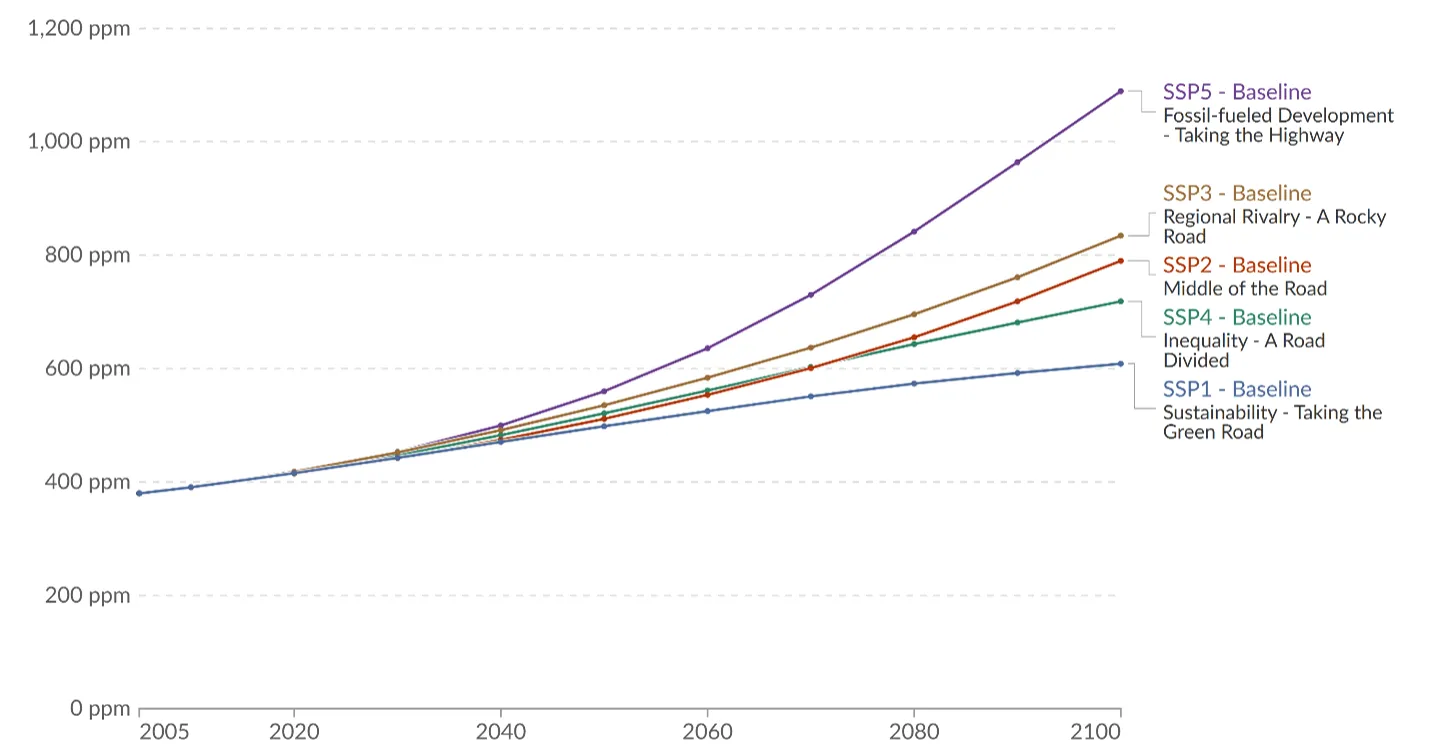
Source: Riahi et al. (2017)
Note: Global atmospheric concentrations of carbon dioxide measured in parts per million, observed 2005–2015, and projected 2015–2100
The two most ambitious scenarios in terms of mitigation (sustainability and middle of the road) are the only scenarios for which a reduction in carbon dioxide emissions is possible, while the sustainability scenario is the only scenario likely to maintain the global average temperature within a sustainable range by 2100, that is, below 2.7ºF (1.5ºC), which was defined as the goal of the 2015 Paris Climate Agreement (Figure 2-28; Table 2-8). Figure 2-28 displays historic global temperature and precipitation change (1950–2017) and modelled changes (ºC, %) with the 5 emissions scenarios modelled in the near term (2021–2040), mid-term (2041–2060) and long term (2081–2100). As models extend further from historic records, variability increases, displayed by the growing shaded region around modelled lines and range predictions in panel b. SSP2 “Middle of the Road” most closely aligns with current climate observations and projections (Bevacqua et al., 2025), indicating a likely 3.1ºF (1.7ºC), and 3.2ºF (1.8ºC) global temperature increase in the mid- and long-term with maximum increases of 4–4.3ºF (2.2–2.4ºC). SSP2 also predicts a change in precipitation of 2.8% (mid-term) and 3.3% (long-term) from baseline levels (1995–2014), with maximum changes in precipitation of 5.2–6.6%. As discussed in the main chapter, such changes in global air temperatures and precipitation levels are expected to dramatically impact quality of life across the globe and especially for marginalized communities.
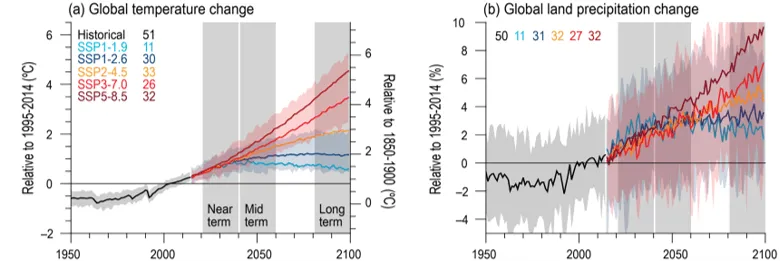
Source: IPCC (2023)
Note: Selected indicators representing global climate change from CMIP6 historical and scenario simulations. SSP-1, SSP-2, and SSP-3 are projected to reduce emissions, while SSP-4 and SSP-5 are projected to increase emissions, therefore, global temperature and precipitation changes increase accordingly. Change is calculated according to averages between 1995–2014 average (left axis) and 1850–1900 (right axis). Near term, mid-term and long-term projections are shown in gray highlighted areas, variability amongst these projections increases the further you get from historical record, shown by the highlighted areas around each SSP modelled line
IPCC Scenario | SSP1 Sustainability | SSP2 Middle of the Road | SSP3 Regional Rivalry | SSP4 Inequality | SSP5 Fossil-fueled Development |
|---|---|---|---|---|---|
| Mid term Temperature (°F) | 2.9 (2.2, 3.6) | 3.1 (2.3, 4.0) | 3.6 (2.9, 4.5) | 3.8 (3.1, 4.7) | 4.3 (3.4, 5.4) |
| Long term Temperature (°F) | 2.5 (1.8, 3.2) | 3.2 (2.3, 4.3) | 4.9 (3.8, 6.3) | 6.5 (5.0, 8.3) | 7.9 (5.9, 0.3) |
| Mid term Precipitation (%) | 2.7 (0.6, 5.0) | 2.8 (–0.4, 5.2) | 2.7 (0.3, 5.2) | 2.5 (–0.8, 5.1) | 3.7 (–0.1, 6.9) |
| Long term Precipitation (%) | 2.4 (–0.2, 4.7) | 3.3 (0.0, 6.6) | 4.6 (1.5, 8.3) | 5.8 (0.5, 9.6) | 8.3 (0.9, 12.9) |
Source: IPCC (2023)
2.10.2 Climate division annual temperature
Annual temperatures are significantly increasing for all climate divisions during at least one time period, with the Southeastern division experiencing the greatest and most consistent increases.
Northeastern climate division
Average annual temperatures increased 2.6ºF (1.4ºC) from 1900–2024 or 0.03ºF/decade (0.02ºC/decade; Table 2-8). Annual temperatures then increased more substantially in the mid- (0.4ºF/decade; 0.2ºC/decade) and near-terms (0.9ºF/decade; 0.5ºC/decade). Additionally, the most recent half-decade represented the highest annual average temperature on record (44.3ºF/6.8ºC), over 2.0ºF (1.1ºC) warmer than the long-term average (42.3ºF/5.7ºC; Figure 2-29). Similar temperatures were found in the 1930s and 1940s before many high-elevation stations were added and subsequently cooled the division’s average.
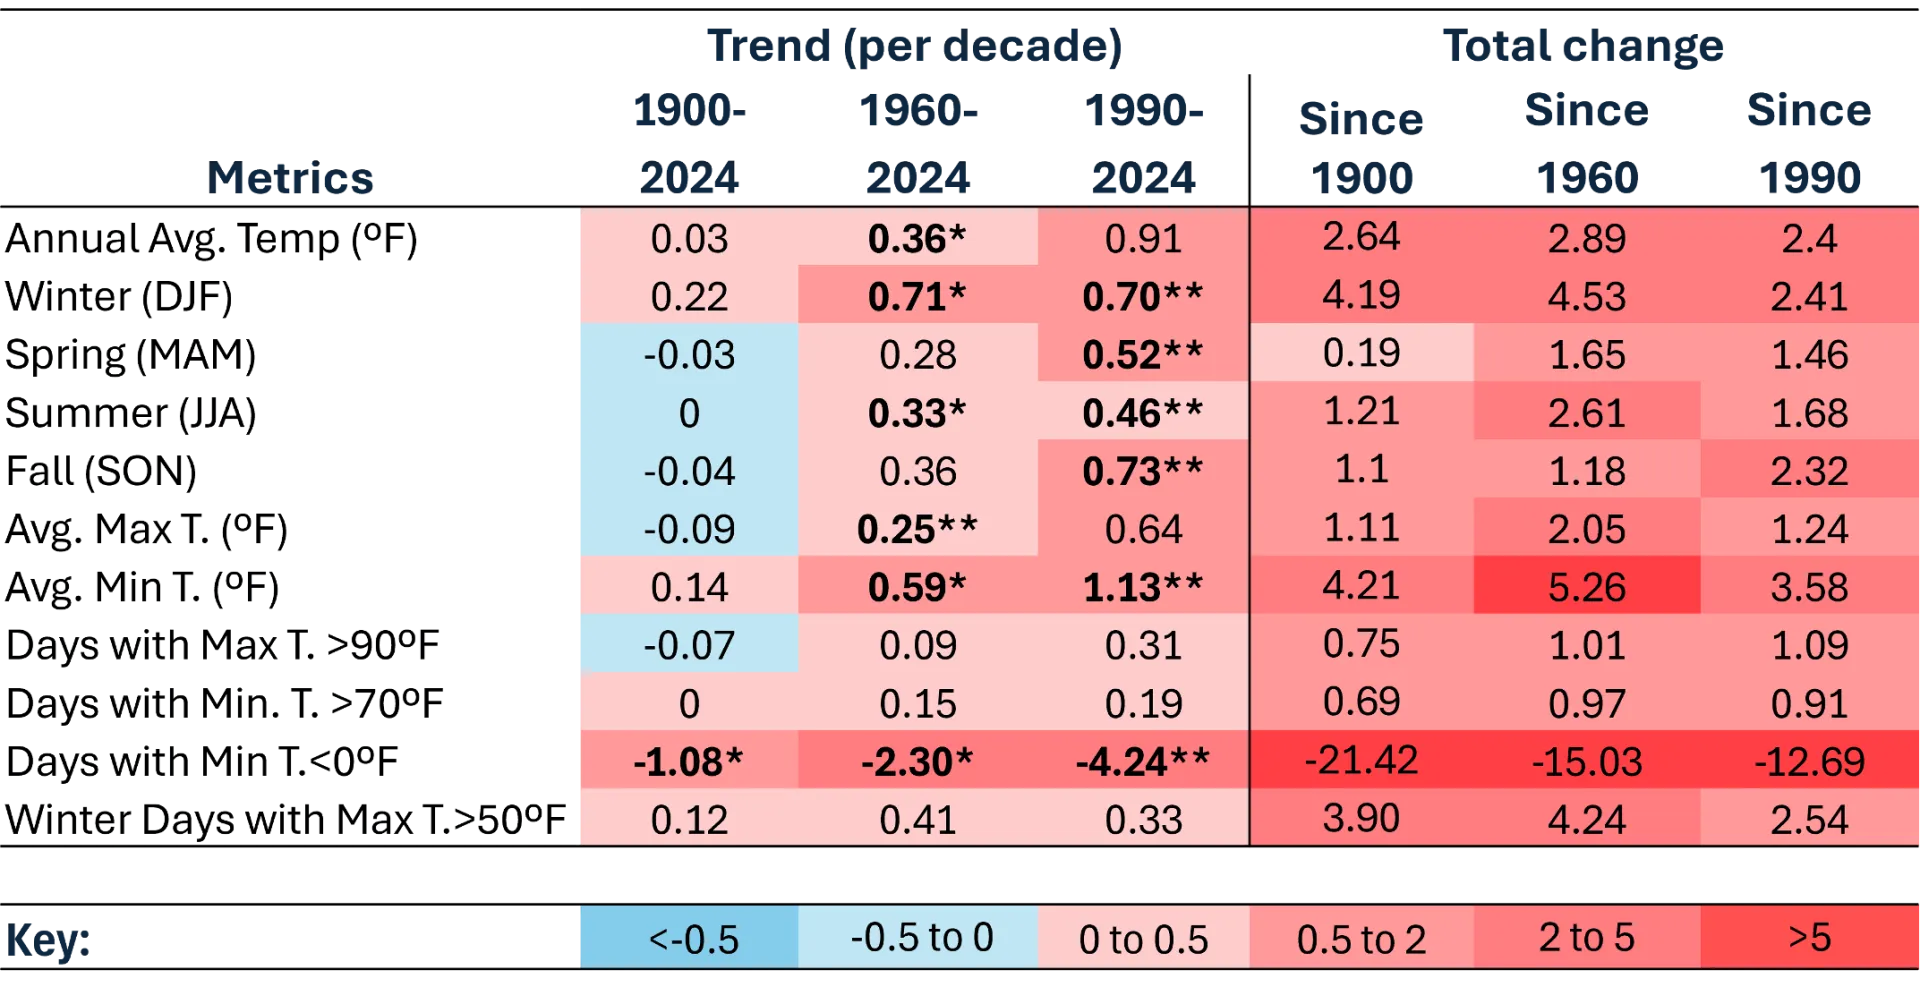
Source: NOAA Regional Climate Centers (2026)
Note: *=statistically significant at 95% confidence interval; **=statistically significant at 90% confidence interval, colors are inverted for Days with Min T. 0 ºF (cold days) to highlight warming trend.
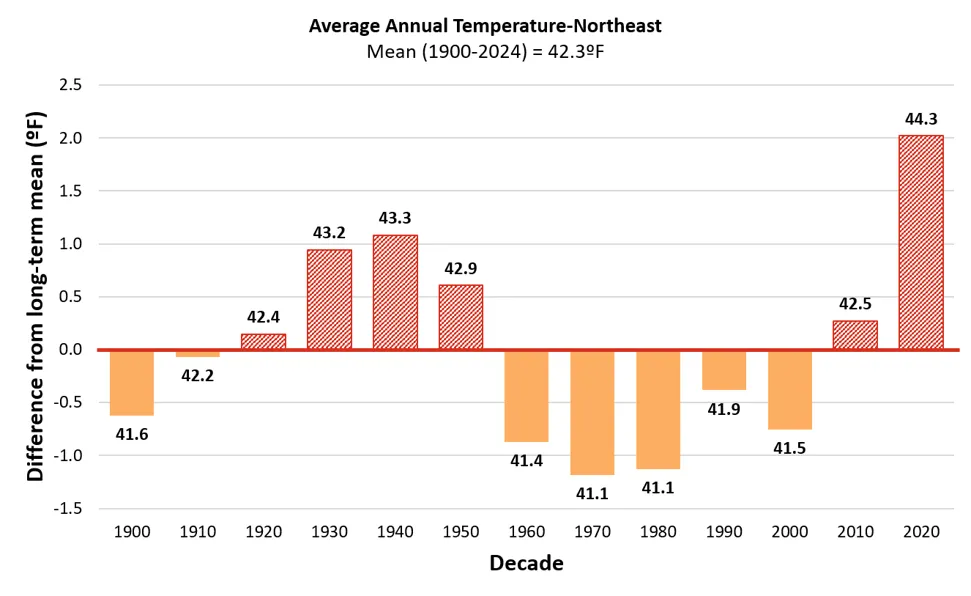
Source: NOAA Regional Climate Centers (2026)
Note: Long-term average annual temperature is indicated by the horizontal axis (y=0), equaling 42.3ºF. Decades above the long-term average are red and striped, while decades below are orange and solid. Data labels above each bar indicate the decade’s average value, bar heights reflect precise underlying values; labels are rounded to one decimal place
Average annual minimum and maximum temperatures are also increasing particularly in the mid- and near-terms, with minimum temperatures increasing more than twice as fast as maximum temperatures. Minimum temperatures increased 0.6ºF/decade (0.3ºC/decade) since 1960 before almost doubling to 1.1ºF/decade (0.6ºC/decade) since 1990. Maximum temperatures increased 0.2ºF/decade (0.1ºC/decade) since 1960 before more than doubling to 0.6ºF/decade (0.3ºC/decade) since 1990. The largest total change in minimum and maximum temperatures was from 1960–2024, when minimum temperatures rose 5.2°F (2.9ºC) and maximum temperatures rose 2.0°F (1.1ºC). Minimum average temperature increases are often driven by winter temperature increases, a trend that is consistent with the Northeastern division (see 2.10.3) as well as across the U.S.
Southeastern climate division
The Southeastern climate division experienced the most consistent signs of climate-change related warming, with significant increasing trends across all three time periods for most metrics (annual, seasonal, and extremes). As the flattest and most southern division of Vermont, these findings are somewhat expected, though more research is needed to confirm latitude and topography as the most important factors contributing to the temperature change. Annual temperatures increased 4.9ºF (2.7ºC) from 1900–2024, with the rate of change accelerating over time: +0.2ºF/decade (+0.1ºC/decade) in the long-term, +0.5ºF/decade (0.3ºC/decade) in the mid-term, and +0.9ºF/decade (+0.5ºC/decade) in the near-term (Table 2-9). Additionally, since 2000 all decade averages represented the highest annual average temperature on record, before being superseded by the following decade (Figure 2-30). The most recent half-decade represented the greatest average annual temperature on record of 47.2 ºF (8.4 ºC), over 3.0ºF (1.7ºC) warmer than the long-term average (44.0ºF; 6.7ºC).
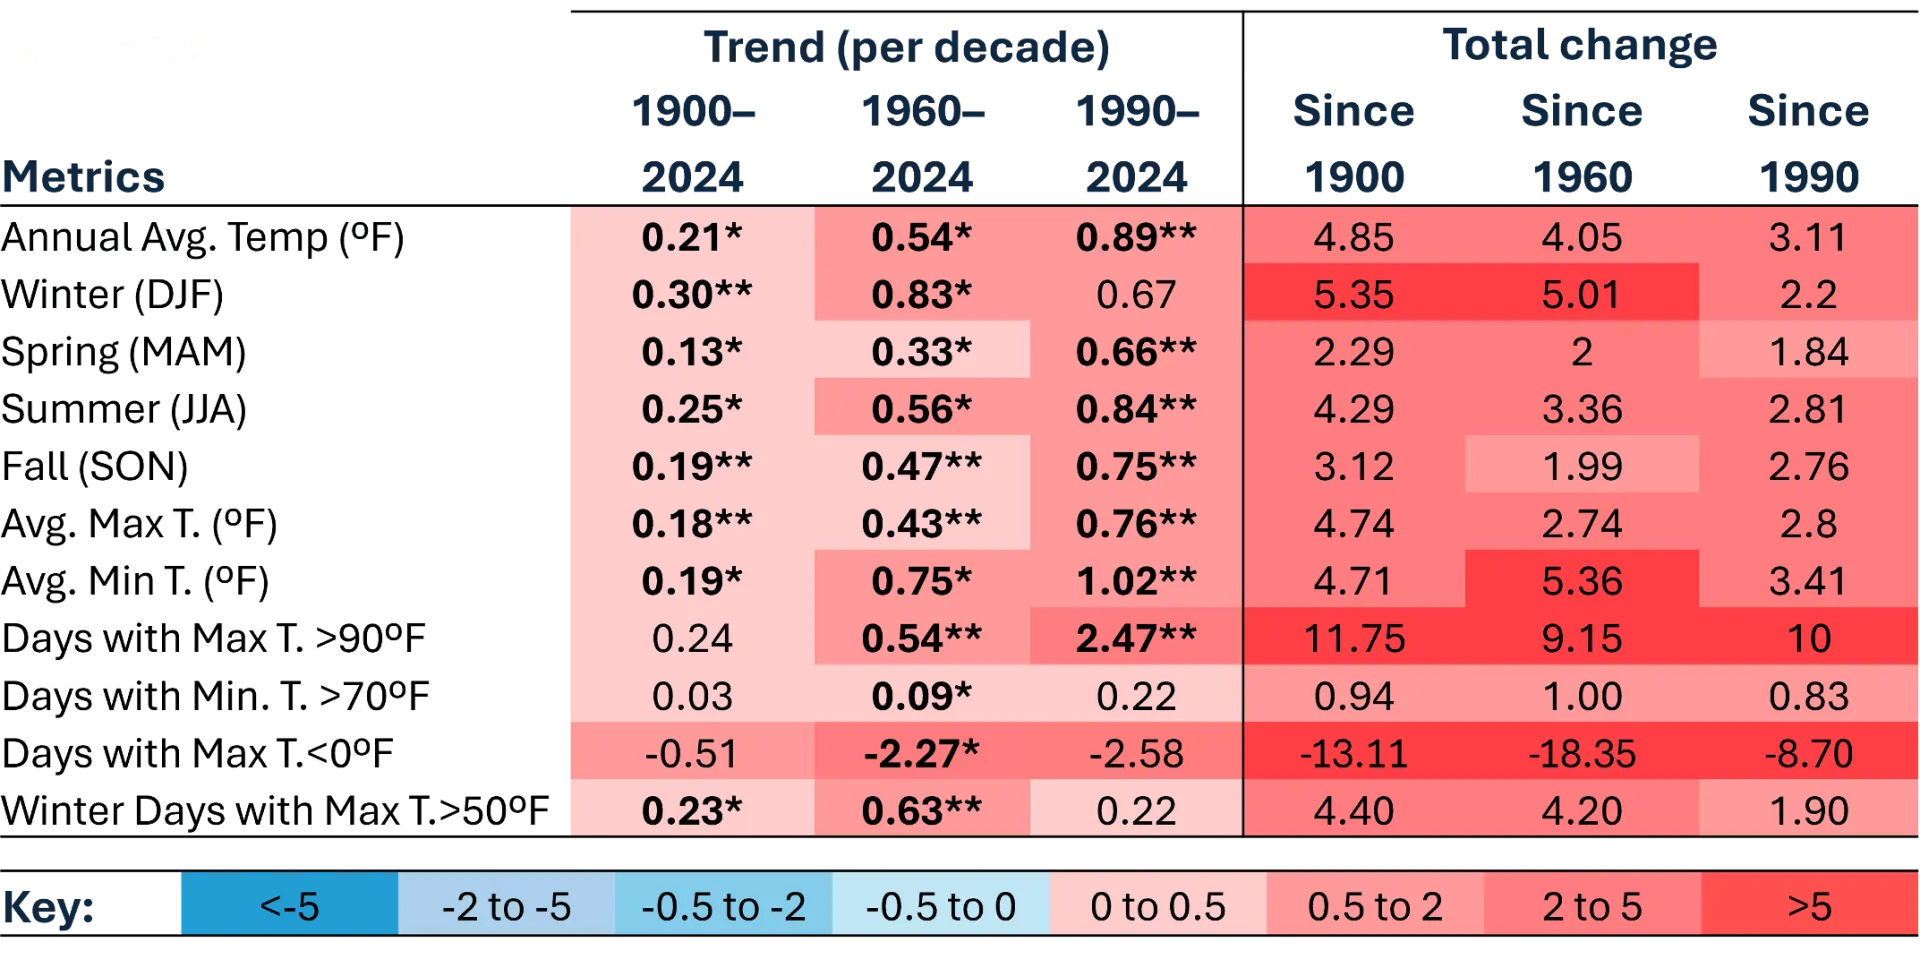
Source: NOAA Regional Climate Centers (2026)
Note: *=statistically significant at 95% confidence interval; **=statistically significant at 90% confidence interval, colors are inverted for Days with Min T. 0 ºF (cold days) to highlight warming trend.
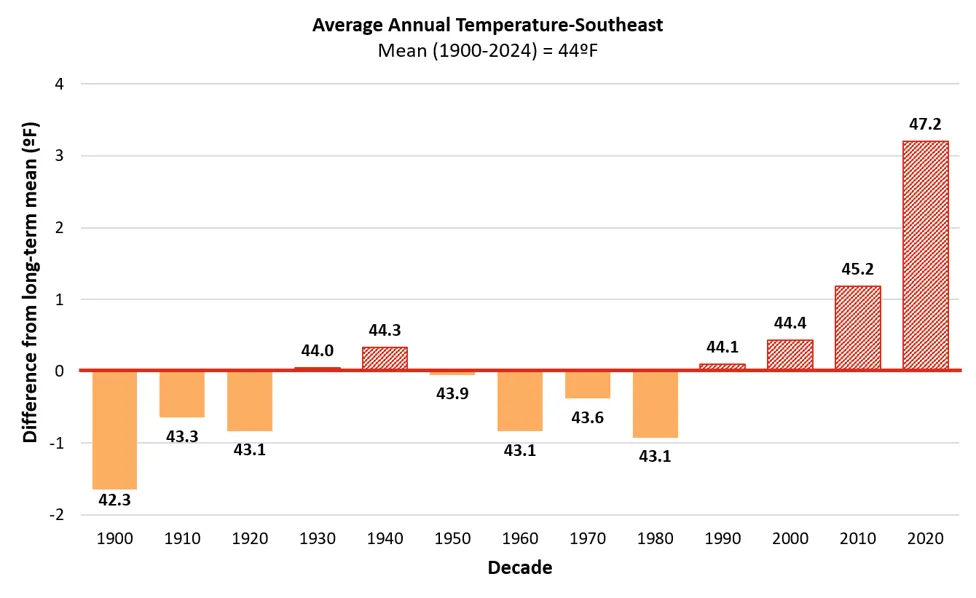
Source: NOAA Regional Climate Centers (2026)
Note: Long-term average annual temperature is indicated by the horizontal axis (y=0), equaling 44.0ºF. Decades above the long-term average are red and striped, while decades below are orange and solid. Data labels above each bar indicate the decade’s average value, bar heights reflect precise underlying values; labels are rounded to one decimal place
Both minimum and maximum temperatures in the Southeastern division have increased a total of 4.7ºF (2.6ºC) since 1900, though minimum temperatures are increasing faster than maximum temperatures through time: minimum temperatures increased +0.2ºF/decade (+0.1ºC/decade) in the long-term, +0.8ºF/decade (0.4ºC/decade) in the mid-term, and +1.0ºF/decade (+0.6ºC/decade) in the near-term (Table 2-9). Maximum temperatures increased +0.2ºF/decade (+0.1ºC/decade) in the long-term, +0.4ºF/decade (0.2ºC/decade) in the mid-term, and +0.8ºF/decade (+0.4ºC/decade) in the near-term. Strong trends in temperature extremes align with the region’s stark increase in very hot summer days (see 2.10.4).
Western climate division
Western Vermont has warmed the least since 1900 (+0.8ºF; +0.4ºC) compared to all other divisions; however, it has the greatest seasonal shift with winter temperatures warming almost 20 times faster than summer temperatures (Table 2-10; see 2.10.3). The most recent half-decade was also the warmest on record in the division (46.5ºF; 8.0ºC), exceeding the long-term average of 45.7ºF (7.6ºC) by almost a full degree (0.8ºF (0.4ºC); Figure 2-31). Minimum temperatures increased significantly across all time periods with an acceleration through time: +0.1ºF/decade (+0.1ºC/decade) in the long-term, +0.3ºF/decade (0.2ºC/decade) in the mid-term, and +0.3ºF/decade (+0.2ºC/decade) in the near-term. Maximum temperatures did not significantly increase through time unlike trends observed statewide and in the Northeastern and Southeastern climate divisions.
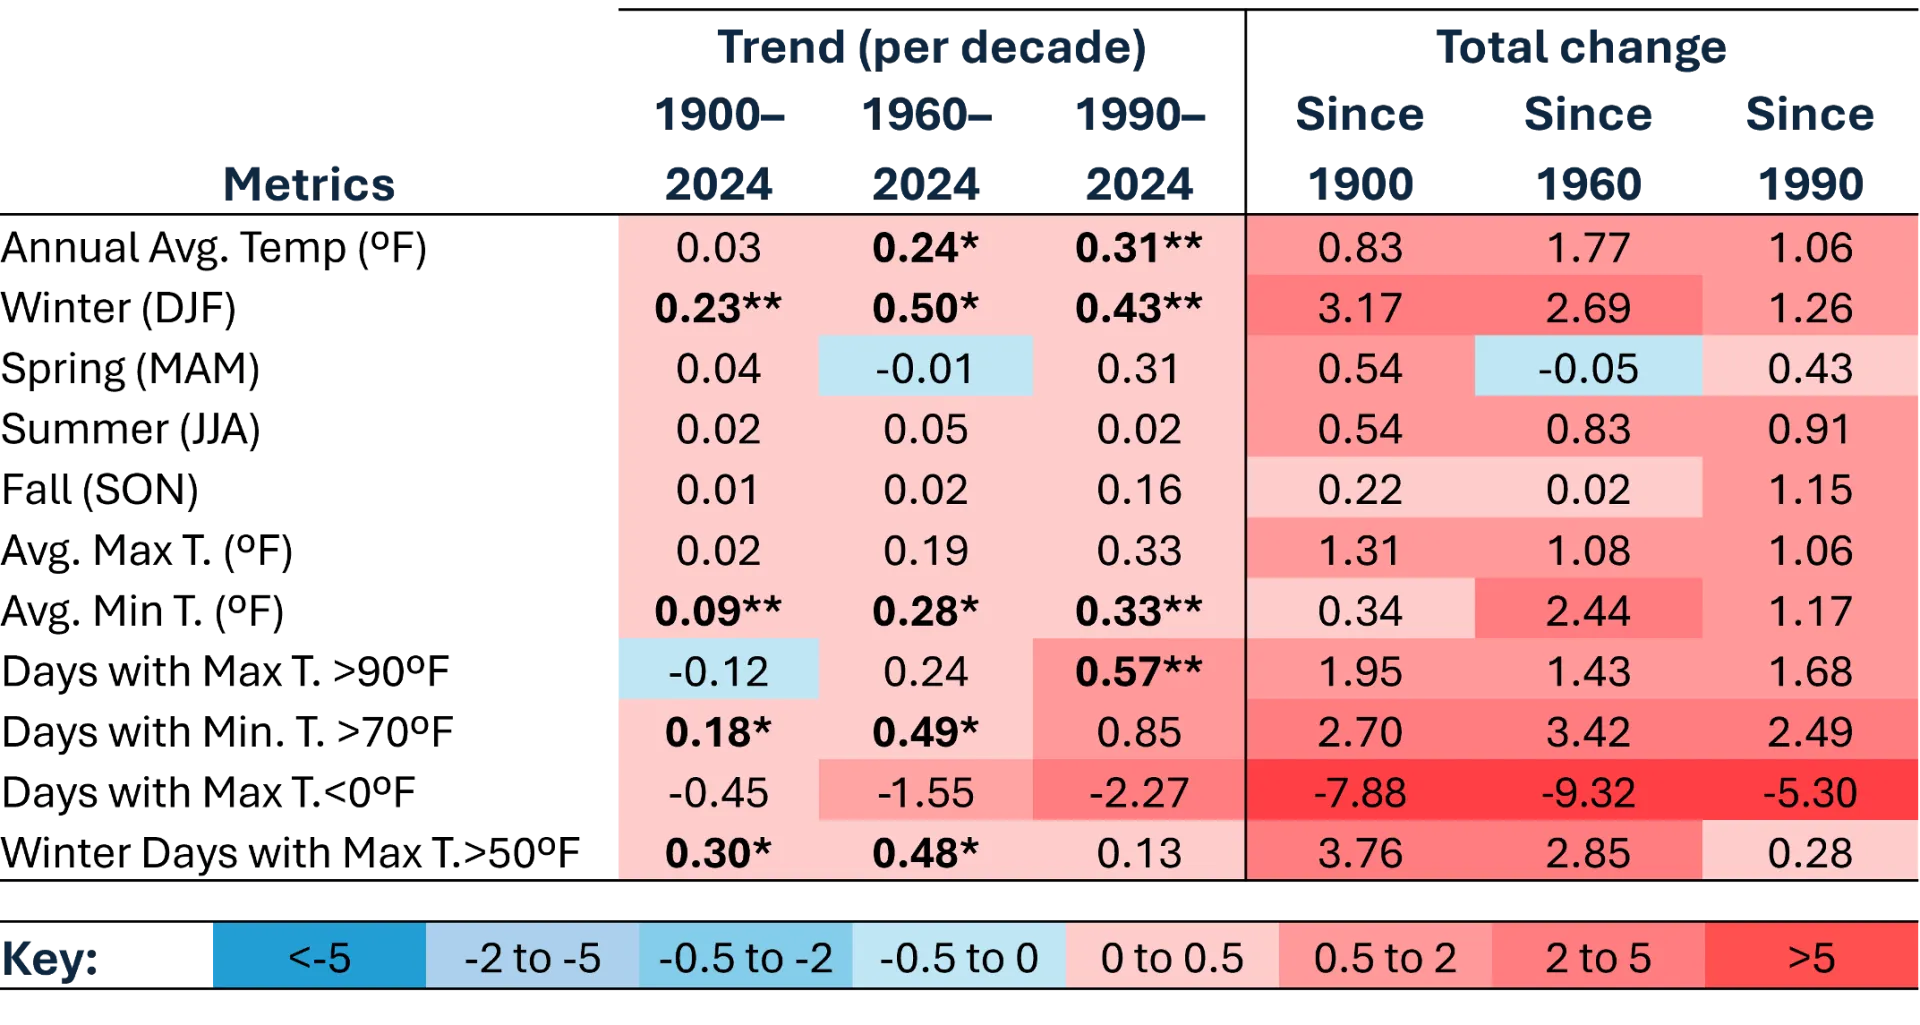
Source: NOAA Regional Climate Centers (2026)
Note: *=statistically significant at 95% confidence interval; **=statistically significant at 90% confidence interval, colors are inverted for Days with Min T. 0 ºF (cold days) to highlight warming trend.
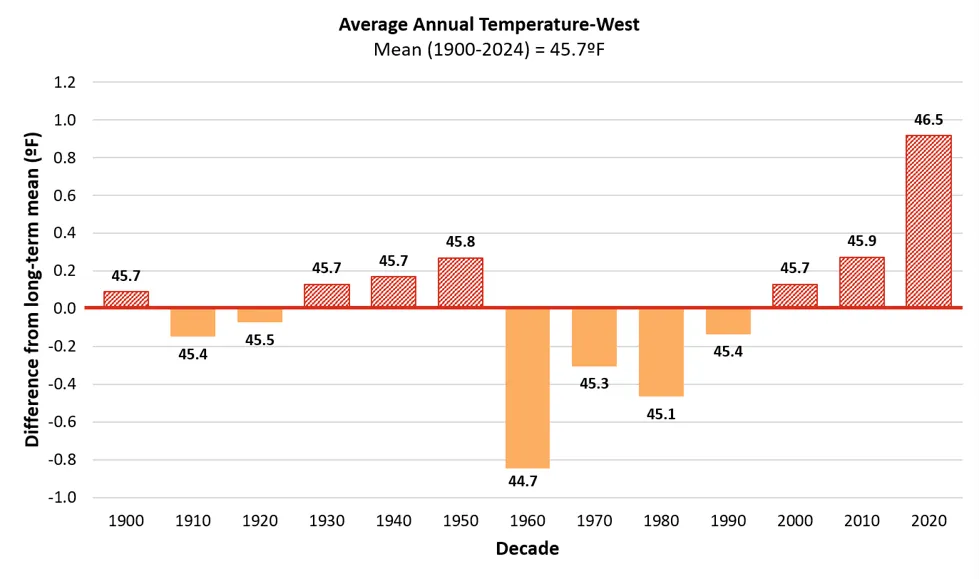
Source: NOAA Regional Climate Centers (2026)
Note: Long-term average annual temperature is indicated by the horizontal axis (y=0), equaling 45.7ºF. Decades above the long-term average are red and striped, while decades below are orange and solid. Data labels above each bar indicate the decade’s average value, bar heights reflect precise underlying values; labels are rounded to one decimal place
Factors impacting such divisional changes include the division’s proximity to Lake Champlain, urban development in the Greater Burlington Area, and its position between the Adirondack and Green Mountain Ranges. These geographic features channel airflow and promote atmospheric mixing, which creates faster wind speeds than the other divisions. These factors influence temperature, such as through less radiative cooling at night. Lake Champlain also causes a “lake effect,” which stabilizes weather by holding heat during the winter months as well as cooling the area in the summer along the coast; though the effect becomes less pronounced further inland (Kunkel, 2022). The resulting temperature stabilization is a unique aspect of the division and could impact the effects of climate change, though more research is needed.
2.10.3 Climate division winter temperature
Winter temperatures in the Northeastern division increased 4.2ºF (2.3ºC) from 1900–2024, with the rate of change tripling between the long- (+0.2ºF; +0.1ºC) and mid-terms (+0.7ºF; +0.4ºC) before stabilizing between the mid- and near-terms (+0.7ºF; +0.4ºC; Table 2-8). Of the long-term increase in winter temperature, over 80% of the change came in the mid-term. The most recent half-decade represented the greatest average annual temperature on record of 20.1ºF (-6.6ºC), 2.4ºF (1.3ºC) warmer than the long-term average (17.7ºF; -7.9ºC; Figure 2-32). The Northeastern division’s winter temperatures warmed at a faster rate than other divisions in Vermont since 1990; this rapid warming is likely representative of the expedited warming of high elevation regions in recent time periods (see 2.4.3).
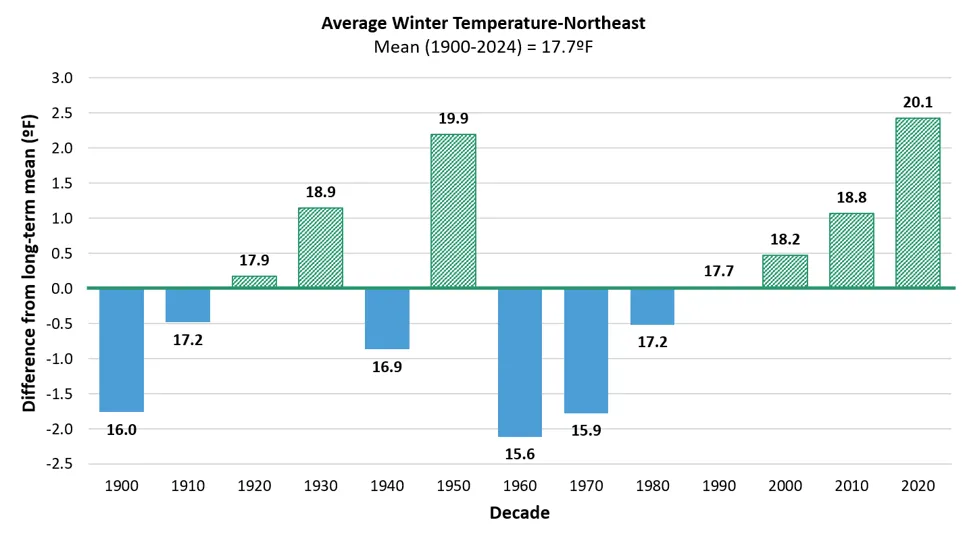
Source: NOAA Regional Climate Centers (2026)
Note: Long-term average winter temperature is indicated by the horizontal axis (y=0), equaling 17.7ºF. Decades above the long-term average green and striped, while decades below are blue and solid. Data labels above each bar indicate the decade’s average value, bar heights reflect precise underlying values; labels are rounded to one decimal place
Extremely cold days (i.e., days when the minimum temperature does not exceed 0°F; -18°C) significantly decreased across all time periods while warm winter days (i.e., days when the maximum temperature exceeds 50°F; 10°C) significantly increased in the long-term (Table 2-8). Vermonters in the Northeastern division now experience 21 less extremely cold days per year and almost four more warm days per year compared to 1900 (Figure 2-33). The average number of cold days has been lower than the long-term average since 2000, while the average number of warm days has been higher than the long-term average since 1980. In the most recent half decade (2020–2024), there were only 13.3 cold days per year compared to 34.7 cold days per year (1900–1910); similarly, in the most recent half decade (2020–2024), there were almost six warm days per year compared to two warm days per year (1900–1910). Trends in annual and extreme temperatures suggest that winter in the Northeastern division is drastically different for today’s Vermonters compared to previous generations.
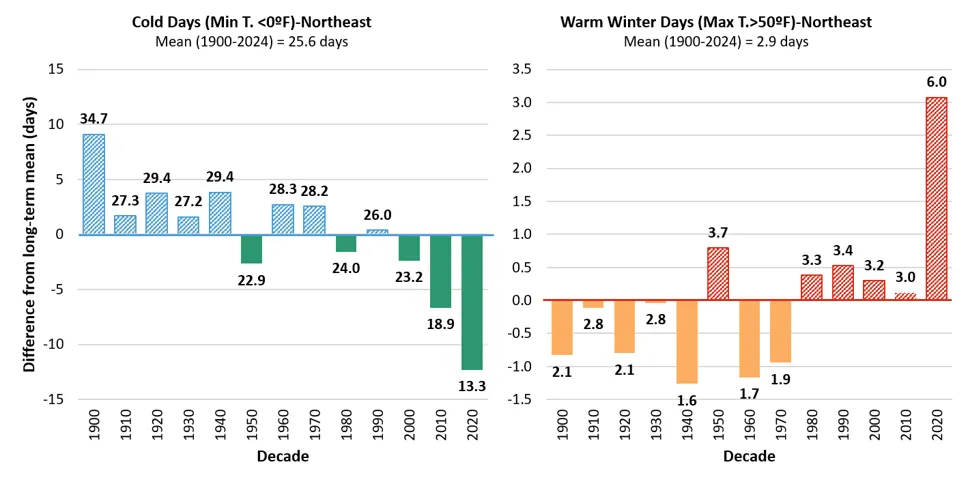
Source: NOAA Regional Climate Centers (2026)
Note: Long-term average is indicated by the horizontal axis (y=0), this axis represents an average of 25.6 days/year for very cold days, while for warm winter days this axis represents an average of 2.9 days/year. Decades above the long-term average are striped, while decades below are solid. Data labels above each bar indicate the decade’s average value, bar heights reflect precise underlying values; labels are rounded to one decimal place
Southeastern climate division
The Southeastern division had the greatest increase in winter temperatures in the long- and mid-term, although near-term trends are less clear (Table 2-9). Long-term, winter temperatures increased 0.3ºF/decade (0.2ºC/decade), representing a total increase of 5.4ºF (3.0ºC) since 1900. The pace of increase accelerated in the mid-term, reaching an average of 0.8ºF/decade (0.4ºC/decade) with a total change of 5.0ºF (2.8ºC), which is over 90% of the total change observed since 1900. Most temperature increases in the long-term therefore actually occurred after 1960. In the near-term, winter temperatures continued to increase with all decadal averages greater than the long-term average of 20.3ºF (-6.5ºC) since 1990 (Figure 2-34).
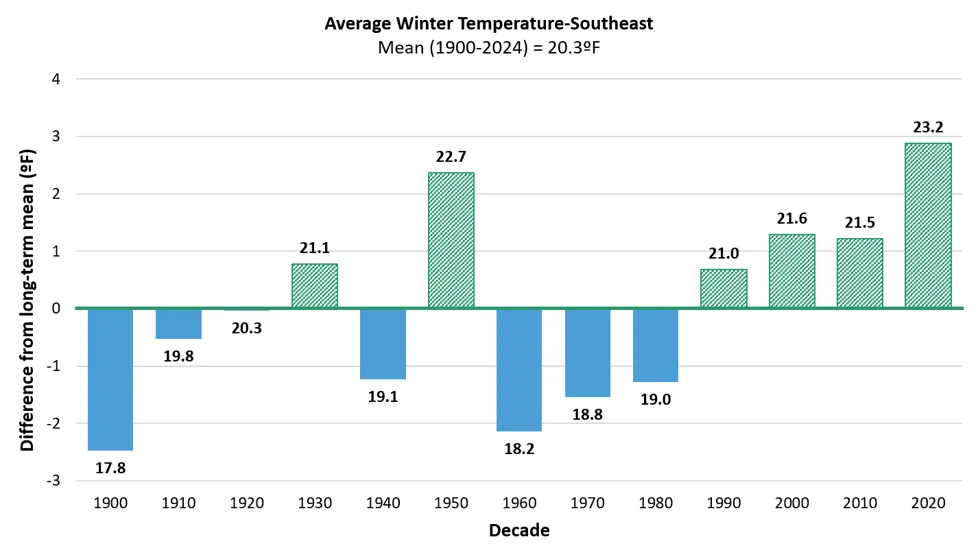
Source: NOAA Regional Climate Centers (2026)
Note: Long-term average winter temperature is indicated by the horizontal axis (y=0), equaling 20.3ºF (-6.5ºC). Decades above the long-term average are green and striped, while decades below are blue and solid. Data labels above each bar indicate the decade’s average value, bar heights reflect precise underlying values; labels are rounded to one decimal place
Extremely cold days (i.e., days when the minimum temperature does not exceed 0°F; -18°C) significantly decreased in the mid-term, while warm winter days (i.e., days when the maximum temperature exceeds 50°F; 10°C) significantly increased in the long- and mid-terms (Table 2-8). Vermonters in the Southeastern division now experience 18 less extremely cold days per year since 1960 and 4.4 more warm days per year since 1900. The average number of cold days has been lower than the long-term average since 1990, while the average number of warm days has been higher than the long-term average since 1980 (Figure 2-35).
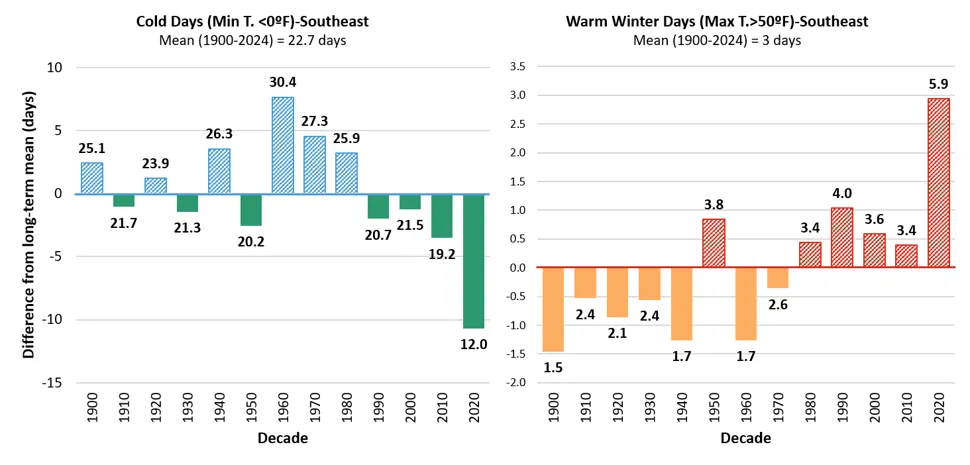
Source: NOAA Regional Climate Centers (2026)
Note: Long-term average is indicated by the horizontal axis (y=0), the axis represents an average of 22.7 days/year for very cold days, while for warm winter days this axis represents an average of 3 days/year. Decades above the long-term average are striped, while decades below are solid. Data labels above each bar indicate the decade’s average value, bar heights reflect precise underlying values; labels are rounded to one decimal place
The number of freeze-thaw days significantly decreased in the long-term at a rate of 2.4 days/decade (Figure 2-9). While trends are insignificant in the mid- and near-terms, freeze-thaw days are still less than the long-term average (40.2 days/year) every decade since 1950 (average of 31.0 days/year) excluding the most-recent half-decade (average of 49.6 days/year), which was well above the long-term average and all other recent decades. Since the Southeastern divisions’ minimum temperatures are increasing, there will likely be fewer days over time that reach the minimum freezing threshold for a freeze-thaw day to occur.
Western climate division
In the Western climate division, winter temperature changes are buffered by a combination of geographic variables including a lower elevation than the Northeastern division, greater distance to the Atlantic coast than the Southeastern division, and increased proximity to Lake Champlain. This resulted in a less extreme, but still significant, increase in winter temperatures over time, with the rate of change more than doubling between the long- (0.2ºF/decade; 0.1ºC/decade) and mid-terms (0.5ºF/decade; 0.3ºC/decade) before slightly decreasing between the mid- and near-terms (0.4ºF/decade; 0.2ºC/decade; Table 2-10). Since 1900, annual winter temperatures increased 3.2ºF (1.8 ºC) and decadal averages have been higher than the long-term average since 1990 (Figure 2-36).
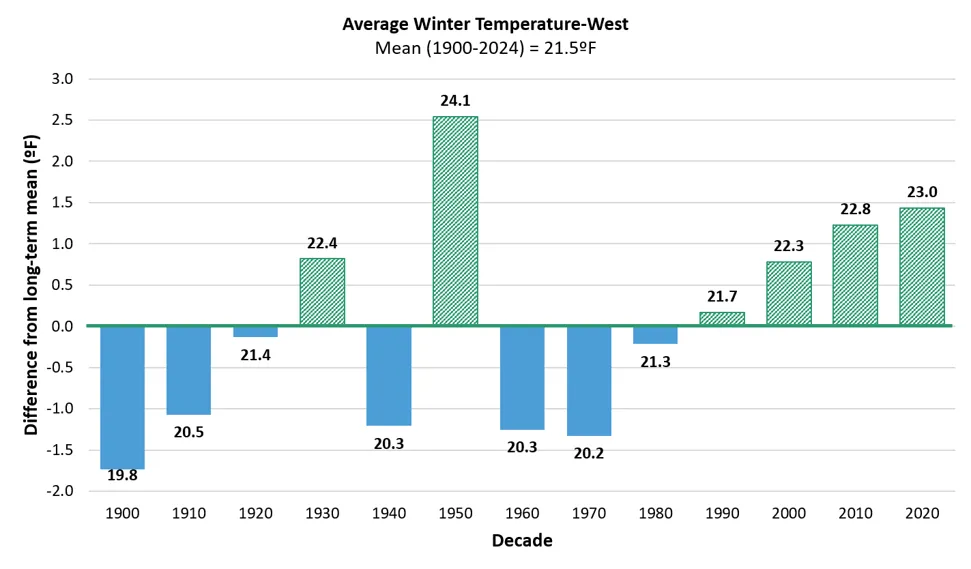
Source: NOAA Regional Climate Centers (2026)
Note: Long-term average winter temperature is indicated by the horizontal axis (y=0), equaling 21.5ºF. Decades above the long-term average are green and striped, while decades below are blue and solid. Data labels above each bar indicate the decade’s average value, bar heights reflect precise underlying values; labels are rounded to one decimal place
Similar to the Southeastern division, extremely cold days (i.e., days when the minimum temperature does not exceed 0°F; -18°C) significantly decreased in the mid-term, while warm winter days (i.e., days when the maximum temperature exceeds 50°F; 10°C) significantly increased in the long- and mid-terms (Table 2-10). Vermonters in the Western division now experience 9.3 less extremely cold days per year since 1960 and 3.8 more warm days per year since 1900. The average number of cold days has been lower than the long-term average since 1980; the average number of warm days has also been higher than the long-term average since 1980 (Figure 2-37).
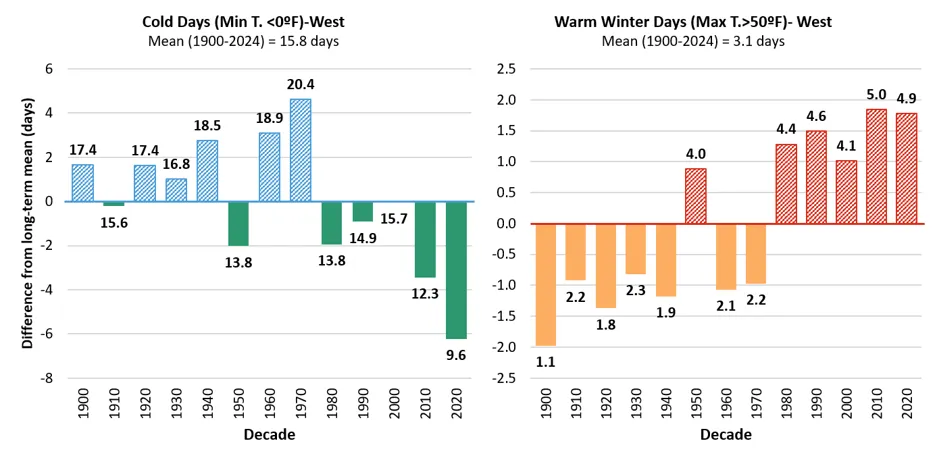
Source: NOAA Regional Climate Centers (2026)
Note: Long-term average is indicated by the horizontal axis (y=0), the axis represents an average of 15.8 days/year for very cold days, while for warm winter days this axis represents an average of 3.1 days/year. Decades above the long-term average are striped, while decades below are solid. Data labels above each bar indicate the decade’s average value, bar heights reflect precise underlying values; labels are rounded to one decimal place
The number of freeze-thaw days significantly increased across all three time periods in the Western division, with the rate of increase accelerating over time: 2.6 days/decade in the long-term, 3.2 days/decade in the mid-term, and 8.4 days/decade in the near-term (Figure 2-9). Every decade since 1980 has been higher than the long-term average (43.3 days/year), with the most recent half-decade almost doubling the long-term average at 81.5 days/year. This region has warmed the least of all three climate divisions, but as winter temperatures continue to warm, the number of freeze-thaw days is likely to taper and then decline as fewer minimum temperatures fall below a hard freeze.
2.10.4 Climate division summer temperature
Summers are warming less rapidly than winters, but average summer temperatures have still significantly increased in the Northeastern (mid- and near-terms) and Southeastern climate divisions (all time periods). Further, the freeze-free period, which consistently overlaps the summer season, has significantly increased across all climate divisions and most time periods. Hot days increased in the Southeastern (mid- and near-terms) and Western (near-term) divisions; warm summer nights increased in the Southeastern (mid-term) and Western (long- and mid-terms) divisions.
Northeastern climate division
The Northeastern division had the greatest increase in summer temperatures in the mid- and near-terms, with summer warming accelerating over time (Table 2-8). Since 1960, summer temperatures increased 2.6ºF (1.4ºC) or 0.3ºF/decade (0.2ºC/decade), before accelerating to 0.5ºF/decade (0.3ºC/decade) in the near-term. The Northeastern division’s freeze-free period has lengthened by 20.5 days or 17% since 1900 (Figure 2-38). All decadal averages have been higher than the long-term average since 1970, but the greatest rate of change occurred since 1990 with an increase of 4.3 days/decade, compared to 2.9 days/decade since 1960, and 1.8 days since 1900. The most recent half-decade experienced a freeze-free period that was almost 2.5 weeks (16.7 days) longer than the division’s long-term average, increasing from 124.7 days/year to 141.4 days/year.
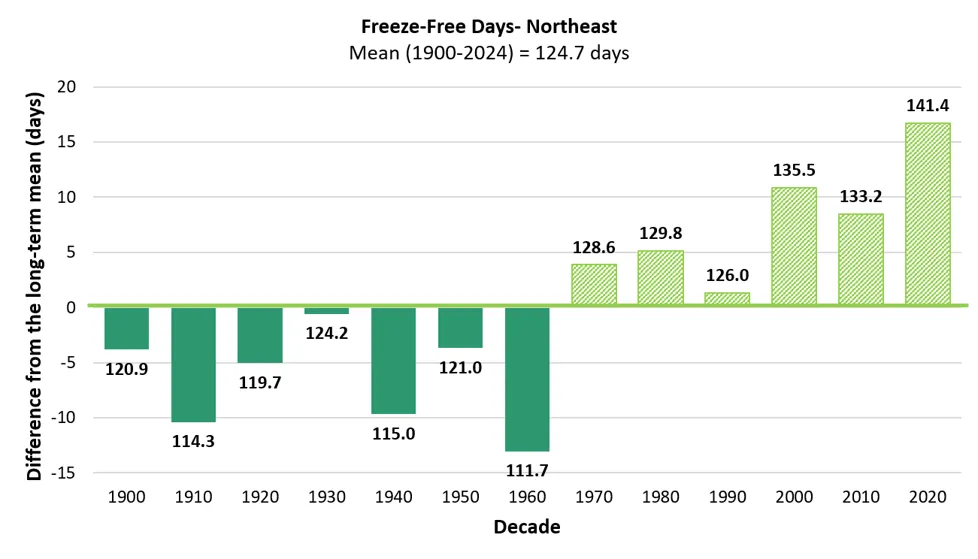
Source: NOAA Regional Climate Centers (2026)
Note: Long-term average freeze-free length is indicated by the horizontal axis (y=0), equaling 124.7 days/year. Decades below the long-term average are dark green, while decades above are light green. Data labels above each bar indicate the decade’s average value, bar heights reflect precise underlying values; labels are rounded to one decimal place
Neither hot days (i.e., days when the maximum temperature exceeds 90°F; 32°C) nor warm summer nights (i.e., days when the minimum temperature exceeds 70°F; 21°C) significantly increased in the long-term (Table 2-8). The number of extremely hot days has not exceeded the long-term average (4.5 days/year) since 1950 (Figure 2-39), before many of the high-elevation stations came online. However, warm summer nights exceeded the long-term average (0.6 days/year) in 2000 and 2020, with the most recent half decade (2020–2024) doubling the long-term average with1.2 days/year.
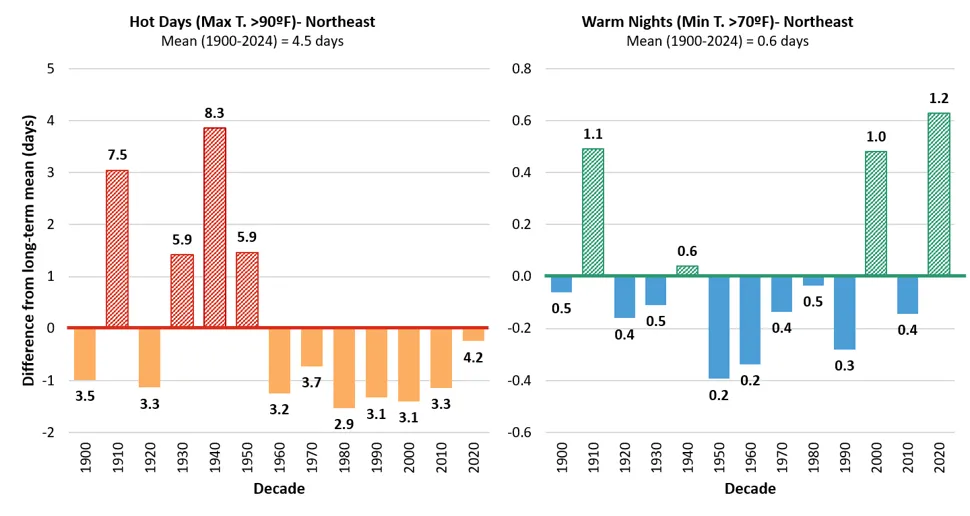
Source: NOAA Regional Climate Centers (2026)
Note: Long-term average is indicated by the horizontal axis (y=0), for hot days this axis represents an average of 4.5 days/year, while the axis represents an average of 0.6 days/year for very cold days. Decades above the long-term average are striped, while decades below are solid. Data labels above each bar indicate the decade’s average value, bar heights reflect precise underlying values; labels are rounded to one decimal place
Southeastern climate division
Annual summer temperatures significantly increased across all time periods, with warming accelerated over time: 0.2ºF/decade (0.1ºC/decade) in the long-term, 0.6ºF/decade (0.3ºC/decade) in the mid-term, and 0.8ºF/decade (0.4ºC/decade) in the long-term (Table 2-9). Since 1900, annual summer temperatures have increased 4.3 degrees from 64.3ºF (17.9ºC) to 68.6ºF (20.3ºC). The Southeastern division’s freeze-free period has lengthened by over a full month (35.4 days) or 30% since 1900 (Figure 2-40). The Southeastern division also experienced the greatest rate of change in all three time periods, increasing 2.6 days/decade since 1900, 9.0 days/decade since 1960, and 9.5 days/decade since 1990. The most recent 3.5 decades (1990–2024) were also all found to have freeze-free periods longer than the long-term average of 117.9 days within this division.
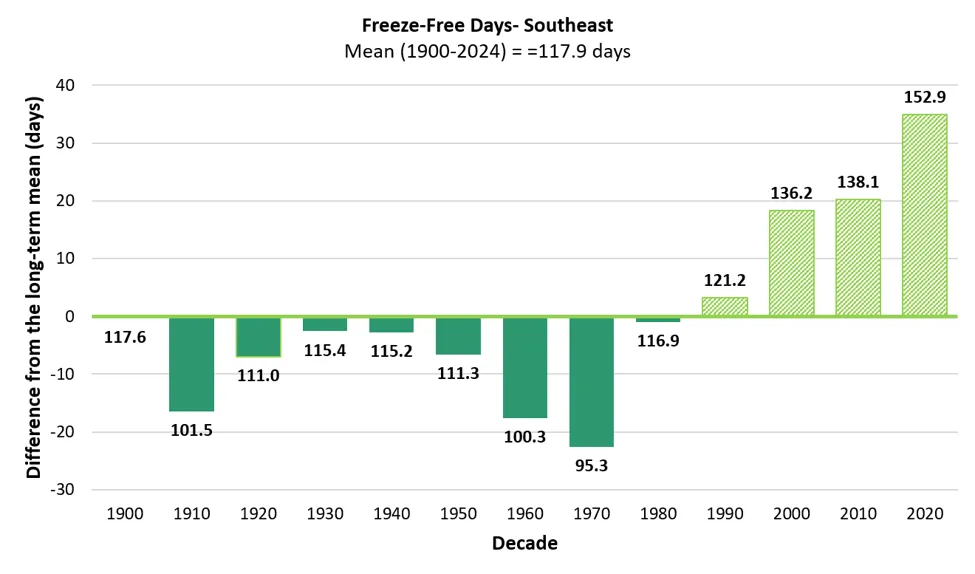
Source: NOAA Regional Climate Centers (2026)
Note: Long-term average freeze-free length is indicated by the horizontal axis (y=0), equaling 117.9 days/year. Decades above the long-term average are striped, while decades below are solid. Data labels above each bar indicate the decade’s average value, bar heights reflect precise underlying values; labels are rounded to one decimal place
The Southeastern division is the only division with significantly increasing trends in hot days (i.e., days when the maximum temperature exceeds 90°F; 32°C) in the mid- and near-terms, with trends accelerating since 1960: hot days increased 0.54 days/decade in the mid-term but 2.47 days/decade in the near-term, an over 4.5-fold increase. The total increase in hot days since 1900 is 11.8 days. This change is largely driven by the disproportionate number of hot days annually within the last half decade with all five years having more than the long-term mean number of days, and four of those years having more than double this average. Warm nights (i.e., days when the minimum temperature exceeds 70°F; 21°C) also significantly increased in the mid-term but only modestly (0.09 nights/decade). The number of warm nights surpassed the long-term average (0.3 nights/year) for the last 2.5 decades (2000–2024). The Southeastern division has the least geographical buffer from weather extremes, likely making this area more susceptible to summer temperature extremes.
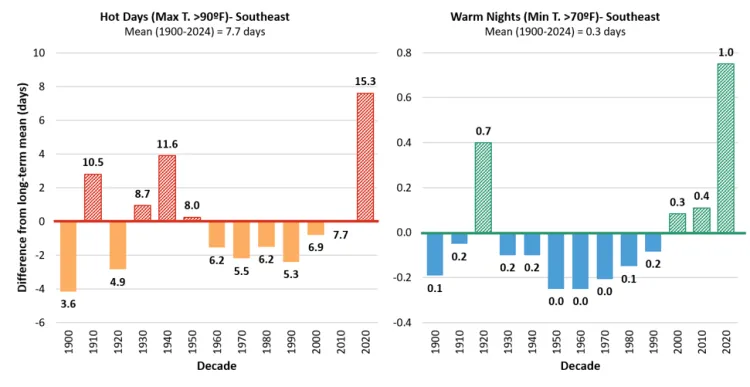
Source: NOAA Regional Climate Centers (2026)
Note: Long-term average is indicated by the horizontal axis (y=0), for hot days this axis represents an average of 7.7 days/year, while the axis represents an average of 0.3 days/year for very cold days. Data labels above each bar indicate the decade’s average value, bar heights reflect precise underlying values; labels are rounded to one decimal place
Western climate division
Annual summer temperatures did not significantly increase in the Western division (Table 2-10); however, the freeze-free period did significantly increase in the long-term by 21.1 days (1.96 days/decade; Figure 2-42). This division had the greatest variability in freeze-free period lengthening with decadal averages fluctuating regularly above and below the long-term average of 141.2 days since 1900.
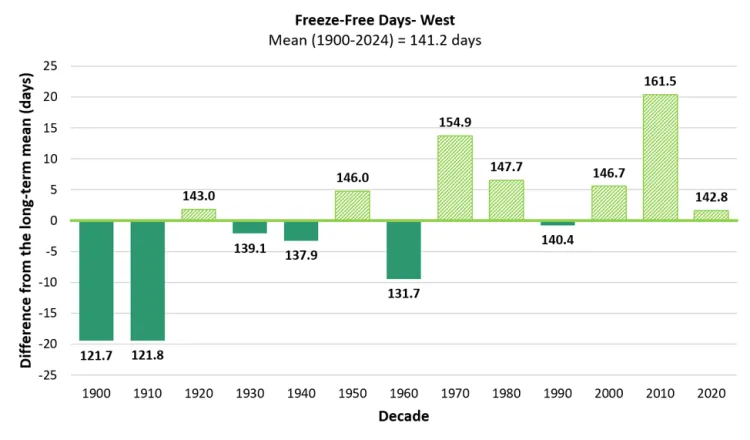
Source: NOAA Regional Climate Centers (2026)
Note: Long-term average freeze-free length is indicated by the horizontal axis (y=0), equaling 141.2 days/year. Decades above the long-term average are striped, while decades below are solid. Data labels above each bar indicate the decade’s average value, bar heights reflect precise underlying values; labels are rounded to one decimal place
The number of extremely hot days (i.e., days when the maximum temperature exceeds 90°F; 32°C) has not exceeded the long-term average of 6.2 days since 1950 (Figure 2-43); however, the number of hot days has been getting closer to the long-term average with each passing decade, reaching it in the most recent half-decade (2020–2024). This aligns with the significantly increasing trend in hot days in the near-term (0.6 days/decade) and indicates that this division is likely to experience more hot days in the future.
Further, the Western division has the strongest increasing trends in warm nights (i.e., days when the maximum temperature exceeds 90°F; 32°C) in the mid- and near-terms. Warm nights have increased by 3.4 nights/year since 1960 and the rate of increase has accelerated from 0.5 nights/decade in the mid-term to 0.8 nights/decade in the near-term. While the decadal average from 1990–1999 (1.5 nights/year) fell slightly below the long-term average of 1.9 nights/year, it is the only decade within the last 55 years that has done so. Furthermore, the most recent half-decade average (4.1 nights/year) is more than double the long-term average. In this period, Burlington’s NWS office also reported the first day maintaining a minimum average temperature of 80ºF (27ºC) since 1882 (Frechette, 2024). This trend is especially pertinent to community development, as Burlington, the most populous Vermont city is within this division.
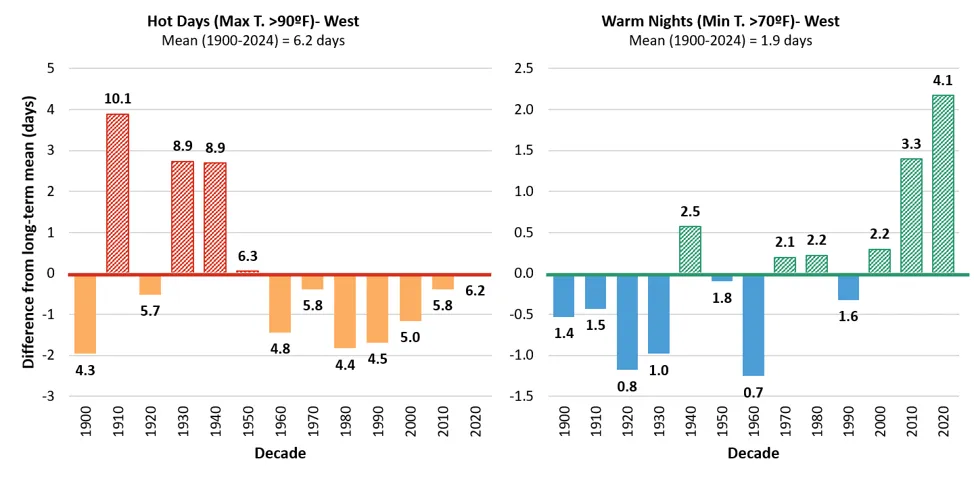
Source: NOAA Regional Climate Centers (2026)
Note: Long-term average is indicated by the horizontal axis (y=0), for hot days this axis represents an average of 6.2 days/year, while the axis represents an average of 1.9 days/year for warm nights. Decades above the long-term average are striped, while decades below are solid. Data labels above each bar indicate the decade’s average value, bar heights reflect precise underlying values; labels are rounded to one decimal place
2.10.5 Climate division spring and fall temperatures
Spring temperatures increased significantly in the Northeastern division in the near-term (0.5ºF/decade; 0.3ºC/decade) only and not at all in the Western division. However, spring temperatures increased significantly in the Southeastern division across all three time periods with accelerated warming over time. Spring temperatures increased 0.1ºF/decade (0.1ºC/decade) in the long-term before tripling to 0.3ºF/decade (0.2ºC/decade) in the mid-term and then doubling to 0.7ºF/decade (0.4ºC/decade) in the near-term. In total, spring temperatures increased 2.3ºF (1.3ºC) since 1900.
Fall temperatures followed the same pattern: increased in the Northeastern division in the near-term (0.7ºF/decade; 0.4ºC/decade) only, not at all in the Western division, and across all three time periods in the Southeastern division with accelerated warming over time. Fall temperatures increased 0.2ºF/decade (0.1ºC/decade) in the long-term, 0.5ºF/decade (0.3ºC/decade) in the mid-term, and 0.8ºF/decade (0.4ºC/decade) in the near-term in the Southeastern division. In total, fall temperatures increased 3.1ºF (1.7ºC) since 1900 in this division.
2.10.6 Climate division annual precipitation
Precipitation trends vary across Vermont's three climate divisions. Annual total precipitation and heavy precipitation days (24 hours with more than 1 inch of precipitation) both significantly increased in the long-term in the Northeastern and Western divisions; annual precipitation significantly increased in both the long- and near-term in the Southeastern division, while heavy precipitation days did not significantly increase in any time period.
Northeastern Climate Division
The Northeastern division experienced the strongest increasing trend in both annual precipitation and heavy precipitation days in the long-term (Table 2-11). Annual precipitation significantly increased by 1.2 inches/decade (30.5 mm/decade) since 1900, for a total change of 23% (8.3 inches; 210.8 mm). Heavy precipitation days significantly increased by 0.37 days/decade since 1900, for a total change of 61% (3.3 days). Both annual precipitation and heavy precipitation days have been higher than their respective long-term averages since 1970 even though mid- and near-term trends were not significant (Figure 2-44). With the division's higher elevations and exposure to common storm tracks, approaching air is forced to rise over the terrain, usually contributing to frequent and intense precipitation through orographic uplift. Rising temperatures and correlative atmospheric water holding capacity are likely to also contribute to these increasing precipitation trends.
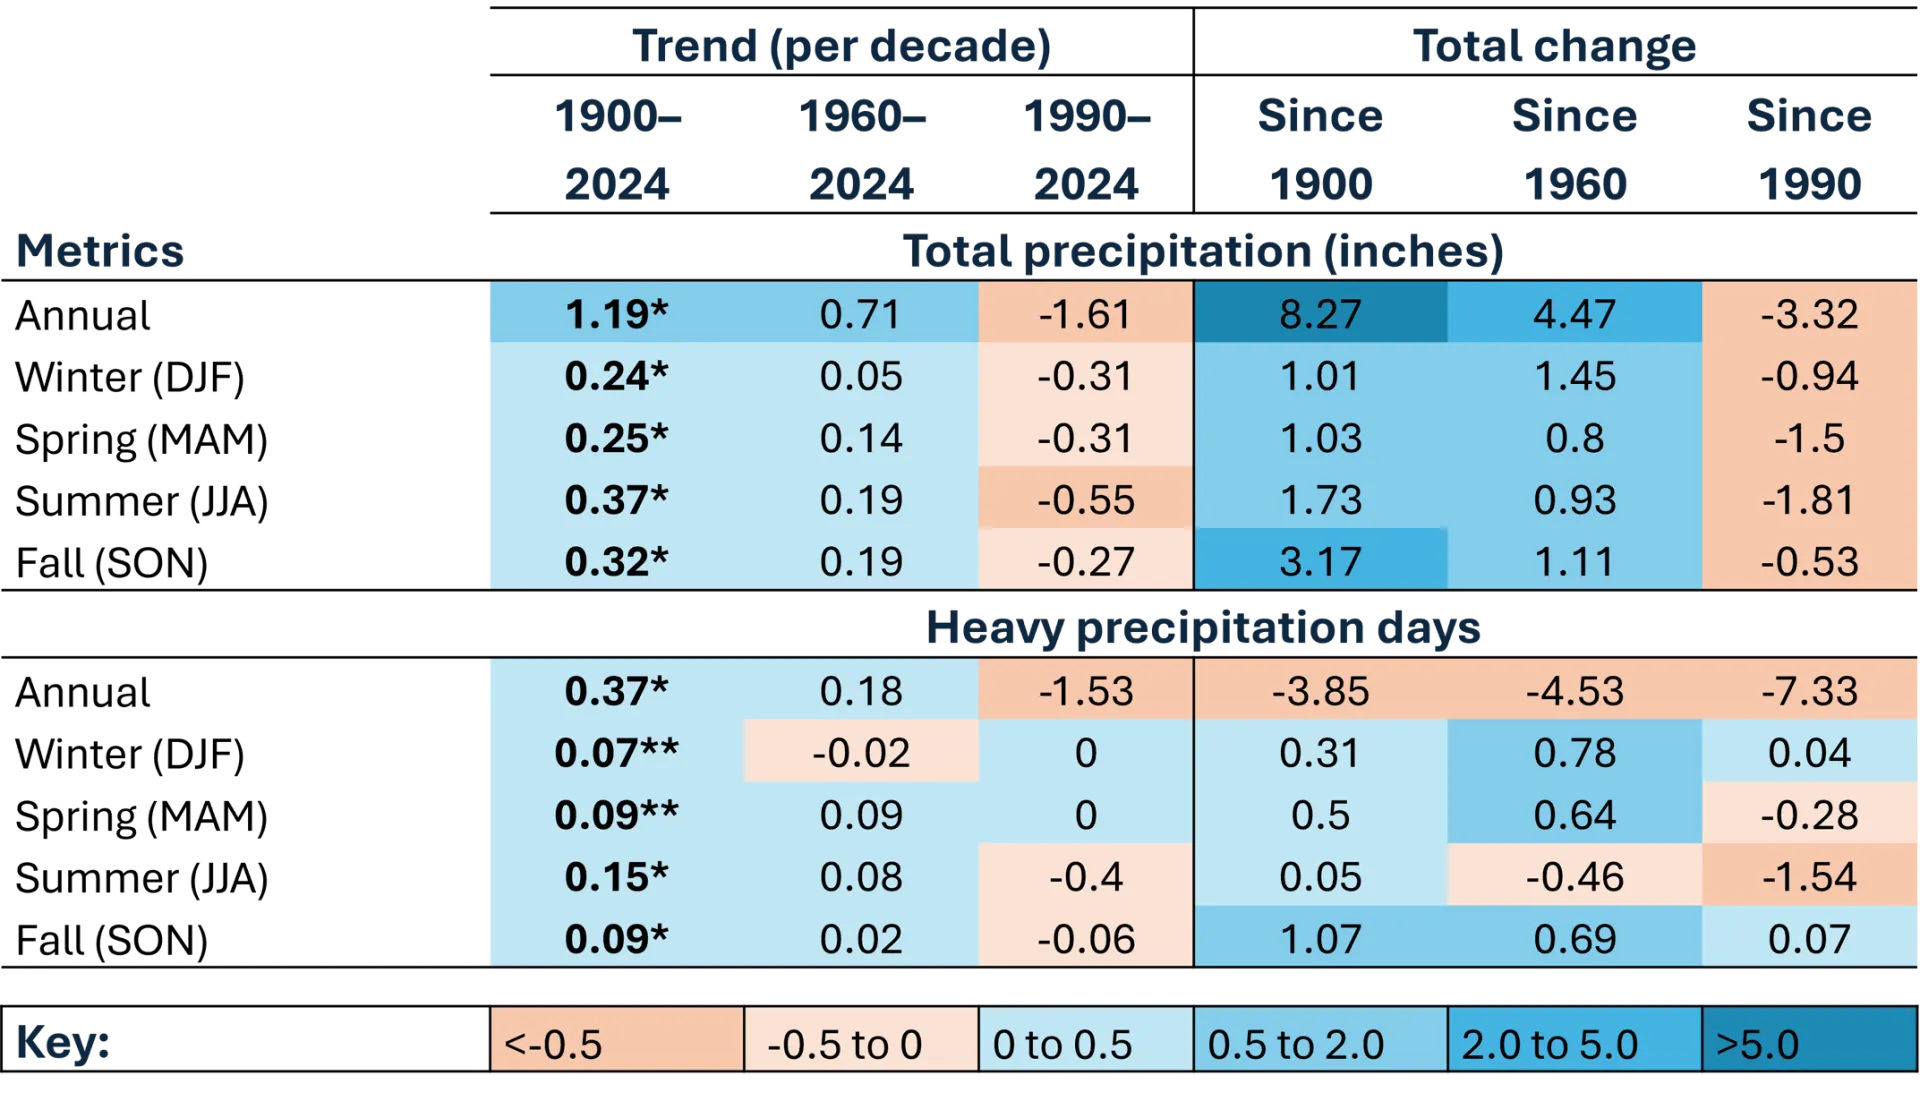
Source: NOAA Regional Climate Centers (2026)
Note: Precipitation trends per decade and total change annually and by season. Total precipitation in inches and days with heavy precipitation (defined as >1 inch or 25.4mm in 24 hours) are provided numerically, as well as color coordinated from highly negative values (dark orange) to highly positive values (dark blue). *=statistically significant at 95% confidence interval; **=statistically significant at 90% confidence interval
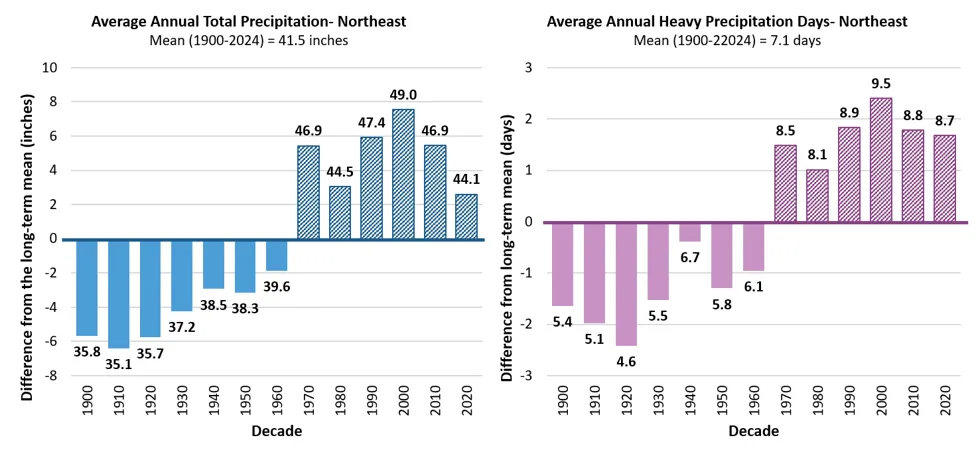
Source: NOAA Regional Climate Centers (2026)
Note: Long-term averages are indicated by the horizontal axis (y=0), equaling 41.5 inches/year (1,054 mm) of total annual precipitation, and 7.1 annual heavy precipitation days/year. Decades above the long-term average are striped, while decades below are solid. Data labels above each bar indicate the decade’s average value, bar heights reflect precise underlying values; labels are rounded to one decimal place
Southeastern Climate Division
The Southeastern division is the only division with both significantly increasing and decreasing trends in annual precipitation, reflecting what might be more common statewide: overall wetter conditions punctuated with precipitation extremes of heavy precipitation events and dry spells that create large variability year-to-year (see 2.5.1). In the long-term, annual precipitation increased 0.42 inches/decade (10.7 mm/decade); while in the near-term, annual precipitation decreased 0.64 inches/decade (16.3 mm/decade; Table 2-12). Annual precipitation in the last four decades was higher than the long-term average of 41.0 inches/year (1,041 mm/year; Figure 2-45). There were no significant trends in heavy precipitation days in any time period in the Southeastern division; however, the number of heavy precipitation days were still higher than the long-term average of 9.1 days/year since 1990.
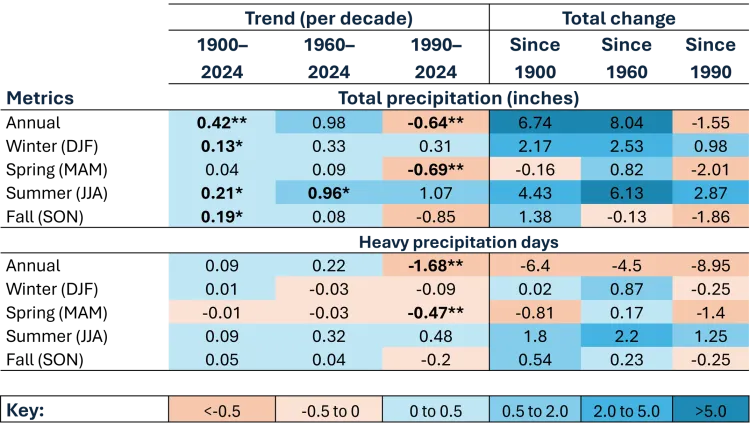
Source: NOAA Regional Climate Centers (2026)
Note: Precipitation trends per decade and total change annually and by season. Total precipitation in inches and days with heavy precipitation (defined as >1 inch or 25.4mm in 24 hours) are provided numerically, as well as color coordinated from highly negative values (dark orange) to highly positive values (dark blue). *=statistically significant at 95% confidence interval; **=statistically significant at 90% confidence interval
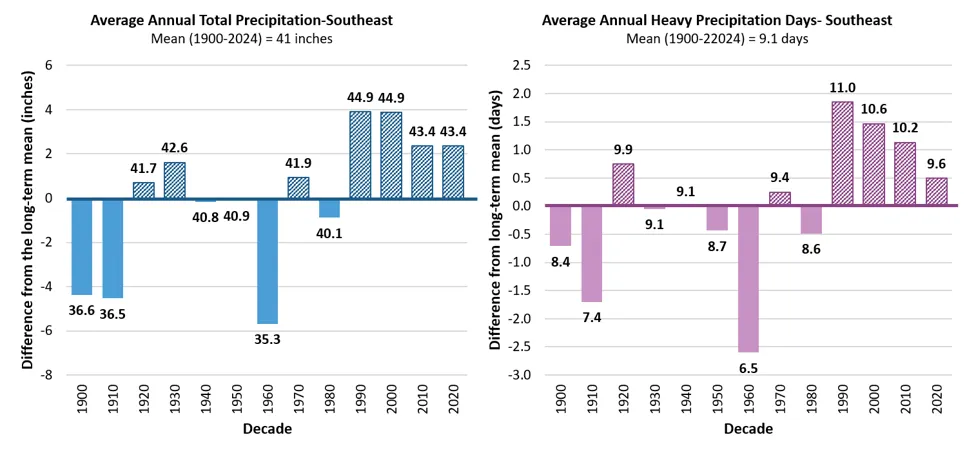
Source: NOAA Regional Climate Centers (2026)
Note: Long-term averages are indicated by the horizontal axis (y=0), equaling 41 inches/year of total annual precipitation, and 9.1 annual heavy precipitation days/year (defined as >1 inch or 25.4mm in 24 hours). Decades above the long-term average are striped, while decades below are solid. Data labels above each bar indicate the decade’s average value, bar heights reflect precise underlying values; labels are rounded to one decimal place
Western climate division
The Western division experienced increasing trends in both annual precipitation and heavy precipitation days in the long-term (Table 2-13). Annual precipitation significantly increased by 1.0 inches/decade (25.4 mm/decade) since 1900, for a total change of 32% (10.3 inches; 262 mm). Heavy precipitation days significantly increased by 0.29 days/decade since 1900, for a total change of 136% (5.0 days). Both annual precipitation and heavy precipitation days have been higher than their respective long-term averages since 1970 even though mid- and near-term trends were not significant (Figure 2-46). Heavy precipitation days increased marginally by 0.3 days/decade in the long-term; there are now 5 more heavy precipitation days in the Western division since 1900 (Table 2-13). Lake Champlain moderates temperature changes in this division but does not appear to suppress precipitation changes.
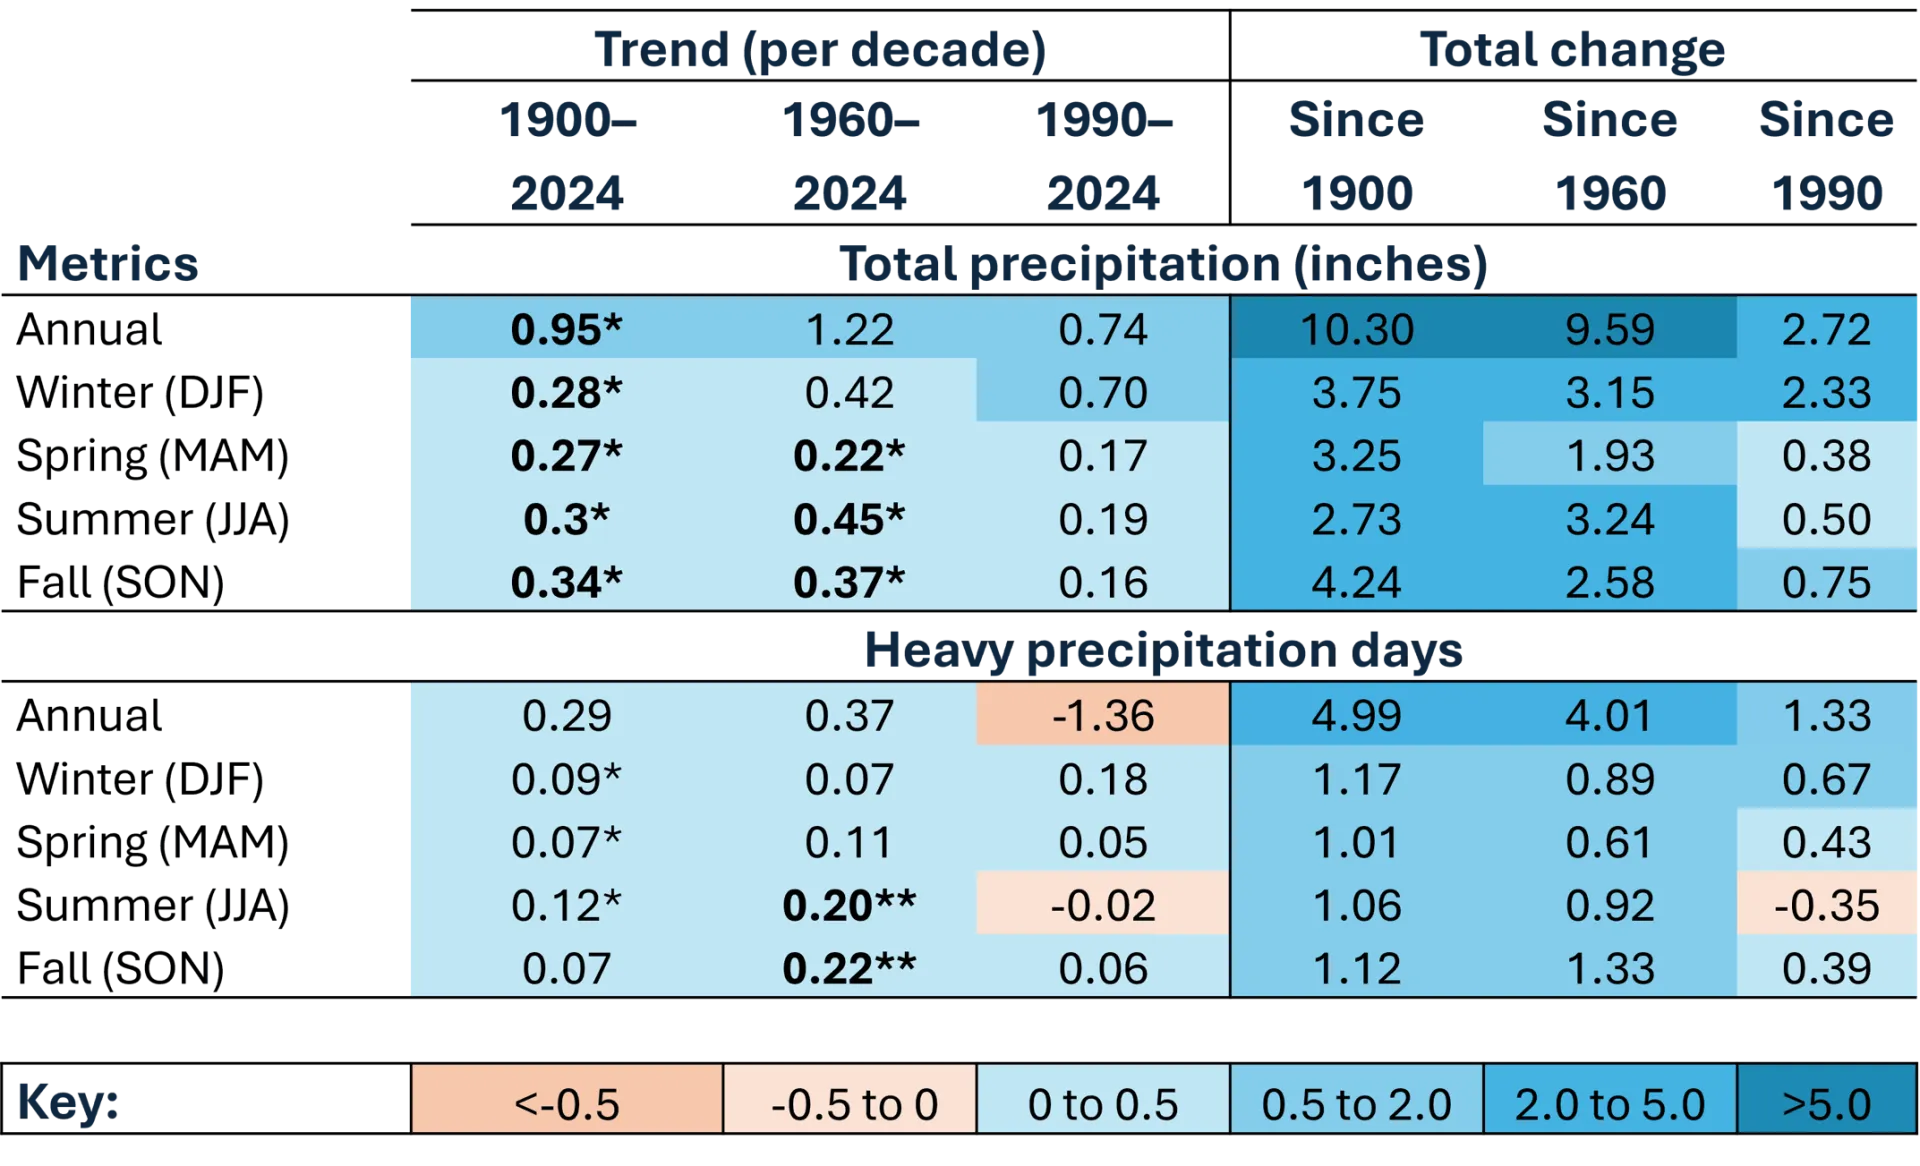
Source: NOAA Regional Climate Centers (2026)
Note: Precipitation trends per decade and total change annually and by season. Total precipitation in inches and days with heavy precipitation (defined as >1 inch or 25.4mm in 24 hours) are provided numerically, as well as color coordinated from highly negative values (dark orange) to highly positive values (dark blue). *=statistically significant at 95% confidence interval; **=statistically significant at 90% confidence interval
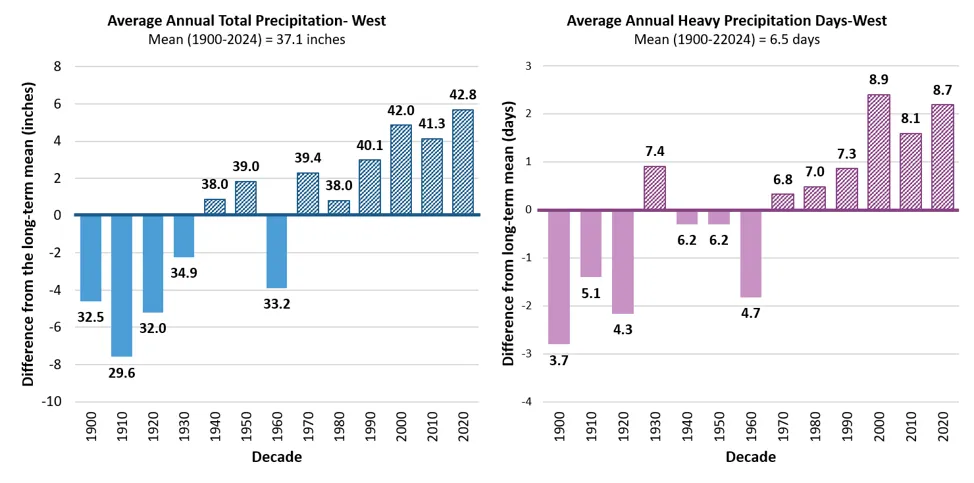
Source: NOAA Regional Climate Centers (2026)
Note: Long-term averages are indicated by the horizontal axis (y=0), equaling 37.1 inches/year of total annual precipitation, and 6.5 annual heavy precipitation days/year. Decades above the long-term average are striped, while decades below are solid. Data labels above each bar indicate the decade’s average value, bar heights reflect precise underlying values; labels are rounded to one decimal place
2.10.7 Climate division winter precipitation
Annual winter precipitation significantly increased in the long-term in all three climate divisions, while heavy precipitation days significantly increased in the long-term in the Northeastern and Western divisions. Snowfall, measured as inches of snow depth, decreased in the mid- and near- terms in the Southeastern climate division, which, combined with increases in annual winter precipitation, indicate that winter precipitation is falling more often as rain compared to snow now versus in the past in the southern parts of Vermont. Snowfall trends have only been measured since 1930 due to data availability in the Northeast and Western divisions, and 1940 in the Southeast climate division (see 2.3.1). Snow to liquid ratios (SLR) provide additional information on the relationship between the amount of snowfall recorded, and the liquid equivalent of precipitation falling each day. Calculated as a ratio of inches of snowfall per inches of liquid equivalent, trending lower values indicate wetter, heavier snow, or more frequent rain-on-snow events.
Northeastern climate division
Annual winter precipitation significantly increased in the long-term 0.24 inches/decade (6.1 mm/decade) for a total increase of 14% since 1900 (Table 2-11). Winter precipitation has been above the long-term average of 8.1 inches (206 mm) since 1970, averaging 9.3 inches/year (236 mm/year); however, winter precipitation neared the long-term average in the most recent half-decade (Figure 2-47).
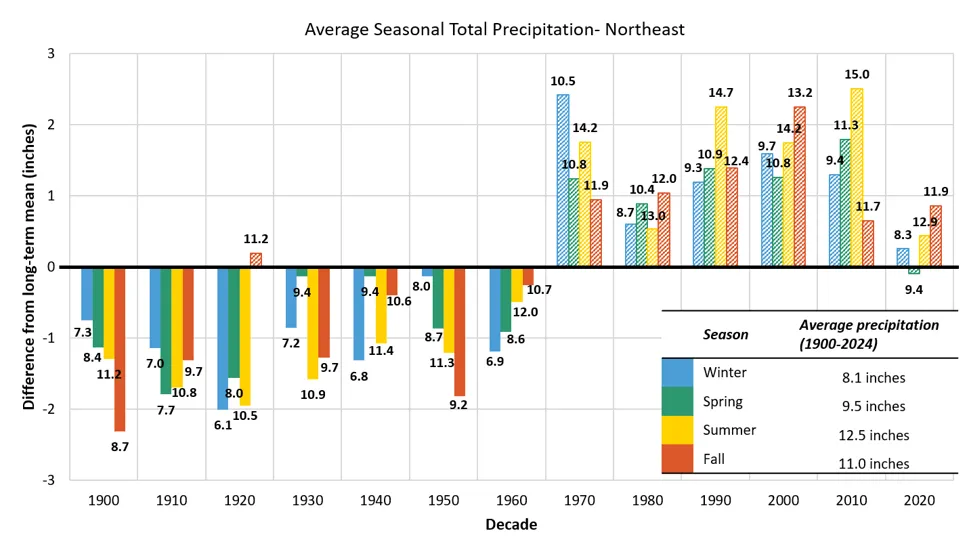
Source: NOAA Regional Climate Centers (2026)
Note: Long-term averages are indicated by the horizontal axis (y=0), equaling 8.1 inches for winter, 9.5 inches for spring, 12.5 inches for summer, and 11 inches for fall of total seasonal precipitation. Decades above the long-term average are striped, while decades below are solid. Data labels above each bar indicate the decade’s average value, bar heights reflect precise underlying values; labels are rounded to one decimal place
No snowfall trends were significant in the mid- or near-term in the Northeastern division (Table 2-5). However, people living in the Northeastern division experienced a 23% decline in average snowfall since 1960 (-25.0 inches; 635 mm) and a 20% decline since 1990 (-20.5 inches; 521 mm). When considering decadal averages, snowfall has fluctuated above and below the long-term average since 1930 without much consistency (Figure 2-48). Future climate assessments should continue to monitor trends, particularly as any decline in snowfall in this division is particularly impactful on the prominent winter recreation sites within this part of the state (see Outdoor Recreation and Tourism 9.3.3).
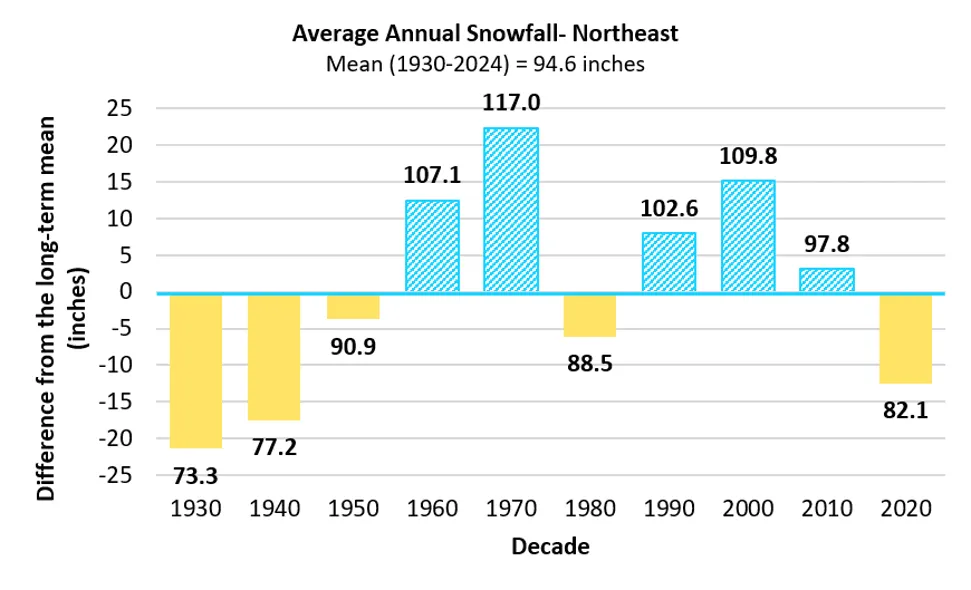
Source: NOAA Regional Climate Centers (2026)
Note: Long-term average is indicated by the horizontal axis (y=0), equaling 94.6 inches/year of total annual snowfall. Decades above the long-term average are striped, while decades below are solid. Data labels above each bar indicate the decade’s average value, bar heights reflect precise underlying values; labels are rounded to one decimal place
This division experienced the smallest long-term decline in SLR (i.e., Snow-to-Liquid Ratio) of 0.3 inches (7.6 mm) of snow per 1 inch (25.4 mm) of total winter precipitation. However, SLR declined to a total change of -5.8 inches (147 mm) since 1960 before lessening to a difference of -1.2 inches (30.5 mm) in the near-term (Figure 2-49). Lower SLR values indicate heavier, wetter snow or rain-on-snow events.
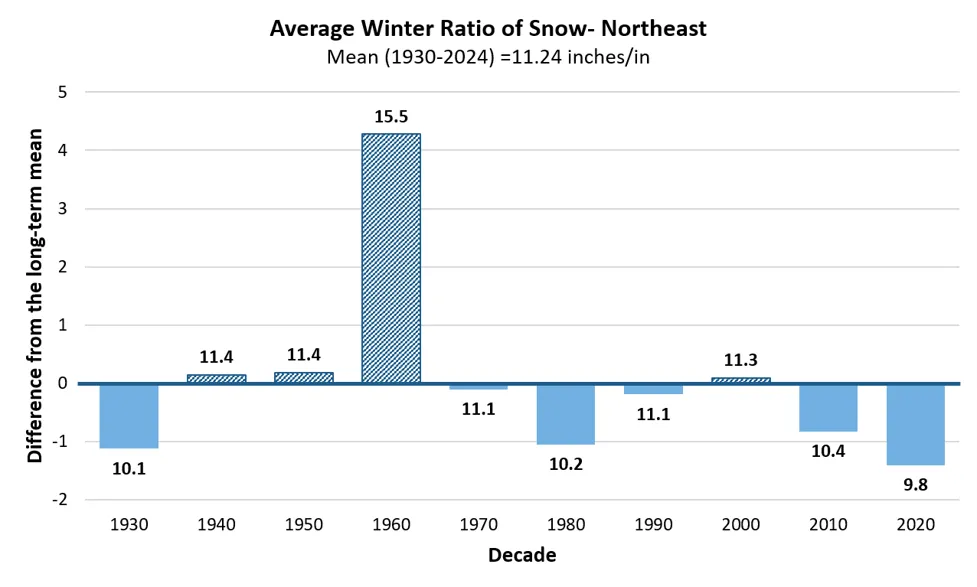
Source: NOAA Regional Climate Centers (2026)
Note: Long-term average SLR (1930-2024) is indicated by the horizontal axis (y=0), equaling 11.2 inches/inch. Decades above the long-term average are striped, while decades below are solid. Each ratio represents how many inches of snow fell compared to every 1 inch of all liquid equivalent precipitation during winter months (DJF). Data labels above each bar indicate the decade’s average value, bar heights reflect precise underlying values; labels are rounded to one decimal place
Southeastern climate division
Annual winter precipitation significantly increased in the long-term 0.13 inches/decade (3.3 mm/decade) for a total increase of 28% since 1900 (Table 2-12). Winter precipitation has been slightly above the long-term average of 8.8 inches (224 mm) since 1990, averaging 9.3 inches/year (236 mm/year; Figure 2-50). Winter heavy precipitation days did not significantly increase in any time period in the Southeastern division (Table 2-12).
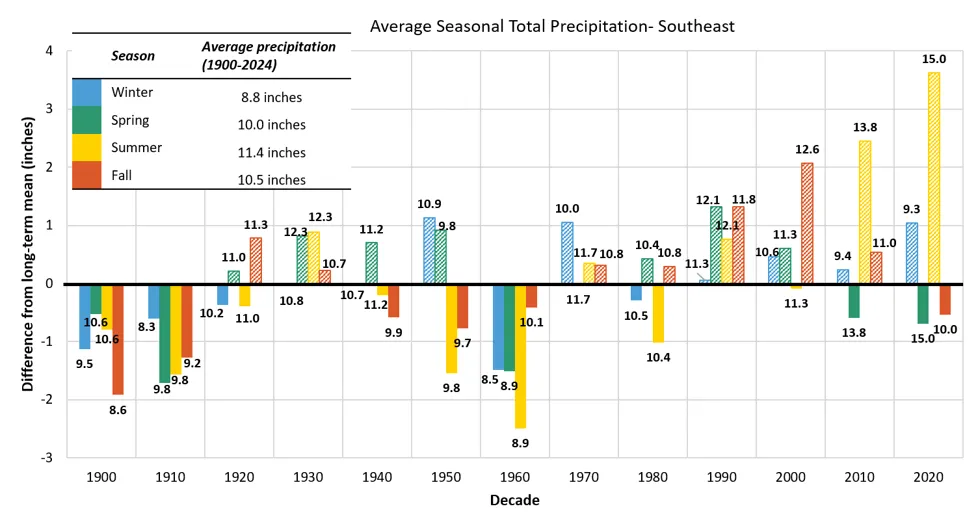
Source: NOAA Regional Climate Centers (2026)
Note: Long-term averages are indicated by the horizontal axis (y=0), equaling 8.8 inches for winter, 10 inches for spring, 11.4 inches for summer, and 10.5 inches for fall of total seasonal precipitation. Decades above the long-term average are striped, while decades below are solid. Data labels above each bar indicate the decade’s average value, bar heights reflect precise underlying values; labels are rounded to one decimal place
Southeastern Vermont, with its lower elevations and stronger influence from moisture from the Atlantic Ocean, has experienced the most dramatic (and only statistically significant) decline in snowfall (Table 2-5). Without reliable snowfall data in this division before 1940, analyses are limited to data since 1960 (see 2.3.1); therefore, no major conclusions can be made about divisionally consistent increasing snowfall trends since 1930. Snowfall decreased -4.9 inches/decade (124 mm/decade) since 1960 (a 35% decrease), and another 8.4 inches/decade (213 mm/decade) since 1990 (a 30% decrease). In total, Vermonters in this division experienced 31.7 inches (805 mm) less snowfall since 1960 and 25.5 inches (648 mm) less snowfall since 1990 (Table 2-5). Snowfall has been consistently below the long-term average since 2000 in this division (Figure 2-51).
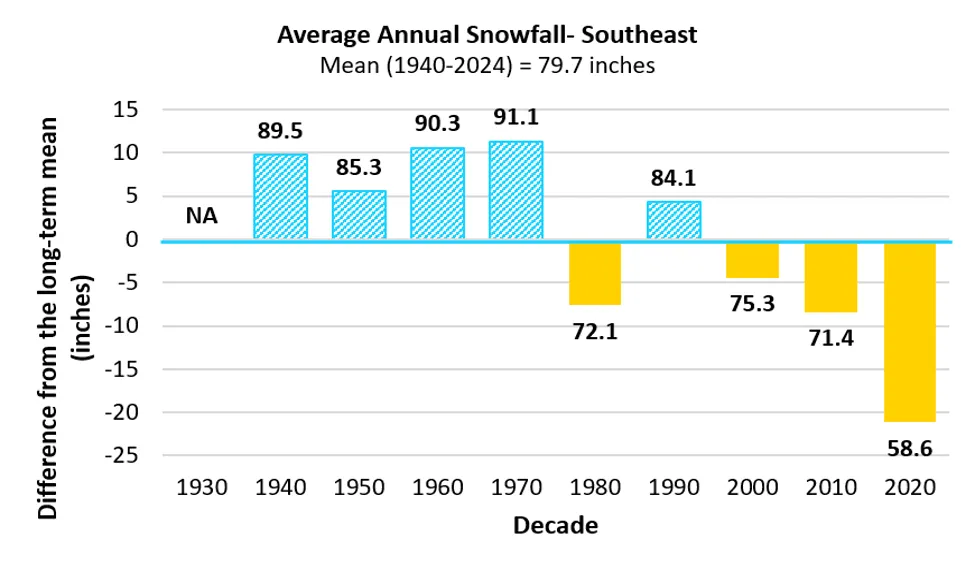
Source: NOAA Regional Climate Centers (2026)
Note: Long-term average is indicated by the horizontal axis (y=0), equaling 79.7 inches/year of total annual snowfall. Less than 3 years of data was available within this division for the years 1930–1939, therefore, this decade was omitted from analysis. Decades above the long-term average are striped, while decades below are solid. Data labels above each bar indicate the decade’s average value, bar heights reflect precise underlying values; labels are rounded to one decimal place
This division’s change in SLR was also the highest across all divisions, totaling -4.2 inches (107 mm) per 1 inch (25.4 mm) of winter precipitation since 1900. This change strengthened to -6.4 inches (162 mm) since 1960 due to historically high snowfall averages in the division from 1960–1980 of around 90 inches/year (2,286 mm/year), before falling slightly to a total near-term decline of -3.5 inches (88.9 mm; Figure 2-52).
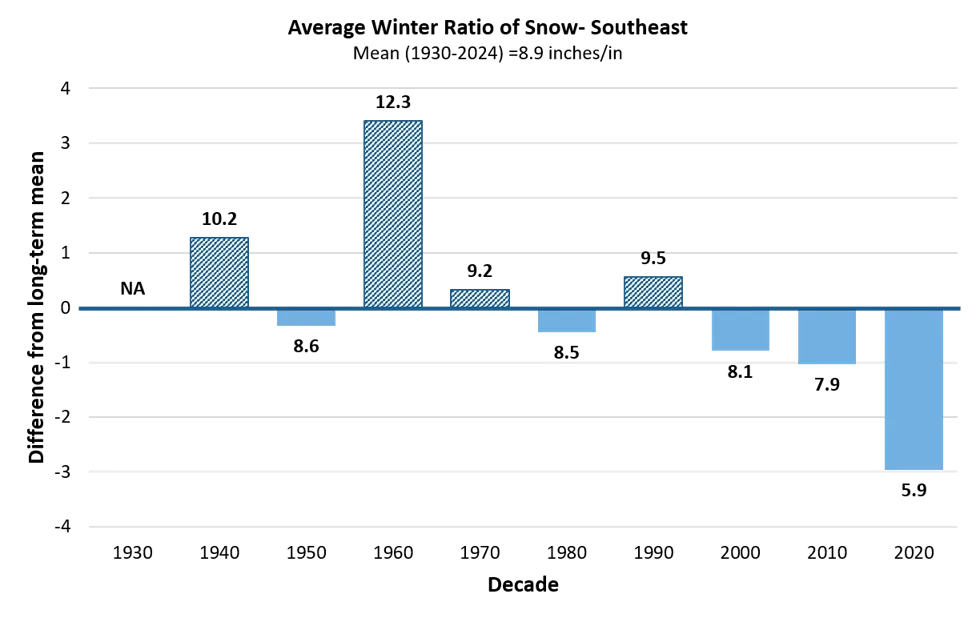
Source: NOAA Regional Climate Centers (2026)
Note: Long-term average SLR (1940-2024) is indicated by the horizontal axis (y=0), equaling 8.9 inches/inch. Decades above the long-term average are striped, while decades below are solid. Each ratio represents how many inches of snow fell compared to every 1 inch of all liquid equivalent precipitation during winter months (DJF). Data labels above each bar indicate the decade’s average value, bar heights reflect precise underlying values; labels are rounded to one decimal place
Western climate division
Annual winter precipitation significantly increased in the long-term 0.28 inches/decade (7.1 mm/decade) for a total increase of 67% since 1900 (Table 2-13). Winter precipitation has only been consistently above the long-term average of 7.1 inches (180 mm) since 2000, averaging 8.5 inches/year (216 mm/year; Figure 2-53).
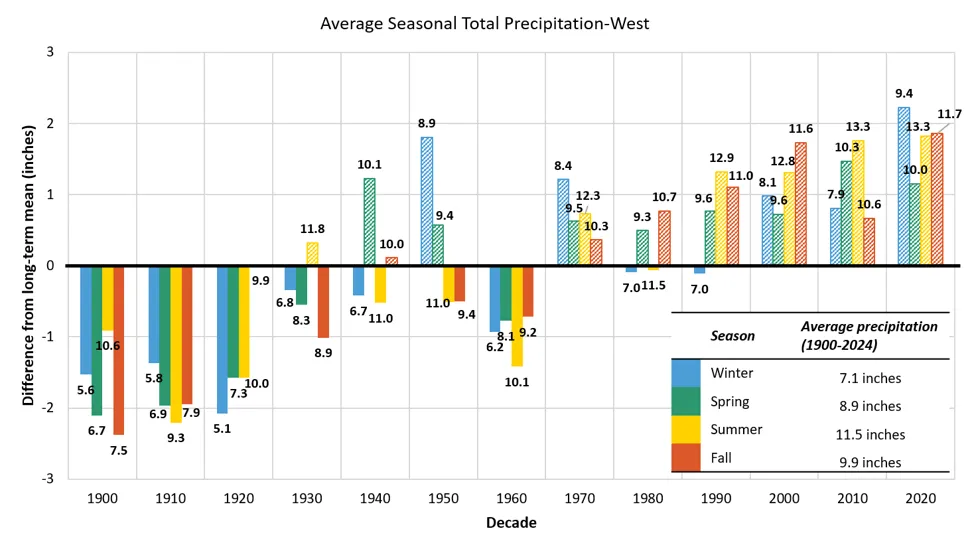
Source: NOAA Regional Climate Centers (2026)
Note: Long-term averages are indicated by the horizontal axis (y=0), equaling 7.1 inches for winter, 8.9 inches for spring, 11.5 inches for summer, and 9.9 inches for fall of total seasonal precipitation. Data labels above each bar indicate the decade’s average value, bar heights reflect precise underlying values; labels are rounded to one decimal place. Decades above the long-term average are striped, while decades below are solid
No trends in snowfall were significant in the mid- or near-term in the Western division (Table 2-5). However, people living in the Western division experienced a 15% decline in average snowfall since 1960 (-12.2 inches; 310 mm) and a 14% decline since 1990 (-11.5 inches; 292 mm). When considering decadal averages, snowfall was consistently above the long-term average from 1960–2009 but has been below the long-term average for the past 15 years (Figure 2-54). Future climate assessments should continue to monitor trends in snowfall within this division.
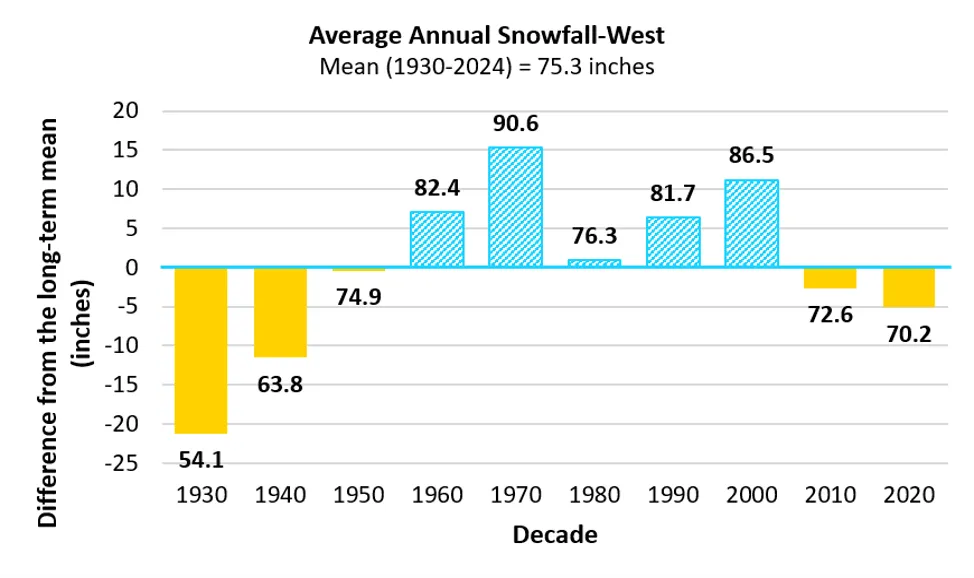
Source: NOAA Regional Climate Centers (2026)
Note: Long-term average is indicated by the horizontal axis (y=0), equaling 75.3 inches/year of total annual snowfall. Data labels above each bar indicate the decade’s average value, bar heights reflect precise underlying values; labels are rounded to one decimal place. Decades above the long-term average are striped, while decades below are solid
As noted above, Western Vermont experienced the greatest increase in winter precipitation since 1900, with a 67% total change (Table 2-13). In the near-term, Vermonters living in the Western division experienced 8.1 inches/year (206 mm/year) of winter precipitation. When paired with the recent declines in snowfall (-11.5 inches/year; -292 mm/year in the near-term), this division experienced a large snow-to-rain shift across the state with a total change in SLR of -4.1 inches (104 mm) per one inch of winter precipitation in the near-term; and a consistently lower SLR compared to the long-term average for the past 15 years (Figure 2-55). The most recent half-decade also experienced the lowest SLR on record in this division of only 7.5 inches (190.5mm) per one inch of winter precipitation, over 2.5 inches (63.5mm) less than the long-term mean, indicating that substantially more winter precipitation is falling as wetter snow or rain in recent years than historically.
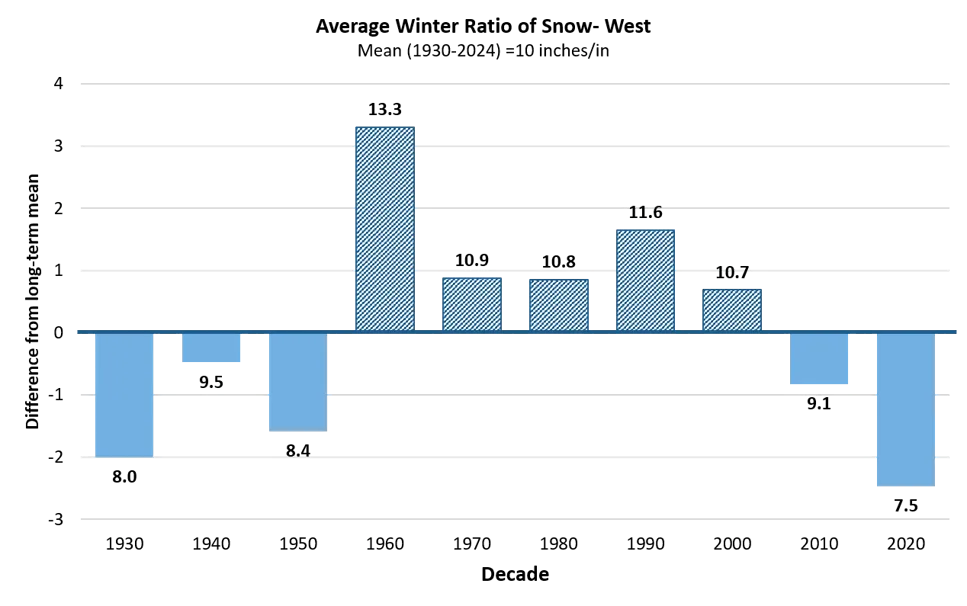
Source: NOAA Regional Climate Centers (2026)
Note: Long-term average SLR (1930-2024) is indicated by the horizontal axis (y=0), equaling 10 inches/inch. Decades above the long-term average are striped, while decades below are solid. Each ratio represents how many inches of snow fell compared to every 1 inch of all liquid equivalent precipitation during winter months (DJF). Data labels above each bar indicate the decade’s average value, bar heights reflect precise underlying values; labels are rounded to one decimal place
2.10.8 Climate division summer precipitation
Annual summer precipitation increased in the long-term for all three climate divisions and in the mid-term for the Southeastern and Western divisions. Since 1900, the Northeastern division increased 0.4 inches/decade (10.2 mm/decade; Table 2-11), the Southeastern division increased 0.2 inches/decade (5.1 mm/decade; Table 2-12), and the Western division increased 0.3 inches/decade (7.6 mm/decade; Table 2-13). Summer precipitation increases accelerated to 1.0 inches/decade (25.4 mm/decade) in the Southeastern division (5x increase; Table 2-12) and 0.4 inches/decade (10.2 mm/decade) in the Western division (1.3x increase; Table 2-13) in the mid-term. No trends for any division were significant in the near-term. Summer precipitation was higher than the long-term average (12.5 inches/year; 318 mm/year) in the Northeastern division since 1970 (Figure 2-47) and higher than the long-term average (11.5 inches/year; 292 mm/year) in the Western division since 1990 (Figure 2-53). Summer precipitation fluctuated above and below the long-term average (11.4 inches/year; 290 mm/year) in the Southeastern division but recorded its highest decadal average since 1900 in the last half-decade (15.0 inches/year; 381 mm/year; Figure 2-50).
Summer heavy precipitation days have also increased significantly across all climate divisions in the long-term (Northeastern, Western) and/or mid-term (Southeastern, Western). The greatest increase in the long-term was in the Northeastern division with 0.15 days/decade (Table 2-11) followed by the Western with 0.12 days/decade (Table 2-13). In the mid-term, the Southeastern division had the largest trend of 0.32 days/decade (Table 2-12) followed by the Western division with 0.20 days/decade, a 1.7x increase compared to the Western division’s long-term trend (Table 2-13). In total, the Southeastern division experienced 2.2 more summer heavy precipitation days since 1960, while the Western division had 1.1 more summer heavy precipitation days since 1900.
2.10.9 Climate division spring and fall precipitation
Both spring and fall precipitation patterns varied across all three climate divisions. Annual spring precipitation significantly increased in the Northeastern division (+0.25 inches/decade; +6.4 mm/decade) in the long-term (Table 2-11), significantly decreased in the Southeastern (-0.69 inches/decade; -17.5 mm/decade) division in the near-term (Table 2-12), and significantly increased in the Western division in both the long-term (+0.27 inches/decade; +6.9 mm/decade) and mid-term (+0.22 inches/decade; +5.6 mm/decade; Table 2-13). The Western division further had annual spring precipitation greater than the long-term average (8.9 inches/year; 226 mm/year) for the past 55 years (Figure 2-53). The most recent half-decade experienced an average of 10.0 inches/year (254 mm/year). Meanwhile, the Northeastern division experienced higher than normal (9.5 inches/year; 241 mm/year) spring precipitation from 1970–2019, while spring precipitation in the most recent half-decade (2020–2024) was below the long-term average at 9.43 inches/year (239 mm/year; Figure 2-47). In the Southeastern division, spring precipitation fluctuated from consistently above the long-term average (10.0 inches/year; 254 mm/year) from 1980–2009 (10.8 inches/year; 274 mm/year) to consistently below from 2010–2024 (9.4 inches/year; 239 mm/year; Figure 2-50).
Fall precipitation increased in the Northeastern (+0.32 inches/decade; +8.1 mm/decade; Table 2-11) and Southeastern (+0.19 inches/decade; +4.8 mm/decade; Table 2-12) divisions in the long-term and increased in the Western division in the long- (+0.34 inches/decade; +8.6 mm/decade; Table 2-13) and mid-terms (+0.37 inches/decade; +9.4 mm/decade). Annual fall precipitation was greater than the long-term average for the past 55 years in the Northeastern and Western divisions (Figure 2-47; Figure 2-53). The most recent half-decade experienced an average of 11.9 inches/year (302 mm/year) in the Northeastern division (Figure 2-47) and 11.8 inches/year (300 mm/year) in the Western division (Figure 2-53). In the Southeastern division, fall precipitation was consistently above the long-term average of 10.5 inches/year (267 mm/year) from 1970 until the most recent half-decade (Figure 2-50).
Heavy precipitation days significantly increased 0.9 days/decade in the fall and spring in the Northeastern division (Table 2-11), and less than 0.1 days/decade in the fall and spring of the Southeastern (Table 2-12) and Western divisions (Table 2-13).