Career Center
UVM graduates are known for their dedication to making a difference; this is true in disciplines ranging from STEM to the arts, education to medicine, environment to business, community develop to agriculture.

UVM Graduates are... Successful and Satisfied

94%

of recent graduates are successful in securing employment (70%) or continuing their education (24%) within 6 months (3-yr average*).

94%

of employed graduates reported they are satisfied with their position (3-yr average*).

93%

of employed graduates reported their position is related to their career goal (3-yr average*).

Career Outcomes by School/College
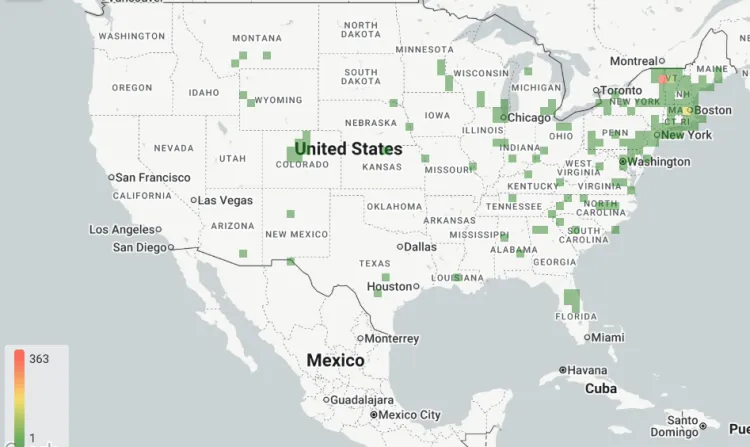
College of Agriculture and Life Sciences

Body


Pie Chart

Success Rate:

96%

Employed63%
Continuing Education32%
Volunteer Services2%
Knowledge Rate63%

Additional 2025 First Destination Survey Results:

  • 82% of those employed full-time report that their employment is related to their career goals.
  • 94% of those employed full-time indicated that they are satisfied with their position.
  • 96% of respondents said that UVM helped them explore their values, skills & career interests.
  • 97% feel prepared for their post-graduation pursuits based on their UVM experience.
CALS students engaged, on average, in 2 or more experiential learning opportunities.
Type of Experiential Learning% Engaged
Capstone Experience26.5%
Internship or Field Experience69.1%
Research45.6%
Service-Learning Course27.9%
Study Abroad32.4%
Other4.4%


College of Arts & Sciences

Body
CAS Career Outcomes
2025 First Destination Survey (Knowledge Rate: 50%)
  • 90% of those employed full-time report that their employment is related to their career goals.
  • 92% of those employed full-time indicated that they are satisfied with their position.
  • 95% of respondents said that UVM helped them explore their values, skills & career interests.
  • 98% feel prepared for their post-graduation pursuits based on their UVM experience.
CAS students engaged, on average, in 2 or more experiential learning opportunities.
Type of Experiential Learning% Engaged
Capstone Experience27.0%
Internship or Field Experience63.2%
Research54.6%
Service-Learning Course21.7%
Study Abroad32.2%
Other6.6%


College of Education & Social Services

Body
Chart of Career Outcomes (CESS)
2025 First Destination Survey (Knowledge Rate: 60%)
  • 100% of those employed full-time report that their employment is related to their career goals.
  • 100% of those employed full-time indicated that they are satisfied with their position.
  • 96% of respondents said that UVM helped them explore their values, skills & career interests.
  • 96% feel prepared for their post-graduation pursuits based on their UVM experience.
CESS students engaged, on average, in 2 or more experiential learning opportunities.
Type of Experiential Learning% Engaged
Capstone Experience25.7%
Internship or Field Experience88.6%
Research20.0%
Service-Learning Course51.4%
Study Abroad34.3%

College of Engineering & Mathematical Sciences

Body
Chart of Career Outcomes (CEMS)
2025 First Destination Survey (Knowledge Rate: 74%)
  • 97% of those employed full-time report that their employment is related to their career goals.
  • 99% of those employed full-time indicated that they are satisfied with their position.
  • 94% of respondents said that UVM helped them explore their values, skills & career interests.
  • 96% feel prepared for their post-graduation pursuits based on their UVM experience.
CEMS students engaged, on average, in 2 experiential learning opportunities.
Type of Experiential Learning% Engaged
Capstone Experience80.2%
Internship or Field Experience60.4%
Research36.6%
Service-Learning Course7.9%
Study Abroad15.8%
Other3.0%

College of Nursing & Health Sciences

Body
Chart of Career Outcomes (CNHS)
2025 First Destination Survey (Knowledge Rate: 53%)
  • 100% of those employed full-time report that their employment is related to their career goals.
  • 100% of those employed full-time indicated that they are satisfied with their position.
  • 92% of respondents said that UVM helped them explore their values, skills & career interests.
  • 94% feel prepared for their post-graduation pursuits based on their UVM experience.
CNHS students engaged, on average, in 2 experiential learning opportunities.
Type of Experiential Learning% Engaged
Capstone Experience77.6%
Internship or Field Experience55.1%
Research24.5%
Service-Learning Course24.5%
Study Abroad16.3%
Other2.0%

Grossman School of Business

Body
Chart of Career Outcomes (GSB)
2025 First Destination Survey (Knowledge Rate: 84%)
  • 100% of those employed full-time report that their employment is related to their career goals.
  • 91% of those employed full-time indicated that they are satisfied with their position.
  • 96% of respondents said that UVM helped them explore their values, skills & career interests.
  • 96% feel prepared for their post-graduation pursuits based on their UVM experience.
GSB students engaged, on average, in 2 or more experiential learning opportunities.
Type of Experiential Learning% Engaged
Capstone Experience60.7%
Internship or Field Experience78.6%
Research7.1%
Service-Learning Course14.3%
Study Abroad35.7%
Other10.7%

Rubenstein School of Environment & Natural Resources

Body
Chart of Career Outcomes (RSENR)
2025 First Destination Survey (Knowledge Rate: 63%)
  • 92% of those employed full-time report that their employment is related to their career goals.
  • 95% of those employed full-time indicated that they are satisfied with their position.
  • 99% of respondents said that UVM helped them explore their values, skills & career interests.
  • 99% feel prepared for their post-graduation pursuits based on their UVM experience.
RSENR students engaged, on average, in 3 experiential learning opportunities.
Type of Experiential Learning% Engaged
Capstone Experience66.1%
Internship or Field Experience81.4%
Research25.4%
Service-Learning Course66.1%
Study Abroad30.5%
Other1.7%

Far reaching Impact

Body

Our graduates are making great impacts across the nation.

Catamounts can be found in urban and rural areas; in board rooms, classrooms, innovation hubs, and national parks (just to name a few); they enrich communities from Alaska to Australia. 38% of graduates from the Class of 2025 staid in Vermont.

Heat Map of Where Recent Grads Land

Where they land

Body
Top EmployersTop Receiving Institutions
  • University of Vermont
  • University of Vermont Health Network
  • Brigham and Women’s Hospital
  • Vermont Information Processing
  • Burlington School District
  • Fidelity Investments
  • National Life Group
  • The University of Vermont Medical Center
  • USDA Forest Service
  • BETA Technologies
  • University of Vermont
  • Community College of Vermont
  • Boston University
  • Northeastern University
  • Boston College
  • University of New Hampshire – Durham
  • New York University
  • University of Chicago
  • University of Denver
  • University of Pennsylvania

*3-year Average

Body

We publicize our Career Outcomes as a three-year rolling average to provide the most accurate, stable, and representative picture of career success. 

Using a three-year average smooths out short-term variations in factors outside any one class, and highlights longer-term trends, helping students, families, faculty, and partners better understand the typical outcomes our graduates achieve. Outside factors may include labor market conditions, economic shifts, public health disruptions, and varying response rates. The three-year averages are weighted by year, so that the averages are not strongly influenced by the number of responses in a given year. This approach supports transparent, responsible reporting while avoiding over interpretation of data from a single cohort.

The average knowledge rate for the classes of 2023, 2024, 2025 is: 58%

Knowledge Rate

Body

The University of Vermont follows the First Destination Standards and Protocols put forth by the National Association of Colleges and Employers (NACE), with supplemental questions to reflect the unique aspects of career preparation of UVM.

NACE defines knowledge rate as ‘the percent of graduates for which the institution has reasonable and verifiable information concerning the graduates’ post-graduation career activities" (source). At UVM, we use a post-graduation outcomes survey to capture most of our graduates’ information as well as additional knowledge from reputable sources which capture the same information that the survey asks. The knowledge rate refers to the percentage of all UVM Undergraduate Degree Earners in a given class year for whom we have post-grad outcomes information, regardless of whether the information was obtained through the survey or through additional sources. 

UVM's Knowledge Rate Sources are:
- Undergraduate survey
- National Student Clearinghouse database
- UVM PeopleSoft database
- Staff and Faculty submissions
- Web searches (e.g., LinkedIn, UVM Connect)
- Student Handshake Profiles
- In some cases, phone calls to the students

Career Outcomes Survey

Now collecting data for Class of 2026 Graduates