Authors
Shashank Poudel
Gund Institute for Environment, University of Vermont, Burlington, VT
Peter Fisher
Emily Narberes
College of Agriculture and Life Sciences, University of Vermont, Burlington, VT
About
Recommended citation for chapter
Poudel, S., Fisher, P., Narberes, E. 2026. Chapter 8: Energy. In Galford, G.L., Balerna, J.A., Turner H.C., Sardonis, A., Peplinski, H. (Eds), The Vermont Climate Assessment 2025. Burlington, Vermont: Climate Measurements Center of Excellence, Gund Institute for Environment at the University of Vermont. DOI: 10.5281/zenodo.20272849. Accessed online at https://vtclimate.org.
Author Contributor Roles Taxonomy (CRediT) statement
Shashank Poudel: Conceptualization, Methodology, Writing- Original draft preparation, Writing- Editing & Review, Visualization; Peter Fisher: Conceptualization, Methodology, Writing- Original draft preparation, Writing- Editing & Review, Visualization; Emily Narberes: Conceptualization, Methodology, Writing- Original draft preparation, Writing- Editing & Review, Visualization
Acknowledgements
We thank Dana Rowangould, Sam Lash, and Mads Almassalkhi for their helpful guidance that helped structure this chapter. We are grateful to Cyril Brunner for repeated engagement as well as thoughtful comments that helped refine and strengthen the insights presented. We thank Hannah Turner for contributing to Figure 8-8. Ultimately, this would not have been possible without the ongoing support and guidance from the editorial team of Vermont Climate Assessment: Gillian Galford, Jessica Balerna, Hannah Peplinski, and Lola Chen. We are also grateful to the community members of the Gund Institute for the Environment for providing such a supportive and stimulating environment.
Downloads
Please use the following accessible downloads for your own needs.To find downloads of other chapters in VCA 2025, please go to Downloads.
- Energy (high resolution PDF)
- Energy (low resolution PDF)
- Energy brief (PDF)
- Energy slidedeck (PPTX)
- alt-text is attached to each figure.
8.0 Executive summary
The relationship between climate change and the energy sector is dynamic and interdependent. The main energy sources used in the United States produce greenhouse gas (GHG) emissions through fossil fuel consumption, ultimately contributing to the buildup of GHGs in the atmosphere and contributing to climate change. Meanwhile, the effects of climate change impact the energy sector’s infrastructure, supply, demand, and long-term sustainability. Vermont’s climate is getting warmer and wetter, with weather extremes becoming more frequent and intense. The stress that extreme weather events have on energy infrastructure and operations has historically resulted in outages and lasting damage to energy infrastructure. These trends are very likely to intensify as extremes and variability in weather conditions increase. Utility companies, policy makers, researchers, industry, and the public all have a shared role in effectively responding to these multifaceted energy-related needs.
Climate change is impacting Vermont’s energy sector in the following ways:
Longer, hotter summers are increasing energy demand for cooling, putting disproportionate strain on cooling infrastructure
Extreme weather is increasing in frequency and severity, often fluctuating between floods and droughts. Floods can overwhelm and cause physical damage to energy infrastructure, while droughts can decrease hydropower generation. Drought conditions in 2024 decreased regional energy supplied by hydropower that had to be offset with fossil fuel sources. While it is too early to determine impacts from the 2025 drought, similar declines in hydropower generation are likely.
Extreme weather events strain both electricity generation and transmission, increasing outage risks
Heightened energy demand from electrification of transportation and home heating and cooling put strain on the state’s power systems
Managing, planning, and adapting to these impacts of climate change requires significant investment of resources. To minimize risk and achieve greater resilience, stakeholders in Vermont (e.g., town planners, utilities) have called for increased redundancy, hardening of the existing grid (e.g., burying or replacing power lines), and development of new microgrids. Energy planning must anticipate emergent trends in climate-energy dynamics, including those that may not be currently apparent.
Existing state-led plans—primarily the Comprehensive Energy Plan (CEP)—in conjunction with the Climate Action Plan (CAP), provide overarching frameworks for achieving greater energy resilience and benchmarks for Vermont to reduce GHG emissions from the energy sector. Currently, emissions from the energy sector (i.e., transportation, thermal, and electricity) contribute to nearly three-quarters of Vermont’s total GHG emissions, with transportation and thermal being the most dependent on fossil fuels. Energy transitions, such as electrification of transportation and thermal sectors, offer opportunities to reduce emissions and costs while providing new opportunities for resilience. Electrification has steep upfront costs, despite its potential for long-term cost savings. As a result, so far, adoption in Vermont has been limited, and concentrated in wealthier regions. Programs like Vermont’s Weatherization Assistance Program (WAP) have aimed to make electrification more accessible to lower income and rural residents, but residents have reported logistical hurdles and complex regulations. The energy burden, or the percentage of gross household income spent on energy bills, remains inequitable across Vermont. High energy burdens are disproportionately experienced by low-income or rural residents who may spend up to 20% of their income on energy.
Planning for and realizing energy resilience involves cross-cutting efforts spanning multiple sectors (see 7 Infrastructure, 10 Human Health, and 11 Community Development). Mitigating GHG emissions through energy transitions as well as adapting energy infrastructure for a warmer, wetter, and more variable climate are necessary to create a more resilient Vermont.
8.1 Key messages
Vermont is experiencing a longer, hotter summer season, which increases energy demand and consumption.
More extreme weather events threaten existing and future energy grids. For example, drought conditions in 2024 decreased hydropower generation by 30%. Investment in climate-resilient infrastructure is needed to maintain existing grid functionality and to manage risk during increasing weather variability.
The transportation and thermal energy sectors are the largest contributors to GHG emissions. Electrification is a pathway to reducing emissions; Electric vehicle (EV) adoption has grown rapidly (up 24% from 2016 to 2023) but is concentrated in wealthier regions of the state. Investment in public transportation and weatherization subsidies are additional pathways for emissions reductions.
Energy burdens across the state are unequal; low-income and rural residents pay up to 20% of their income on energy. State-wide energy planning should consider existing equity issues, so they are not worsened by further climate impacts on the energy sector.
8.2 Background
Climate change and energy use are complexly interconnected. Energy use contributes to the release of greenhouse gases (GHGs), through the combustion of carbon-rich fuels, thereby contributing to climate change (Climate Change in Vermont 2.2.1). Industries involved in the production and distribution of energy account for nearly three-quarters of global—and Vermont—GHG emissions (Energy Action Network, 2025; Ge et al., 2024). A rapidly warming climate generates increased energy demand, while simultaneously undermining the capacity of existing production and distribution infrastructure. Extreme weather events (e.g., floods, hurricanes) physically damage power lines; droughts adversely affect hydro-generation; and changing cloud cover patterns can disrupt solar-based energy production.
Aware of the dual challenges of energy emissions affecting climate change and climate change posing risks to energy production and infrastructure, the state of Vermont developed a Comprehensive Energy Plan (CEP). The CEP suggests pathways to meet energy targets (Figure 8-1). One of its high-level goals is to meet 90% of the state’s energy needs with renewable sources by 2050 (Vermont Department of Public Service, 2022). Initiated in 1998, the CEP, under the purview of the Department of Public Service, was most recently revised and updated in 2022. The CEP is not directed towards climate action; instead, that is undertaken explicitly by the Climate Action Plan (CAP) under the purview of Vermont Climate Council. Together, the CEP and the CAP are the two major policy avenues to achieve climate goals as mandated by the Vermont Global Warming Solutions Act (GWSA) of 2020, which recognizes overlaps in the energy sector and just energy transitions (Vermont Climate Council, 2025).
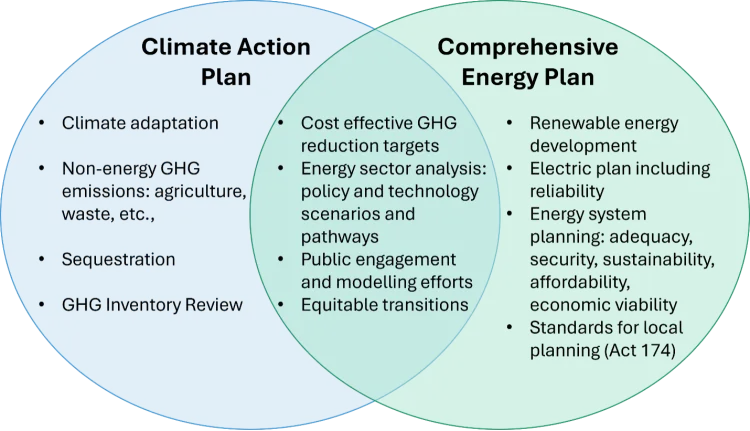
Source: Vermont Department of Public Service (2022)
The 2022 CEP is a plan for meeting significant goals for GHG reductions in electric, transportation, and thermal energy sectors (Table 8‑1). These three sectors are responsible for 75% of Vermont’s total GHG emissions; the remaining quarter of emissions are from non-energy sectors, such as agriculture, industrial processes, and waste (Energy Action Network, 2025; Vermont Climate Council, 2025). Of the top three sectors, transportation and thermal energy sectors are the largest consumers of energy in Vermont; they are associated with 41% and 45% of total use. While the thermal energy sector uses the most energy, transportation is more reliant on fossil fuels (38%; Figure 8-2).
Sector | 2022 CEP goals |
|---|---|
Electricity | - Fully decarbonized and at least 75% renewable by 2032 |
Transportation | - Zero-emission vehicles account for 100% of light-duty vehicle sales in Vermont by 2035 |
Thermal and Process Energy | - Increasing renewable thermal and process supply to 30% by 2025, increasing to 45% by 2032 and 70% by 2042 - Weatherizing 120,000 households by 2030, relative to a 2008 baseline - Calls for the formal consideration of a Clean Heat Standard |
Source: Vermont Department of Public Service (2022)
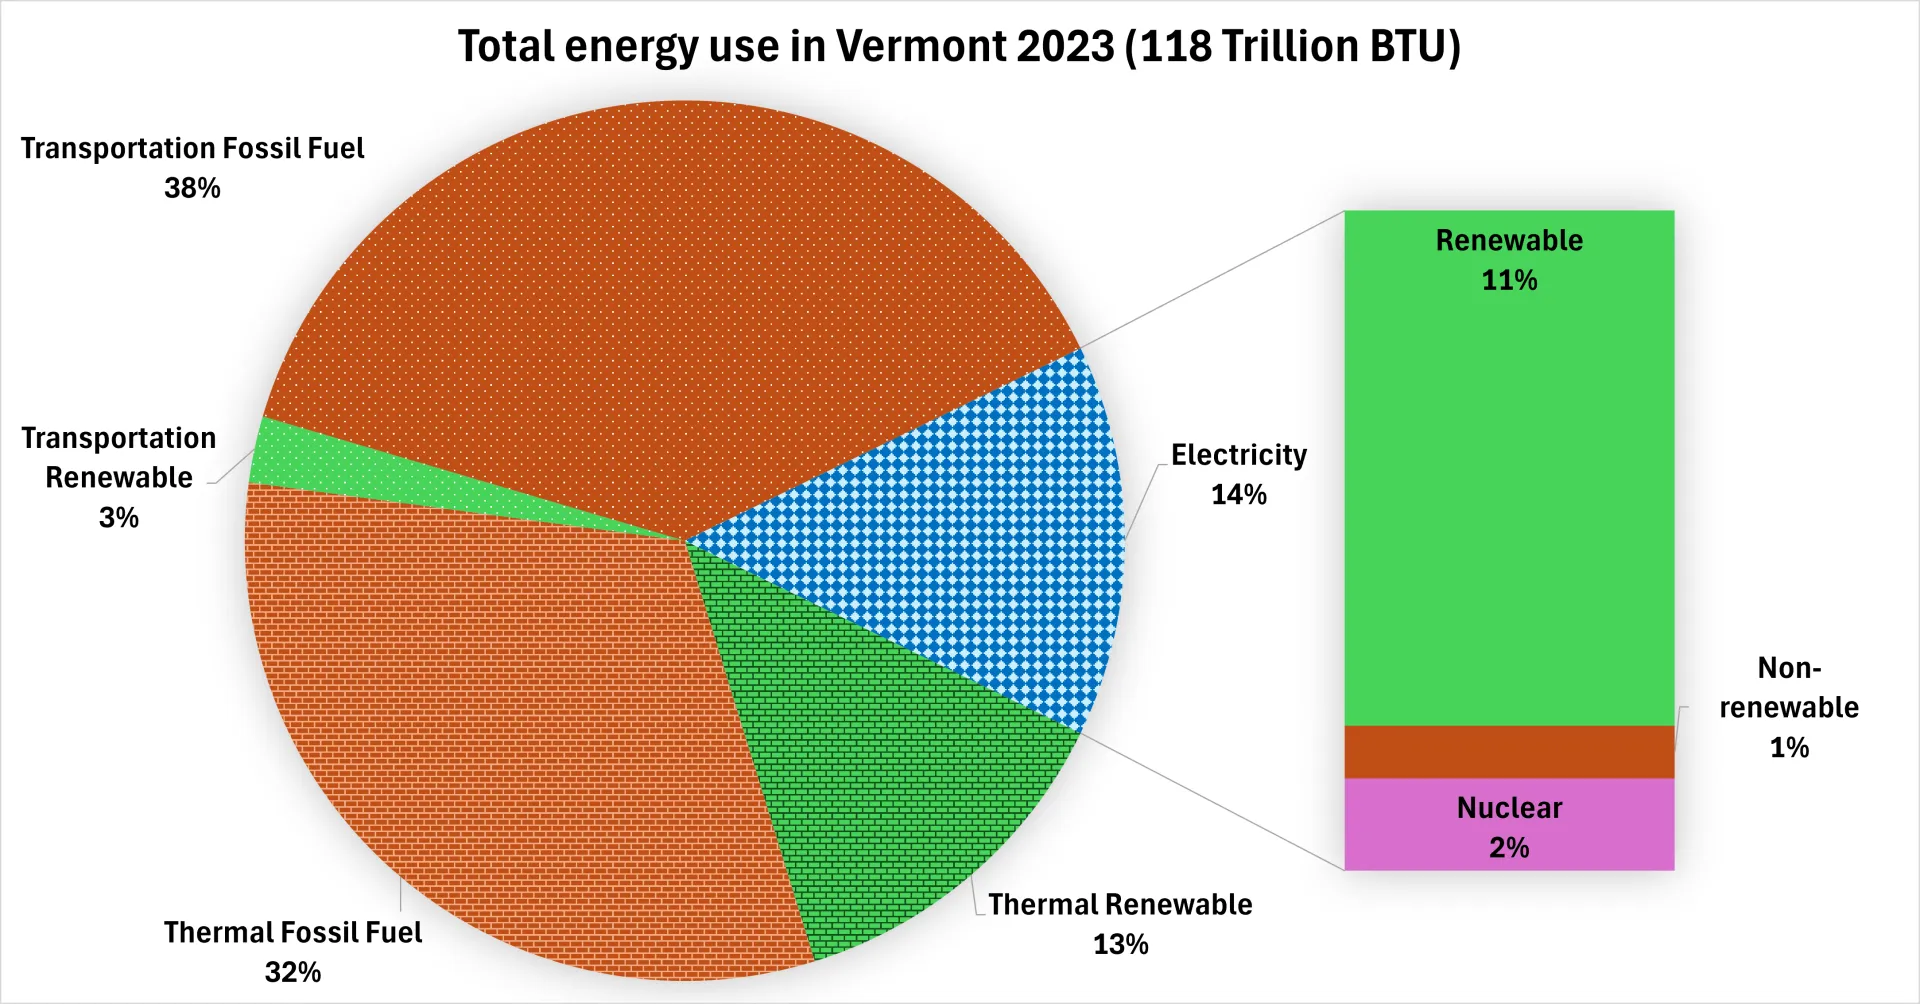
Source: Adapted from Energy Action Network (2025)
Vermont’s GHG emissions have decreased since their peak in the mid-2000s, down 17.5% in 2022, yet the state is not currently on track to meet its requirement of 26% reduction below 2005 emissions by January 1, 2025 (Energy Action Network, 2025).
8.3 Energy use
8.3.1 Energy sources
Energy sources are typically separated into two categories: primary (unprocessed or unconverted energy from nature) and secondary (primary energy converted into a transportable form). In Vermont, primary energy sources include hydropower, wind, solar, and biomass; the state has no significant fossil energy reserves of oil, gas, or coal (EIA, 2024). Primary energy is converted into secondary energy with appropriate infrastructure and additional energy inputs. Secondary energy is the most common energy form used by everyday people through electricity, refined gasoline, and biofuels. Energy use can be further categorized in terms of final energy (i.e., secondary energy delivered to the consumer, such as filling up a gas tank) and useful energy (i.e., energy put towards a desired application, such as moving a car; Ritchie, 2022; Figure 8-3).
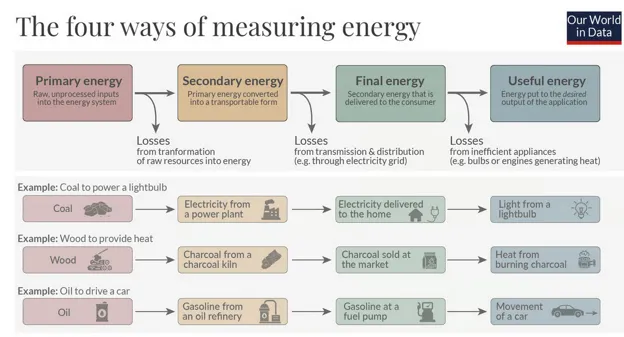
Source: Ritchie (2022)
Since 2014, most of Vermont's electrical energy comes from out-of-state (e.g., Hydro-Québec in Canada) due to the shutdown of the Vermont Yankee Nuclear Plant. Vermont also gets a small amount of hydropower-generated electricity from the New York Power Authority. In-state electricity generation is almost 100% derived from renewable primary energy sources, including: hydroelectric (57%), wind (16%), biomass (17%), and solar (10%). Nonrenewable sources (e.g., petroleum) account for the remaining (<1%) energy generated within the state (EIA, 2024). When power demand is high, secondary energy sources from natural gas and petroleum-fired electricity generation are used to maintain grid reliability; however, in total, they fuel minor amounts of Vermont's in-state generation.
8.3.2 End uses and electrification
Transportation
GHG emissions from transportation account for 40% of Vermont’s emissions (Energy Action Network, 2025). The transportation sector has the highest fossil fuel dependence (94%) compared to any other sector, with motor gasoline and diesel cumulatively accounting for 91% of the fossil fuel emissions in the transportation sector. Jet fuel and other non-renewable resources make up the remaining 3% of fossil fuel emissions in the transportation sector.
Vermonters in rural areas tend to have a longer average travel distance in their daily lives (e.g., to and from schools, jobs, grocery stores) than those who live in more densely populated areas (Espeland & Rowangould, 2024). While electric vehicle (EV) adoption can help lower transportation-related GHG emissions, wealthier population centers like Burlington, Barre, and Montpelier have a much higher adoption rate of EVs than rural areas of Vermont (Figure 8-4). Access to transportation electrification infrastructure (e.g., EV charging stations) is spreading throughout the state but is more common in areas of high population density. The separation in adoption rates between urban and rural Vermonters could be due to the limited range of EVs and less availability of public, fast, and centrally located EV chargers. Even though most charging currently happens at home, investment in relevant transportation electrification infrastructure may lead to increased adoption.
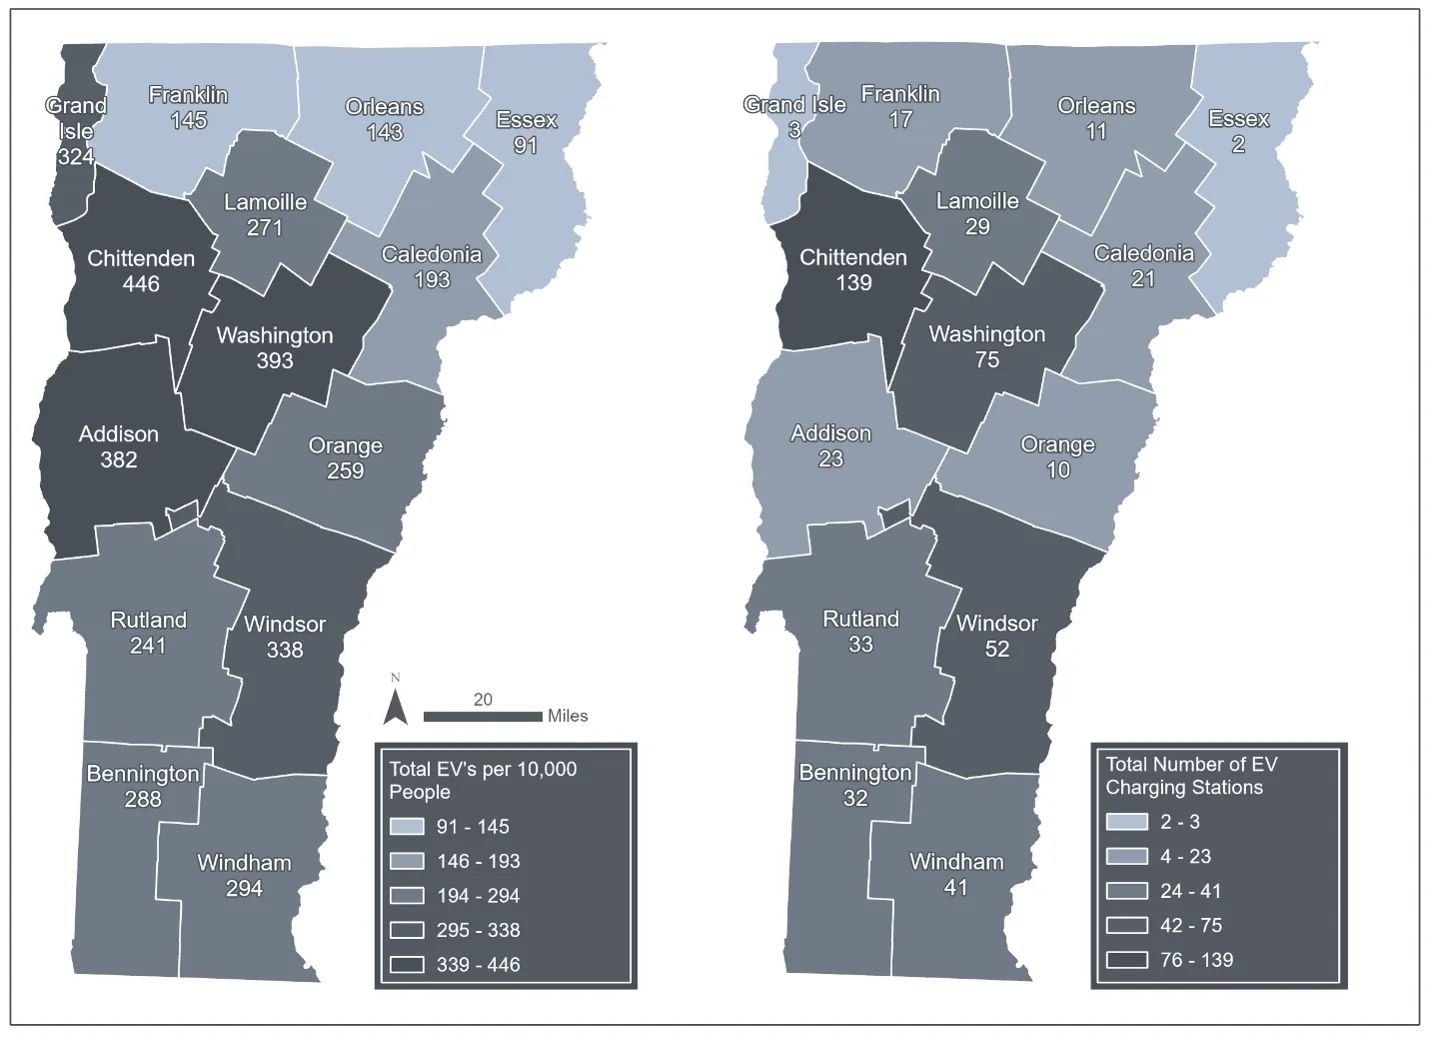
Source: Drive Electric Vermont (2026); VT Agency of Commerce and Community Development (2022)
Note: Visualization by Hannah C. Turner
Vermont has an above-average commitment to transportation electrification when considering the rest of the United States (U.S.). U.S. Department of Energy data ranks Vermont as 9th in the U.S. for per capita EV adoption (USA Facts, 2025), despite challenging conditions including harsh winters, difficult road conditions, and low population densities. In the past decade, EV adoption has grown 24% in Vermont, with 5 registrations per 10,000 people in 2016 and 120 registrations per 10,000 people in 2023 (Department of Energy, 2023a). Given this trend, Vermont continues to pursue mitigation of its GHG emissions through the electrification of transportation (Figure 8-5). Capacity constraints and the age of infrastructure in Vermont pose some challenges to this mitigation approach in the state.
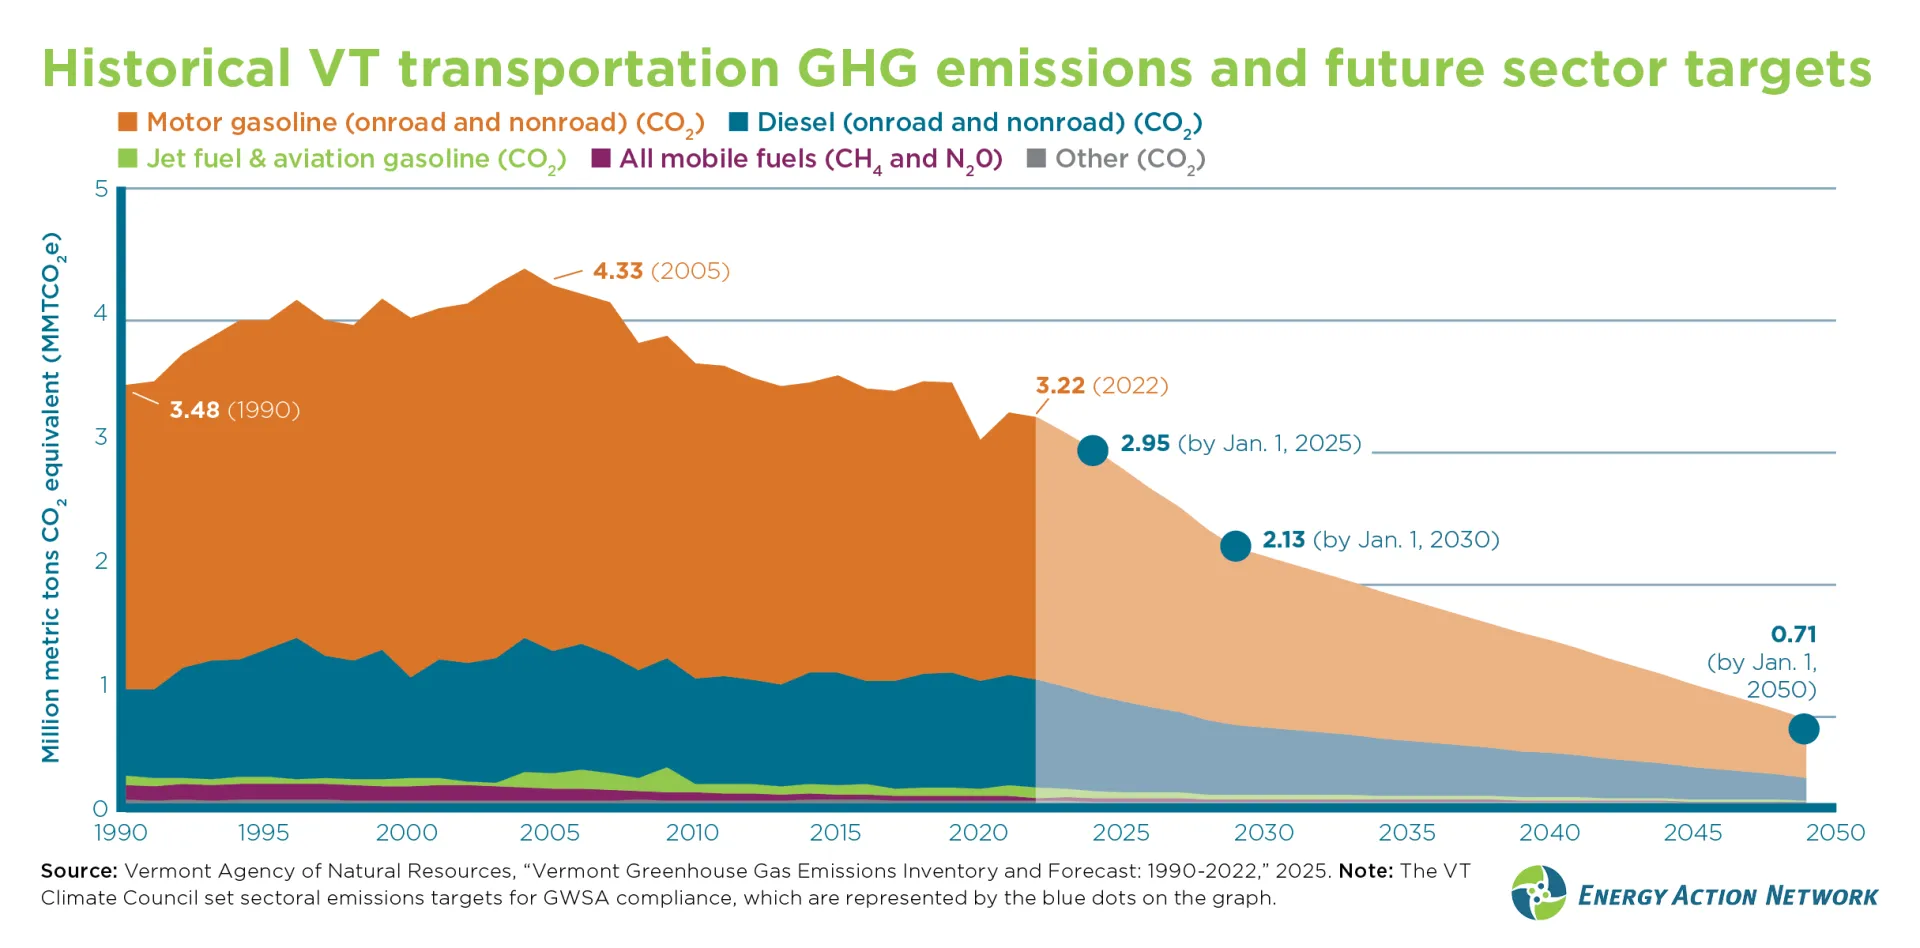
Source: Energy Action Network (2025)
Due to increasing adoption of EVs, demand for electricity by the transportation sector is rising and is expected to continue to rise (Vermont Department of Public Service, 2025). Instantaneous electricity demand from consumers has skyrocketed because EVs require a much higher instantaneous power demand for charging than the typical household requires for everyday operations. The average U.S. household consumes roughly 899 kilowatt-hours (kW-h)/month with an average of 1.25 kW of instantaneous power demand (typically between one and three kWs at any given moment). Average Vermont households consume much less than the national average (only 574 kWh/month in 2024; EIA, 2025a). A Level 2 EV charger, which uses a dedicated 240-volt outlet, requires between 5–19 kWs of instantaneous power, roughly six times the typical required capacity. Existing infrastructure is well-suited for plug-in hybrid EVs, which require Level 1 chargers that use around 2kW of charging power (Department of Energy, 2025), but additional investments are required for compatibility with the electricity demand from non-hybrid EVs.
The challenge of electrification of transportation is compounded by aging infrastructure; most of the grid, especially in rural areas, is over 25 years old (Department of Energy, 2023b; see Infrastructure 7.5.1). Vermont, in particular, has some of the oldest infrastructure in the country, including some still in use from the 1930s (7D Brand Studio, 2024). For example, distribution transformers used to power U.S. homes are typically rated to handle five kWs per home, and they allow for up to double capacity (10 kW) for up to one hour, but this reduces the life expectancy of the transformer. Most regions of Vermont cannot accommodate EV fast-charging because of old, lower-capacity pole top transformers.Distribution grid operators in rural America lack the budget to upgrade transformers at will when customers begin adopting EVs.
Heating
Thermal heating accounts for the second largest share of energy consumption in Vermont. Home heating is the source of roughly one-third of the GHGs produced (Energy Action Network, 2025). Several factors, such as Vermont’s cold winter climate, old and poorly insulated homes, and poor rural infrastructure contribute to high GHG emissions associated with thermal heating.
An estimated 35% of Vermont homes use wood stoves for home heating, with roughly 15% reporting that wood stoves were their primary source of heat (Kelly-Gorham, 2021). Burning wood, while a renewable source of energy, is still a source of GHG emissions (Tran et al., 2023). Vermont's winter temperatures have increased by approximately 4.6ºF (2.5ºC) since 1900 and the number of annual very cold days (i.e., days where minimum temperatures are below 0ºF/-18ºC) has decreased by almost 16 days within the same period (see Climate Change in Vermont 2.4.3). Warmer temperatures combined with less frequent cold extremes will likely reduce thermal energy demand. However, reductions in winter thermal GHG emissions will not offset emissions from increased cooling required due to warming temperatures.
Projections show that Vermont’s reliance on high GHG-emitting heat sources should decline with the growing popularity of high-efficiency heat pumps, but this possibility is not without cost and infrastructure challenges. Currently, Vermonters pay an average of 22.5 cents/kW-h for electricity. This is 28% higher than the national average cost of electricity (17.5 cents/kW-h; EIA, 2025b; Energy Action Network, 2025). The higher cost of electricity makes justifying a heat pump difficult, especially in rural areas where electrical grids are less stable during severe weather. Heat pumps further contribute to the growing problem of instantaneous power demand (see 8.3.2). Heat pumps generally increase the base load of a household by one to two kW, leaving only three kW of capacity for a five kilovolt-ampere (kVA) transformer, the most common residential transformer in the state. This means that only two homes connected to the same transformer can use a heat pump in the winter, while often three to five homes are connected to a single pole top transformer.
Weatherization, infrastructure upgrades, and tax incentives can help to address these issues. Improved weatherization of homes can reduce the amount of heat or cooling production needed to maintain the same temperature. Widespread upgrades to Vermont’s aging electrical grid can help accommodate new energy demands. Lastly, tax incentives to install heat pumps in new constructions and when upgrading existing buildings can all reduce the GHG production from in-home temperature regulation.
8.4 Energy Infrastructure
Climate change affects energy source distribution and infrastructure through impacts on physical infrastructure, energy supply, and energy demand. Energy infrastructure in Vermont is especially vulnerable to increasing frequency of extreme weather events, like flooding, droughts, and wildfires (see Climate Change in Vermont 2.6). Impacts from these events can physically damage energy circulation infrastructure, adversely affecting energy supply. Long-term increases in temperatures and precipitation can have long-term impacts on line capacity and demand (Fant et al., 2020; Yalew et al., 2020). Over the past decade, Vermont has experienced numerous major outages (i.e., outages affecting at least 50,000 people). Almost all major outages (98%, 46/47) in the past 25 years were weather-related (Figure 8-6; Box 8-1).
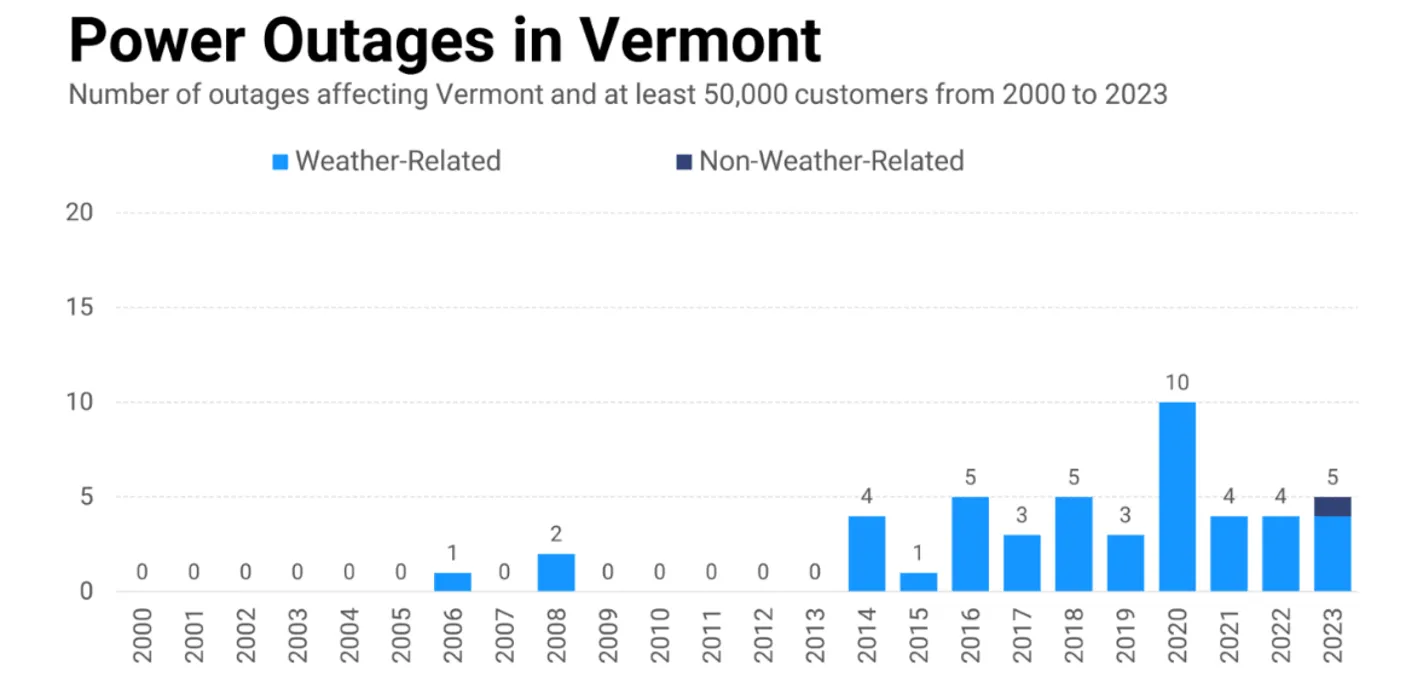
Source: PowerOutage.report (2026)
Parts of Vermont have experienced flood events in the past three years that resulted in power outages. Over 48,000 people were reported as facing outages in August 2024 from the impact of remnants of Hurricane Debby (Weinstein, 2024). A U.S. Energy Information Administration (EIA) analysis found that Vermont had the third highest frequency of interruptions per customer of all U.S. states behind Hawai’i and Maine in 2024, mostly attributable to storm-related tree damage (Aramayo & Peterson, 2025).
Box 8-1: Electric outages from weather events
We've seen an increase in the severity of the weather events, even if not in quantity. So, the wind speeds have increased and not just extreme weather events but also moderate weather events are worse. Where we might have seen 10 broken poles from an event before, we now see 50.... Broadly speaking, we haven't seen a rise in outages because we've made really good investments into the system, but also because of weather events, we have not shown a drop in outages either. We're fairly flat (C. Brunner, personal communication, 2025).
8.4.1 Physical infrastructure
Energy infrastructure needed to generate, transmit, and deliver energy to consumers, business, and industries, such as the lines, towers, facilities, and poles can be harmed by various extreme weather events (Table 8‑2; see Infrastructure 7.5.1). Heavy precipitation and storm events, which are becoming more frequent in Vermont (see Climate Change in Vermont 2.5.2 and 2.6.2), can cause trees to fall and damage infrastructure as well as potentially cause more frequent and severe power outages. Rain and snow events, historically, have been the largest cause of power outages in the Northeast U.S. (Do et al., 2025). In 2023, about a third of all Vermont power outages occurred in November and December due to winter storms (Vermont Electric Cooperative, 2024). However, evidence from warmer regions, like the Southeast U.S., suggests that as temperatures rise there may be increased heat-related power outages or outages due to severe summer storms (Saki et al., 2025). Globally, power outages are expected to increase six percent by 2050 (Guddanti et al., 2025). Adaptation strategies must account for existing infrastructure, its redundancy, and likelihood of weather events, to provide energy resilience.
Extreme weather | Infrastructure/energy type impact/risks | Demand impact/risks | Possible mitigation/adaptation |
|---|---|---|---|
Severe storms | Falling trees on power lines leading to localized outages | Outages are more likely, transportation is more difficult | Underground powerlines |
Drought | Lower hydropower, cooling requirement risks | Increased demand for irrigation, water pumping, etc. | Demand management |
Ice storms and blizzards | Ice accretion, line overloading, icing flashover | Outages are more likely, transportation is more difficult | Grid hardening |
Floods | Flash floods, road closures, landslides | Outages are more likely, transportation is more difficult | Grid hardening |
Heat waves | Temperature strain on transmission lines and transformers | Cooling related demand increases | Demand management, flexible mix of energy sources |
Source: This chapter
8.4.2 Energy supply
Vermont consumes four times as much energy as it produces (EIA, 2024). While almost all of the energy produced in Vermont is from renewable resources, non-renewable fossil fuel energy from out-of-state makes up for the gap in consumption and production (Energy Action Network, 2025).
Further, the relationship between local energy production and out of state non-renewable energy is not static as energy production is vulnerable to climate change. For example, local climate and weather-driven factors, such as rain patterns, reservoir levels, and drought conditions impact hydropower availability (Wasti et al., 2022). Drought conditions in 2024 greatly altered Vermont’s energy mix. ISO New England, which manages Vermont’s power supply, had a “30% year-over-year reduction in imports…primarily due to extended dry weather conditions limiting hydroelectric generation in Canada” (2025a). To offset this, combined reliance on natural gas and nuclear generation grew to 72% in 2024 from 68% in 2023, which also increased energy prices (ISO New England, 2025a). Though data is not yet available on the impacts from the summer and fall drought in 2025, it very likely impacted hydroelectricity generation and Vermont’s energy mix (McGuire, 2025).
Vermont’s reliance on hydroelectric power requires balancing energy demands with water resource protection. Most of Vermont’s hydroelectric facilities are “run of river” (i.e., without any large reservoirs), which makes them less likely to impact ecological communities and maintain seasonal streamflow patterns (Dowds, 2024; Lu et al., 2020). However, this makes them more unstable for energy generation.
8.4.3 Energy demand
While electricity demand has been relatively stable in Vermont over the past decade, it is expected to increase due to increased electrification of heating and transportation sectors (Poor, 2025). Further, rising average temperatures increase energy demand for cooling while increasing frequency of extreme weather events, such as floods and storms, intensify demand through associated recovery efforts (Leung et al., 2025).
Load management is where utilities shift or control energy consumption through incentives or dynamic pricing, which serves as a way to protect existing infrastructure from overloading (Mahmood et al., 2015). Strains on utility infrastructure are driven primarily by peak usage compared to average usage. Grids typically operate at peak only a few times per year, so load management makes it possible to amplify electrification with the existing grid. In the longer term, the interaction of climate change and energy demand will require alternative energy sources in the energy grid, which may require replanning of the grid itself. Such replanning should include expected climate projections in the state, such as more intense storms and higher temperatures.
Electricity demand has both daily and annual fluctuations (Hodge, 2020). Within a 24-hour period, the demand for energy in residential buildings typically peaks in the late afternoon/early evening hours, as the working population uses energy in their homes after returning from the workplace. Periods of highest demand vary based on season. Winter months show a morning peak when people begin to wake up, and an evening peak when they return home. Summer months show fewer peaks, in part due to more daylight, but they have more intense energy needs throughout the day due to consistent use of air conditioning. During summer months, energy demand increases throughout the day with the temperature, reaching a maximum in the early evening.
Throughout the year, electricity demand peaks in both the summer and winter in Vermont, whereas electricity demand used to peak only during winters (Sadoff, 2023). Between 2018–2025, system peaks occurred in winter three out of eight years (Vermont Department of Public Service, 2026; Table 8-3). During those same years (2018–2025), system peaks occurred exclusively in the summer months for the rest of New England. The pattern of summer peaks already occurring across the rest of New England is expected to occur in Vermont with the electrification of thermal and transportation systems and more frequent heat events causing air conditioning use to increase. In New England, the share of households that use air conditioning has nearly doubled since 1997, from 2.6 million to almost 5 million in 2020 (Dockser, 2024).
Year | ISO New England System | Vermont |
|---|---|---|
2018 | August 29 | July 2 |
2019 | July 30 | January 21 |
2020 | July 27 | July 27 |
2021 | June 29 | August 26 |
2022 | August 8 | January 29 |
2023 | September 7 | February 3 |
2024 | July 16 | June 19 |
2025* | June 24 | June 23 |
Source: Vermont Department of Public Service (2026)
Note: *2025 data is preliminary (as of January 16, 2026)
8.4.4 Energy efficiency and resilience
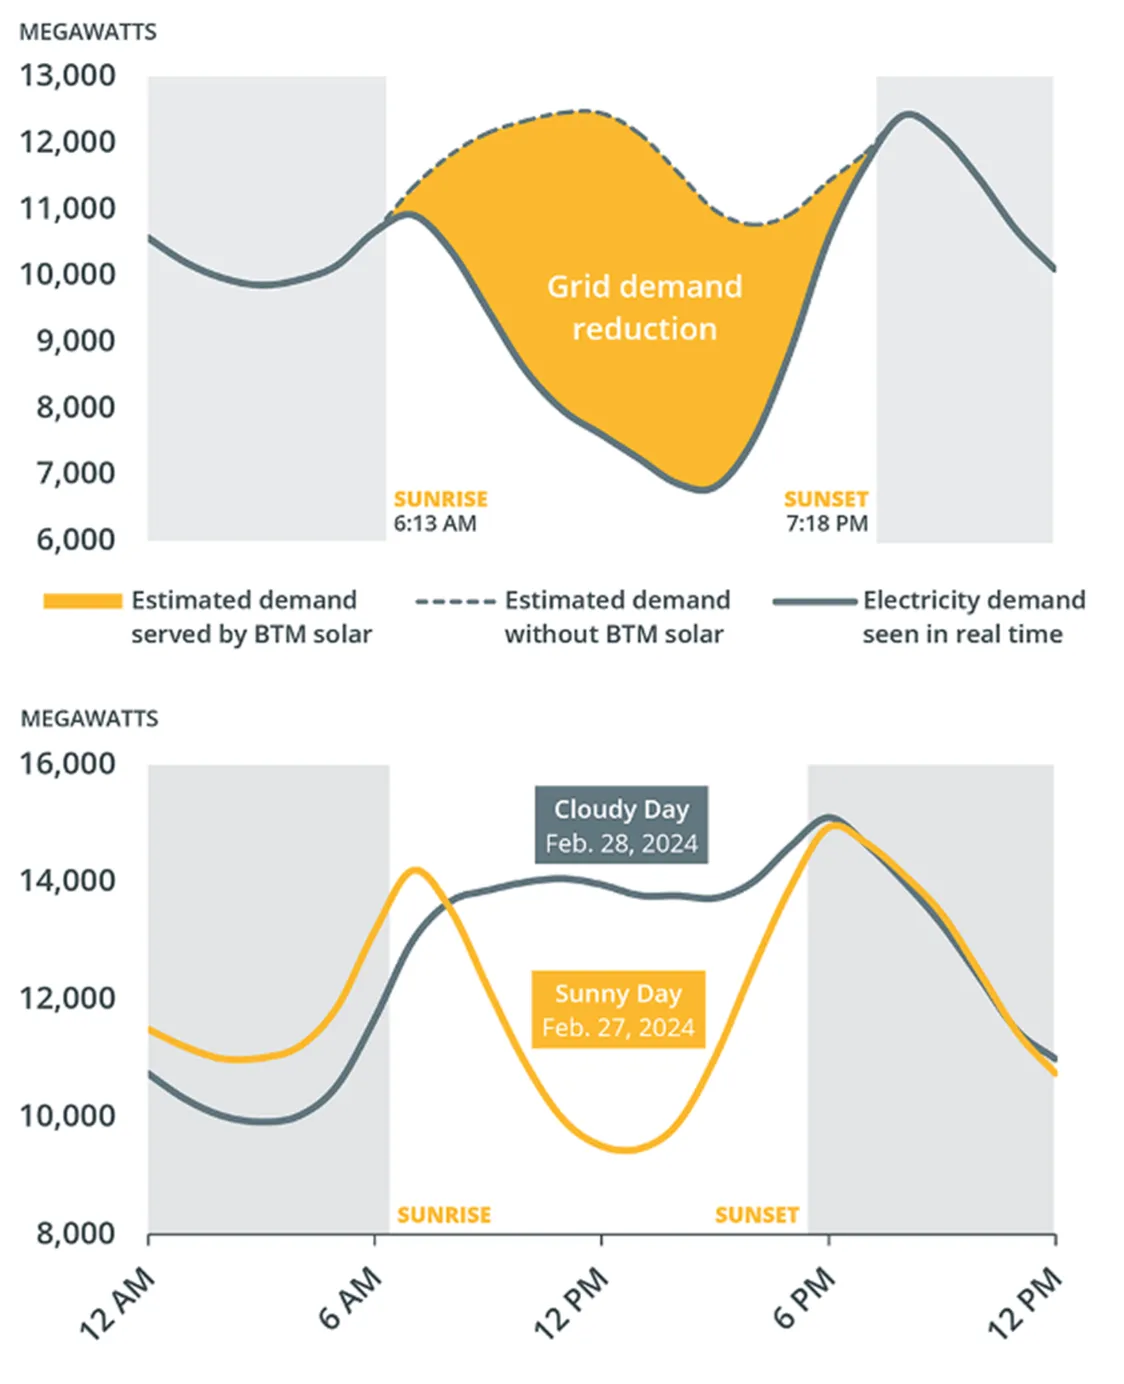
In a perfect system, energy demand matches energy supply; however, they are often misaligned, particularly with renewable sources. Take, for example, solar energy. Energy usage generally peaks around five p.m. when people get home from work and begin using appliances; however, availability of solar energy is highest during the day (between 10 a.m. and 2 p.m.). When examining energy demand over a 24-hour daily period, this mismatch creates a “duck curve.” Duck curves occur naturally in grids with little or no renewable energy resources, but the duck curve becomes exacerbated over time with the addition of varying energy sources, such as solar panels and wind turbines (Figure 8-7). As more homes install and use residential solar panels as well as charge their EVs after work, these activities cause an extremely steep duck curve moving quickly from low demand to high demand. This extreme change in demand is often difficult for electricity providers to keep up with and accommodate due to the potential for overproduction of electricity during the day, and underproduction in the evening.
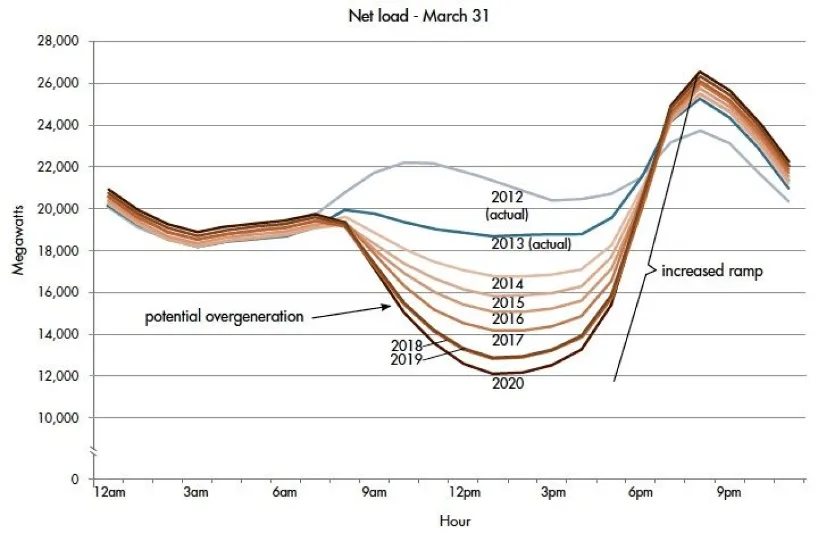
Source: Jones-Albertus (2017)
Solar
Solar power is a very inexpensive energy source but has two major downsides for the Vermont electrical grid: instability and irregularity. While popular support for solar power is extremely strong in the state of Vermont, it is also one of the cloudiest states in the country, with more than 200 days of cloud cover each year (Weather Spark, 2025). Additionally, high snowfall typical of Vermont is a challenge to maintaining solar panel operation compared to other states. Nonetheless, solar panels have become an increasingly popular source of energy generation and have proven to be a worthwhile source of energy despite these hurtles. In 2024, solar generation accounted for 18% of Vermont’s energy generation, outpacing the U.S. average of about 8% in the same year (EIA, 2024).
This climate-based variability of energy availability makes load prediction difficult. Operators of distribution and transmission grids need to schedule in advance the deployment time of energy to the grid predicted by past demand for similar conditions (e.g., temperature, time, day). The addition of distributed solar power generation at both commercial and residential locations makes this demand curve more difficult to predict as physical weather conditions need to be considered. Predicting the demand from customers who use solar panels for energy during the day will depend on the availability of sunlight during the daytime hours. During sunny days, solar panels can cause residential loads to drop their demand entirely as they become temporarily powered entirely by their solar rooftop (Figure 8-8), which contributes to the duck curve, described above (Figure 8-7).
While these hurdles for solar are certainly an issue to be aware of, solar still poses an extremely viable option for energy generation. A possible solution to both the instability and variability presented by solar energy is solved by another emerging technology: grid battery storage.
Source: ISO New England (2025)
Batteries
Grid battery installation provides two massive benefits to Vermont’s electrical grid: 1) solution to severe weather outages, and 2) solution to variability caused by renewable sources like solar and wind. Given Vermont’s harsh weather conditions, power outages are commonplace, especially in rural energy distribution networks (Figure 8-6). This can leave rural Vermont residents without electricity for long periods of time. While many Vermonters adapt to this by maintaining a wood stove as an alternative form of home heating, batteries are another potential option that also lower overall GHG emissions.
Batteries allow disconnected sections of the grid to remain active by creating their own micro-grid. Batteries reduce the duck curve by storing energy when energy demand is low and providing a source of energy when demand is high.
Physical protections
Physical hardening of the Vermont electric grid has proven to be an extremely effective way to reduce the frequency of outages. Targeting vulnerable areas of the state with simple hardening techniques such as installing steel cables to catch falling trees, and undergrounding cables, has been found to be effective at reducing outages in rural areas of the state (see Infrastructure 7.5.1).
8.5 Energy planning and equity
8.5.1 State-level energy planning
Policy in action
In accordance with the Vermont CEP, the state pledges to meet 90% of energy demand with renewable sources by 2050 (Vermont Department of Public Service, 2022). Vermont pledges to reduce GHG emissions by 80% below 1990 levels by 2050 as mandated by the Global Warming Solutions Act (GWSA passed in 2020; Vermont Climate Council, 2025). While Vermont is a national leader in renewable energy generation, the state is not yet on track to meet its GHG emissions reductions requirement. Consequently, the state is susceptible to lawsuits if the commitments are not reached (Energy Action Network, 2025).
The Vermont CAP was established to help the state meet the standards set by the 2020 GWSA (Vermont Climate Council, 2025). It was most recently updated on July 1, 2025, by the Vermont Climate Council. The Vermont Climate Council was formed through the GWSA and has been entrusted with developing and implementing the CAP. The 2025 update is more specific regarding the pathways required to meet the next GWSA milestone, a mandated 40% reduction target below 1990 levels of GHG emissions by 2030. The pathways to achieve this target focuses on weatherizing homes, improving the electrical grid, and promoting electrification of vehicles and houses, among other comprehensive strategies. The CAP proposes tracking emissions reductions, resilience, equity outcomes, and general program effectiveness.
Vermont's electricity sector is significantly powered by renewable energy sources (~78%) that helps meet the goals set in place by the CEP. Updated Renewable Energy Standards (RES) have introduced goals to complete the shift to renewable energy, with standards for utilities to provide 100% of energy through a renewable source by 2035 (Vermont Department of Public Service, 2025). The updated standards require utilities to obtain 20% of electricity from in-state renewable sources. If companies fail to meet these goals, they are subject to penalties such as fines paid to the state. Additionally, utilities are required to invest in new state renewable energy projects, such as offshore wind farms (Vermont Climate Council, 2025).
Unlike Vermont’s electricity sector, the transportation and thermal energy sectors are falling far behind in their reduction goals (Energy Action Network, 2025). In 2023, the state passed Act 18 to design and implement the Clean Heat Standard Act to help achieve its goals to reduce GHG emissions from the thermal sector (Public Utility Commission, 2025); however, timelines for implementation are not yet clear (Gaffney, 2025). Recent analyses found that broader adoptions of heat pumps may increase electricity bills, while reducing energy costs overall. Electric heat pump water heaters have high upfront purchase and installation costs. To subsidize these upfront costs, Vermont has been developing programs like the Switch and Save program which offered rebates for up to 100% of the cost of a heat pump water heater for low and moderate income households (Energy Action Network, 2025). Such incentivization needs to be maintained and expanded as Vermont is still far off many of its 2030 targets for heat pump adoption and weatherization. As of 2025, these figures for various thermal solutions stand at 16% of the 2030 target for residential heat pump water heater, 34% for comprehensive weatherization of housing units, and 41% of residential cold climate heat pumps.
Developing with energy in mind
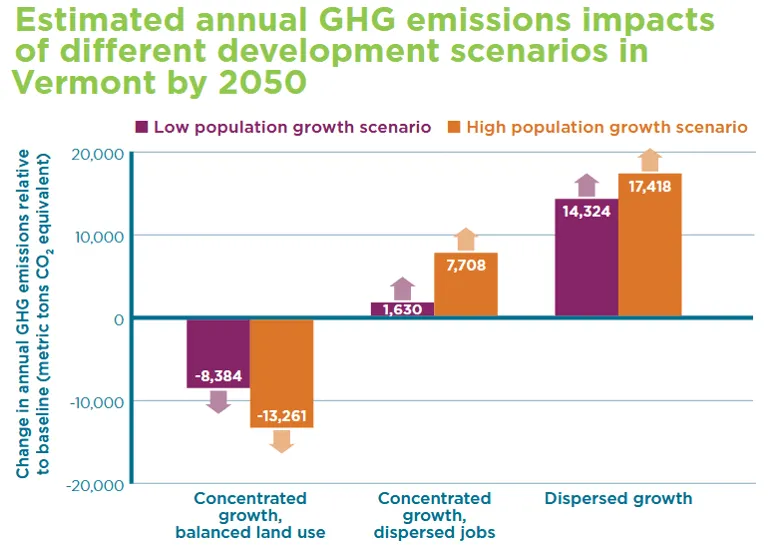
Implementing “smart growth” strategies can help ensure that Vermont communities are built with energy needs and demands in mind (Figure 8-9; see Community Development 11.6.3). This strategy directs new developments to be within designated centers, focusing on compact settlement, and thereby protecting Vermont's rural landscape from urban sprawl. Compact settlement can help save money and energy on transportation and utility infrastructure, as these are more challenging and expensive to build and maintain in rural, sparsely populated areas (see Community Development 11.3). Housing programs like the Neighborhood Development Area offer incentives to encourage new housing development within designated centers. GHG emissions vary based on different types of growth (i.e., dispersed, concentrated with balanced land use, concentrated with dispersed jobs) and whether that growth occurs in high or low population growth scenarios. The scenario with the least GHG emissions are the two population growth scenarios (low or high), where growth is concentrated and land is used in a balanced way (Figure 8-9, Energy Action Network, 2024).
Source: Energy Action Network (2024)
Demand forecast
Vermont’s energy demand is expected to increase due to increased cooling demand during warm months, and more electricity will be necessary to electrify Vermont's thermal and transportation sectors (see 8.4.3). As outlined in the CAP and the CEP, Vermont has plans to increase the number of fast charging stations, EVs in use, and incentives for using EVs through state-sponsored programs like Electrify Your Fleet (Vermont Climate Council, 2025; Vermont Department of Public Service, 2025).
Vermont’s ambitious goals, set in place by the CEP, aim to increase energy efficiency and resilience while expanding sourcing from renewable energy sources, which both help to offset future demand increases. Energy companies including Vermont Electricity Cooperative (VEC) and Burlington Electric Department (BED) alongside the state utility (Efficiency Vermont) have certain programs and recommendations (e.g., VEC: Beat the Peak, BED: Defeat the Peak) for consumers to reduce electricity usage during peak hours. VEC and BED customers can sign up for these programs and receive alerts during peak times, so they know when to reduce use. This saves the companies and customers money on electricity. BED offers to relay to those participating in the program how much they saved, and they are committed to giving a portion of the money saved to charity organizations.
Box 8-2: Climate Superfund Act
The Vermont Climate Superfund Act of 2024 allows the state to pursue compensation from fossil fuel companies for their role in the impacts of climate change (Vermont Climate Council, 2025). Vermont is the first state to pass a bill like this; New York adopted a similar law following Vermont. The preliminary assessment of costs (1995–2024) will assess the monetary costs of GHG emissions from fossil fuel extraction and refinement, and will include costs necessary to “respond to, avoid, moderate, repair, or adapt to negative impacts caused by climate change and to assist human and natural communities, households, and businesses in preparing for future climate-change-driven disruptions” (Act 122 of 2024). The funds will go towards supporting climate adaptation projects in the state. The cost report will be published by January 15, 2027. President Trump signed an executive order called “Protecting American Energy from State Overreach” in April, 2025 that challenged state laws like this one. If this Act is determined to be a hinderance to domestic energy production, it may be overridden by the executive order.
8.5.2 Energy equity
Energy equity and poverty
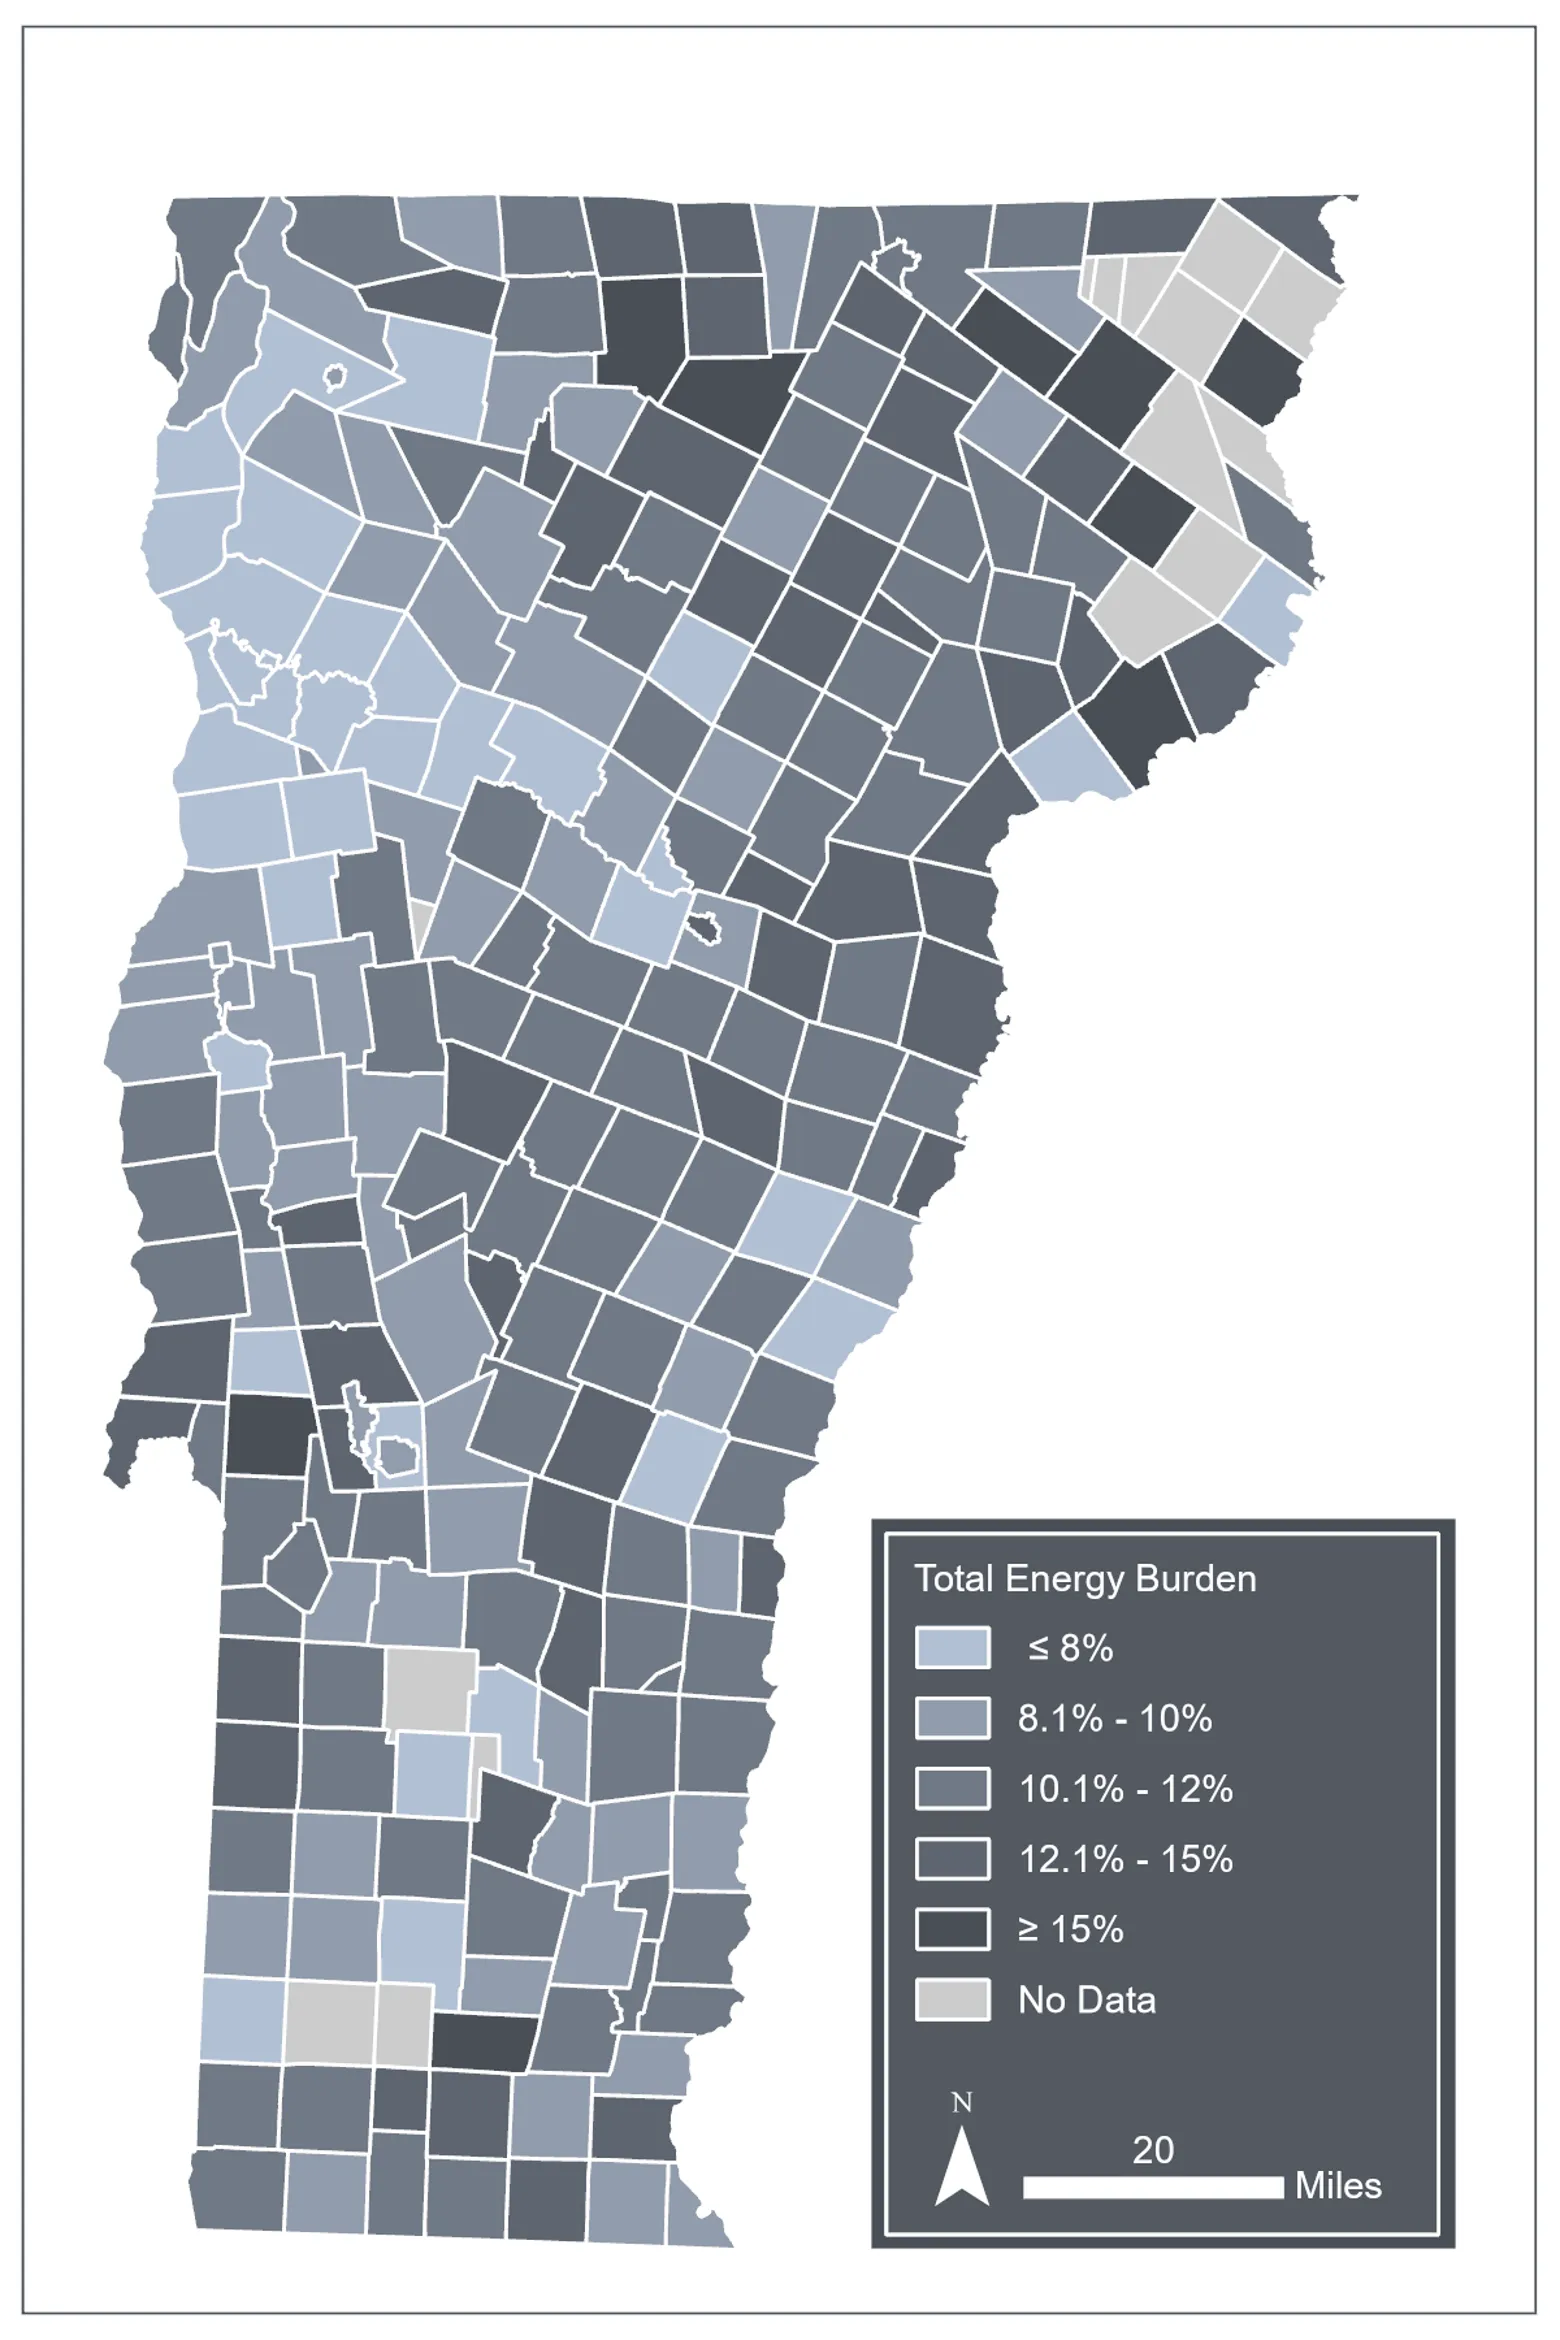
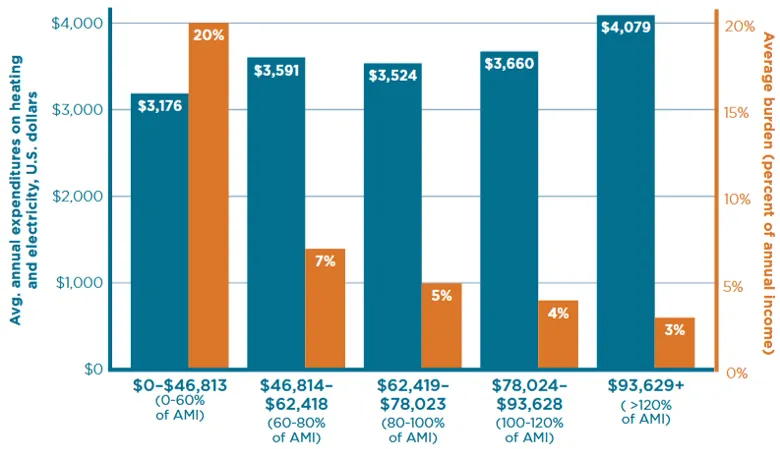
Energy burdens (i.e., the percentage of household income spent on energy) in Vermont are unequally distributed, causing some to experience energy poverty. Low-income Vermonters and those living in more rural areas, like the Northeast Kingdom, spend more of their gross annual income on energy costs, while using less energy than higher income residents whose energy burden is lower (Figure 8-10 and Figure 8-11). On average, Vermont residents spend 11% of their gross annual income on energy costs, including heating, electricity, and transportation (Sears & Lucci, 2023). Low-income or rural residents spend 15–20% more of their gross annual income on energy expenses (Sears & Lucci, 2023). For Vermont residents with less discretionary income, heating and cooling their homes may take higher priority than food or other necessities, or vice versa, leading to unsafe sacrifices and tradeoffs (see Human Health 10.10). This means that some Vermonters, due to their high energy burden, cannot keep their home at a comfortable temperature, resulting in energy poverty. Many homes in more rural areas are also older and likely less energy efficient (see Infrastructure 7.4.2). Additionally, higher energy transport costs may raise energy expenses for rural homeowners (see 8.3.2). Vermont must account for these socioeconomic and geographic disparities while planning for a more sustainable and climate resilient energy future.
Source: Efficiency Vermont (2023)
Note: Visualization by Hannah C. Turner
Source: Energy Action Network (2025)
Recent energy-equity policies
Programs such as Vermont's Weatherization Assistance Program (WAP) and Efficiency Vermont Home Energy Loan seek to improve energy-equity by increasing access to resources for weatherization of homes and purchase and installation of heat pumps for low- and moderately low-income residents (Vermont Energy Saver, 2025). These programs decrease energy consumption, which could benefit households with high energy burdens. However, programs like these need more support to be widespread and impactful, including increased and sustained funding sources and outreach to attract more participants. The weatherization program is facing some logistical problems, such as long waitlists and complexities when homes require additional repairs before weatherization. This requires time and money and is especially difficult in some homes due to Vermont's strict building and zoning regulations. If homes are considered to have “historical value,” it may be even harder to complete the necessary repairs and construction to begin the process of weatherization through regulations of historical facades, window replacements, and matching materials (VT Agency of Commerce and Community Development, 2026). The loan program also has its drawbacks, with some Vermonters reporting administrative hurdles and confusion about the application process (Energy Action Network, 2024).
Vermont’s 2020 GWSA mandates that equity is incorporated into all recommendations given by the CAP (Vermont Climate Council, 2025). The Vermont Climate Council subcommittee on “Just Transitions” was established to see this carried out. To achieve a “just transition” from carbon and fossil fuel use to renewable sources, Vermont must provide equitable access to the tools needed to complete this transition, as well as extra support for those who may be at a disadvantage due to socio-economic factors. This subcommittee provides a space for people of marginalized communities to speak and be heard. The subcommittee aims for widespread public engagement about climate issues as well as to generate conversations surrounding equity. However, this subcommittee has expressed time and compensation challenges with centering equity through public participation (Vermont Climate Council, 2025). These challenges must be addressed to ensure adequate representation without amplifying stress on underrepresented communities.
Increasing sustainable and climate resilient energy sources will help reduce Vermont's overall carbon footprint; however, these energy sources can be less accessible to lower income residents. Further, some sustainable energy sources can be more expensive (e.g., electric heat pumps) increasing energy burdens (Table 8‑4). Despite solar having the lowest long-term cost, it requires updated roofing, homeownership (renters typically cannot install solar), and high upfront installation costs, making it an inaccessible option for lower income residents.
Heating source | Typical fuel/ energy cost | Approx. cost per delivered MMBtu | Notes |
|---|---|---|---|
| Natural Gas | ~$1.40 per hundred cubic feet | ~$15/MMBtu | Lowest-cost fossil fuel option where available; limited VT access |
| Electric Heat Pump | ~$0.18–$0.22 per kWh | ~$18–$22 | Highly efficient; cost rises during very cold weather |
| Cordwood / Firewood | ~$225 per cord | ~$17–$20 | Cheapest if self-harvested; labor-intensive |
| Fuel Oil | ~$3.70 per gallon | ~$35–$38 | High price volatility; common in older homes |
| Wood Pellets | ~$300 per ton | ~$34–$38 | More convenient than cordwood; requires electricity |
Heating source | Typical fuel/ energy cost | Approx. cost per delivered MMBtu | Notes |
| Propane | ~$3.00 per gallon | ~$30–$33 | Common in rural VT; winter price spikes |
| Solar (photovoltaic) + Heat Pump | ~$0.06–$0.10 per kWh (levelized) | ~$6–$10 | Lowest long-term cost; high upfront investment |
Sources: Energy Action Network (2024), Vermont Department of Public Service (2025, 2026)
8.7 References
7D Brand Studio. (2024, March 4). Grid resilience and efficient transportation. Efficiency Vermont. https://www.efficiencyvermont.com/blog/our-insights/grid-resilience-and-efficient-transportation
Aramayo, L., & Peterson, K. (2025, December 1). Hurricanes in 2024 led to the most hours without power in the United States in 10 years [US Energy Information Administration]. In-Brief Analysis. https://www.eia.gov/todayinenergy/detail.php?id=66744
Colelli, F. P., Emmerling, J., Marangoni, G., Mistry, M. N., & De Cian, E. (2022). Increased energy use for adaptation significantly impacts mitigation pathways. Nature Communications, 13(1), 4964. https://doi.org/10.1038/s41467-022-32471-1
Cui, A., Parker, E., & Akella, P. (2025). A Review of Home Heating Energy Efficiency in Vermont [Policy Brief]. Nelson A. Rockfeller Center for Public Policy and the Social Sciences. https://legislature.vermont.gov/Documents/2026/Workgroups/Senate%20Natural%20Resources/Energy/W~Alan%20Cui~A%20Reveiw%20of%20Ho…
Department of Energy. (2023a). Alternative Fuels Data Center. https://afdc.energy.gov/transatlas
Department of Energy. (2023b, October 19). What does it take to modernize the U.S. electric grid? Energy.Gov. https://www.energy.gov/gdo/articles/what-does-it-take-modernize-us-electric-grid
Department of Energy. (2025). Electric Vehicle Charging Stations. Alternative Fuels Data Center. https://afdc.energy.gov/fuels/electricity-stations
Do, V., Wilner, L. B., Flores, N. M., McBrien, H., Northrop, A. J., & Casey, J. A. (2025). Spatiotemporal patterns of individual and multiple simultaneous severe weather events co-occurring with power outages in the United States, 2018–2020. PLOS Climate, 4(1), e0000523. https://doi.org/10.1371/journal.pclm.0000523
Dockser, C. (2024, May 22). Vermonters greet hotter summers with more A/C. Vermont Public. https://www.vermontpublic.org/local-news/2024-05-22/vermonters-greet-hotter-summers-with-more-a-c
Dowds, J. (2024, July 10). Getting the most from Vermont’s hydro power. Brattleboro Reformer. https://www.reformer.com/opinion/columnists/commentary-jonathan-dowds-getting-the-most-from-vermont-s-hydro-power/article_1a466…
Drive Electric Vermont. (2026). April 2026 EV Registration Updates. https://www.driveelectricvt.com/uploads/media/Documents/Maps/vt_ev_registration_trends.pdf
Efficiency Vermont. (2023). 2023 Energy Burden Report: Burden & Spending by Town. https://veic.maps.arcgis.com/apps/instant/portfolio/index.html?appid=9cfe7ff7061348e7a1b2e3d68bb34de5
EIA. (2024, December). Independent Statistics and Analysis. US Energy Information Administration. https://www.eia.gov/state/?sid=VT#
EIA. (2025a). 2024 Average Monthly Bill-Residential [Dataset]. https://www.eia.gov/electricity/sales_revenue_price/pdf/table_5A.pdf
EIA. (2025b). Electric Power Monthly. US Energy Information Administration. https://www.eia.gov/electricity/monthly/epm_table_grapher.php?t=epmt_5_6_a
Energy Action Network. (2024). Annual Progress Report for Vermont 2024: On Emissions, Energy, Equity, and the Economy. Energy Action Network. https://eanvt.org/wp-content/uploads/2025/05/EAN-APR-2024-updatedMay2025.pdf
Energy Action Network. (2025). Annual Progress Report for Vermont 2025: On Energy, Affordability, and Emissions. Energy Action Network. https://eanvt.org/wp-content/uploads/2025/10/Final_EAN-APR-2025.pdf
Espeland, S., & Rowangould, D. (2024). Rural travel burdens in the United States: Unmet need and travel costs. Journal of Transport Geography, 121, 104016. https://doi.org/10.1016/j.jtrangeo.2024.104016
Fant, C., Boehlert, B., Strzepek, K., Larsen, P., White, A., Gulati, S., Li, Y., & Martinich, J. (2020). Climate change impacts and costs to U.S. electricity transmission and distribution infrastructure. Energy, 195, 116899. https://doi.org/10.1016/j.energy.2020.116899
Fuso Nerini, F., Adshead, D., Thacker, S., Pant, R., & Hall, J. W. (2025). Breaking the cycle of underinvestment in climate-resilient energy infrastructure. Nature Energy, 10(11), 1291–1292. https://doi.org/10.1038/s41560-025-01868-9
Gaffney, A. (2025, June 30). The clean heat standard is dead. What comes next? VTDigger. https://vtdigger.org/2025/06/30/the-clean-heat-standard-is-dead-what-comes-next/
Ge, M., Friedrich, J., & Vigna, L. (2024, December 5). Where Do Emissions Come From? 4 Charts Explain Greenhouse Gas Emissions by Sector. World Resources Institute. https://www.wri.org/insights/4-charts-explain-greenhouse-gas-emissions-countries-and-sectors
Guddanti, K. P., Chen, L., Weng, Y., & Yu, Y. (2025). Vulnerability of power distribution networks to local temperature changes induced by global climate change. Nature Communications, 16(1), 5116. https://doi.org/10.1038/s41467-025-59749-4
Hodge, T. (2020, February 21). Hourly electricity consumption varies throughout the day and across seasons. U.S. Energy Information Administration (EIA). https://www.eia.gov/todayinenergy/detail.php?id=42915
ISO New England. (2025a). 2024 Annual Markets Report. Internal Market Monitor of ISO New England. https://www.iso-ne.com/static-assets/documents/100023/2024-annual-markets-report.pdf
ISO New England. (2025b). Solar Power Impact. https://www.iso-ne.com/about/where-we-are-going/solar-power-impact
Jones-Albertus, B. (2017, October 12). Confronting the Duck Curve: How to Address Over-Generation of Solar Energy. Energy.Gov. https://www.energy.gov/cmei/articles/confronting-duck-curve-how-address-over-generation-solar-energy
Kelly-Gorham, M. R. (2021). Energy. In G. L. Galford, J. Faulkner, L.-A. Dupigny-Giroux, S. Posner, & L. Edling (Eds.), The Vermont Climate Assessment 2020. Gund Institute of Environment, University of Vermont. https://site.uvm.edu/vtclimateassessment/files/2022/08/VCA-Chapter-6-8-1-22.pdf
Leung, C. K., Ko, J., & Guo, C. (2025). Weathering the storm: Analyzing the impact of extreme climate events on energy consumption across 141 countries. Innovation and Green Development, 4(3), 100255. https://doi.org/10.1016/j.igd.2025.100255
Lu, S., Dai, W., Tang, Y., & Guo, M. (2020). A review of the impact of hydropower reservoirs on global climate change. Science of The Total Environment, 711, 134996. https://doi.org/10.1016/j.scitotenv.2019.134996
Mahmood, A., Javaid, N., Khan, M. A., & Razzaq, S. (2015). An overview of load management techniques in smart grid. International Journal of Energy Research, 39(11), 1437–1450. https://doi.org/10.1002/er.3350
McGuire, P. (2025, September 15). New England hydropower generation slows amid drought. Vermont Public. https://www.vermontpublic.org/2025-09-15/new-england-hydropower-generation-slows-amid-drought
Poor, T. (2025, February 14). Vermont Electricity Policies and Programs Overview [Senate Committee on Natural Resources and Energy]. https://legislature.vermont.gov/Documents/2026/Workgroups/Senate%20Natural%20Resources/Energy/W~TJ%20Poor~Electrification%20in%…
PowerOutage.report. (2026). Vermont Power Outage Statistics (2000—2023). https://poweroutage.report/vt
Public Utility Commission. (2025, March 1). Clean Heat Standard. https://puc.vermont.gov/clean-heat-standard
Ritchie, H. (2022). Primary, secondary, final, and useful energy: Why are there different ways of measuring energy? Our World in Data. https://ourworldindata.org/energy-definitions
Sadoff, K. (2023, July 24). Vermont’s heat and energy landscape over the past decade. Burlington Free Press. https://www.burlingtonfreepress.com/story/news/2023/07/24/vermont-heat-data-and-energy-peak-load-data-of-the-past-10-years/7039…
Saki, S., Sofia, G., Kar, B., & Anagnostou, E. (2025). A multi-year analysis of the impact of heatwaves and compound weather events on power outages. Scientific Reports, 15(1), 30846. https://doi.org/10.1038/s41598-025-15065-x
Sears, J., & Lucci, K. (2023). 2023 Vermont Energy Burden Report. Efficiency Vermont. https://www.efficiencyvermont.com/Media/Default/docs/landing-pages/energy-burden-report/2023-EfficiencyVermont-EnergyBurdenRepo…
Tran, H., Juno, E., & Arunachalam, S. (2023). Emissions of wood pelletization and bioenergy use in the United States. Renewable Energy, 219, 119536. https://doi.org/10.1016/j.renene.2023.119536
USA Facts. (2025, June 7). Mapped: Electric Vehicles Per Capita by U.S. State. Visual Capitalist. https://www.visualcapitalist.com/cp/mapped-electric-vehicles-per-capita-us-states/
USGCRP. (2023). Fifth National Climate Assessment (No. 5th). U.S. Global Change Research Program. https://nca5.climate.us/downloads/NCA5_2023_FullReport.pdf
Vermont Climate Council. (2025). Vermont Climate Action Plan 2025. https://outside.vermont.gov/agency/anr/climatecouncil/Shared%20Documents/Vermont_Climate_Council/CAP2025_ChapterDrafts/ClimateA…
Vermont Department of Public Service. (2022). 2022 Vermont Comprehensive Energy Plan. State of Vermont. https://publicservice.vermont.gov/sites/dps/files/documents/2022VermontComprehensiveEnergyPlan_0.pdf
Vermont Department of Public Service. (2025). 2025 Annual Energy Report: Vermont’s Energy Supply and Demand | Summary of Progress Toward Comprehensive Energy Plan Goals. State of Vermont. https://legislature.vermont.gov/assets/Legislative-Reports/2025-Annual-Energy-Report-1.15.pdf
Vermont Department of Public Service. (2026). 2026 Annual Energy Report: Vermont’s Energy Supply and Demand | Key Insights, Recommendations, and Data on Vermont’s Energy Sectors. State of Vermont. https://legislature.vermont.gov/assets/Legislative-Reports/2026-Annual-Energy-Report.pdf
Vermont Electric Cooperative. (2024, January 31). 2023 Electricity Outage Report. https://vermontelectric.coop/client_media/files/2023_VEC_4.900_Report.pdf
Vermont Energy Saver. (2025). Rebates & Financial Incentives. VT Department of Public Service. https://energysaver.vermont.gov/programs-incentives/rebates-financial-incentives
VT Agency of Commerce and Community Development. (2022). VT Electric Vehicle Charging Stations [Feature Layer]. https://geodata.vermont.gov/datasets/4a1269df312d43f7aa17d16147bb24ae_22/explore?location=43.895319,-72.685624,7
VT Agency of Commerce and Community Development. (2026). Preservation Laws and Regulations. https://accd.vermont.gov/historic-preservation/resources-rules/laws-regulations
Wasti, A., Ray, P., Wi, S., Folch, C., Ubierna, M., & Karki, P. (2022). Climate change and the hydropower sector: A global review. WIREs Climate Change, 13(2), e757. https://doi.org/10.1002/wcc.757
Weather Spark. (2025). Burlington Climate, Weather By Month, Average Temperature (Vermont, United States). https://weatherspark.com/y/24985/Average-Weather-in-Burlington-Vermont-United-States-Year-Round
Weinstein, E. (2024, August 9). As high winds and rain hit Vermont, more than 48,000 customers lose power. VTDigger. https://vtdigger.org/2024/08/09/as-high-winds-and-rain-hit-the-state-more-than-24000-vermonters-lose-power/
Yalew, S. G., van Vliet, M. T. H., Gernaat, D. E. H. J., Ludwig, F., Miara, A., Park, C., Byers, E., De Cian, E., Piontek, F., Iyer, G., Mouratiadou, I., Glynn, J., Hejazi, M., Dessens, O., Rochedo, P., Pietzcker, R., Schaeffer, R., Fujimori, S., Dasgupta, S., … van Vuuren, D. P. (2020). Impacts of climate change on energy systems in global and regional scenarios. Nature Energy, 5(10), 794–802. https://doi.org/10.1038/s41560-020-0664-z
Young, S. S., & Young, J. S. (2025). Decreasing Snow Cover and Increasing Temperatures Are Accelerating in New England, USA, with Long-Term Implications. Climate, 13(12), 246. https://doi.org/10.3390/cli13120246