Policy Briefs and Fact Sheets
Vermont Traffic Safety Toolbox Fact Sheet
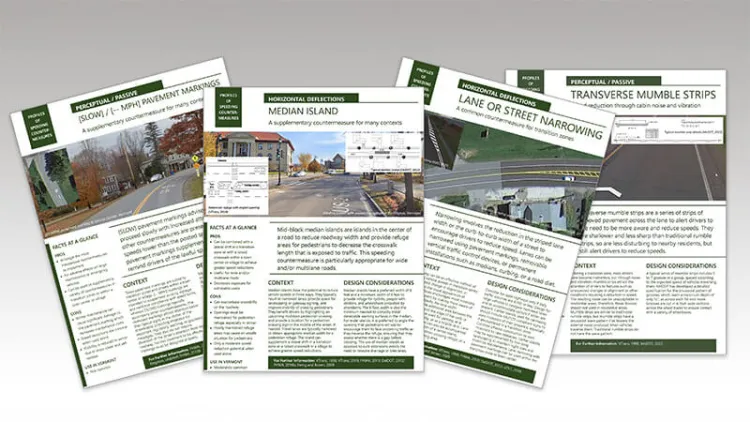
Speeding on local and state-maintained town highways is a major contributor to traffic fatalities in Vermont. In 2018, over half of all fatal crashes on local and collector roadways were speeding-related. The Speed Countermeasures Toolbox developed by the TRC for the Vermont Agency of Transportation provides resources and guidance to small and rural communities to help them select and implement speeding countermeasures that will be both effective and appropriate for their needs.
Mileage Fees: An Equitable and Financially Viable Alternative to the Gas Tax
In the United States, mileage fees, or road user charges, are being explored as an alternative to motor fuel taxes, often called “gas taxes.” The search for alternatives is motivated by rising fuel efficiency standards and the increasing number of electric vehicles on the road. These factors have diminished the revenue-generating capacity of gas taxes. While mileage fees are a more stable and fuel-agnostic transportation funding source, they face criticism and low levels of public support due to concerns about costs, protection of drivers’ location and privacy, and perceptions that they would raise taxes on low-income and rural households.
Researchers from the University of Vermont Transportation Research Center used data from over 360,000 Vermont vehicles to assess the financial and equity impacts of replacing the Vermont state gas tax with a revenue-neutral mileage fee of 1.5 cents per mile. The researchers then surveyed 623 car drivers in northern New England and 2,114 drivers around the US, before and after offering them an educational experience about mileage fees. The educational experience included videos and quiz-style questions. It covered reasons for a switch to mileage fees, fairness across income and community types, and a personalized cost comparison between the gas tax and mileage fee, based on each respondent’s vehicle and travel information. This brief summarizes the findings from that research and provides implications for the field.
Evaluation of the Safety of Pedestrian Crossing Treatments in Small and Rural Communities
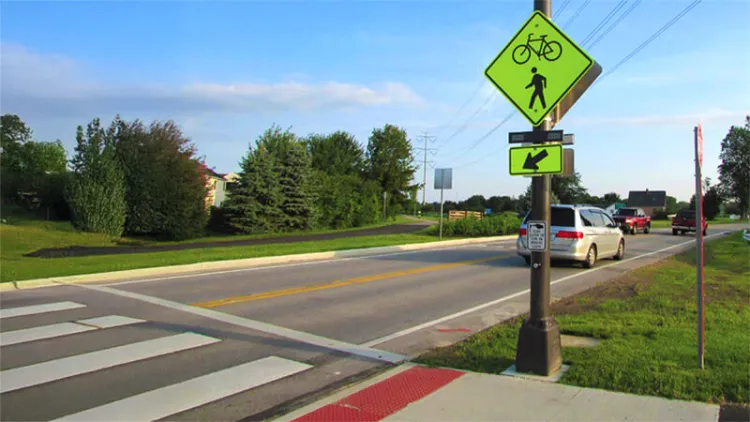
Rural areas often lack adequate pedestrian infrastructure, resulting in elevated safety risks for pedestrians. The combination of higher speed limits and reduced driver awareness amplifies the potential for pedestrian collisions when crossing the roadway.
This study addresses uncertainty about the effectiveness of rectangular rapid flashing beacons (RRFBs) and LED-embedded signs (LESs) as potential safety interventions. RRFBs and LESs are both pedestrian crossing treatments that allow pedestrians to activate lights to alert drivers of their intent to cross. RRFBs include horizontal LED lights mounted to the sign pole, while LESs include LEDs embedded in the edge of the sign.
Mode Constrained Travel at UVM: Travel Preferences, Barriers, and Policy Implications
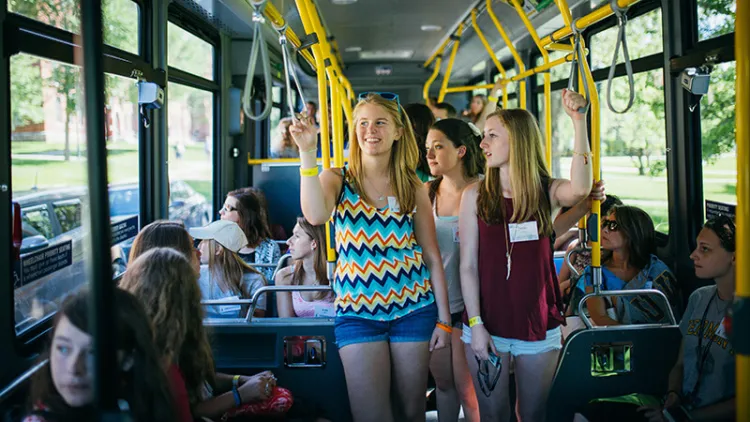
One of the objectives of the Chittenden Area Transportation Management Association (CATMA) is to encourage commuters to shift from driving to more sustainable travel modes such as walking, bicycling, and public transit. To understand barriers to switching to greener modes among UVM employees, we evaluated CATMA’s 2019 Transportation Survey to compare the modes that UVM employees currently use to the modes that they prefer to use. We also identify barriers to switching to preferred travel modes. The results show untapped potential for divesting from driving, with respondents citing several mitigable barriers.
Vermont Mileage Fee Rate Setting Brief

This 2-page policy brief provides a summary of findings and recommendations from the University of Vermont Transportation Research Center report "Rate-setting and Impact Analysis for the Vermont Mileage-based User Fee" prepared for the Vermont Agency of Transportation.Vermont Mileage Fee Rate Setting Policy BriefRate-setting and Impact Analysis for the Vermont Mileage-based User Fee
Tools
Transportation Sustainability Tracking Tool
The Transportation Sustainability Tracking Tool provides key metrics for evaluating the sustainability of household travel across Chittenden County, Vermont, and tracking trends over time. The tool allows users to evaluate changes in greenhouse gas emissions, transportation energy use, and travel demand (the amount of driving) at the vehicle, household, and person level at many different geographic scales. The intended purpose of the tool and the metrics provided is to enable evaluations of progress towards transportation sustainability and climate goals in the region. The tool enables users to see where changes are occurring and the pace of those changes.
Transit Center Equity Dashboard
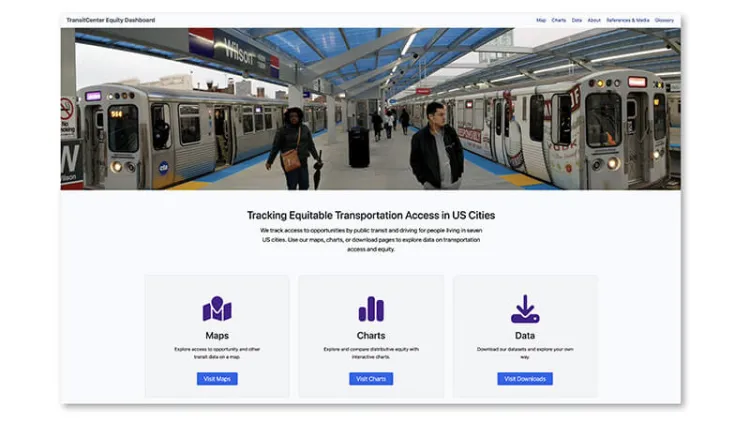
This interactive web dashboard illustrates how well transit systems in seven U.S. cities provide service to essential destinations, including jobs, medical care, grocery stores, and more. The dashboard tracks service across communities and populations over time from February 2020 through the present, illuminating existing disparities and tracking progress toward equity. The dashboard includes interactive maps, informative charts, a fare calculation tool, and data downloads, allowing transit agencies and transit riders to identify and address critical service needs. The dashboard was funded by TransitCenter and was created by UVM TRC researchers Dana Rowangould and Mitchell Robinson, along with researchers at the University of Texas Austin and the University of Toronto.
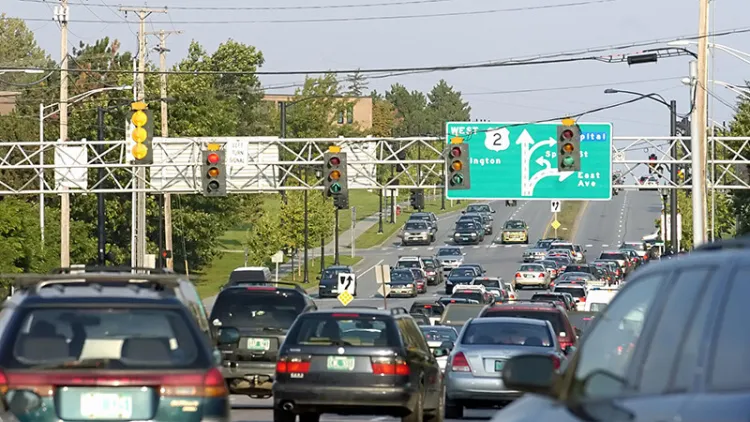
Near-Roadway Mobile Source Exposure Tool

Vehicle traffic is one of the largest sources of air pollution in the United States and contributes to numerous well-established public health problems, including increased risk of cancer and death. Studies consistently show that people living closest to heavily trafficked roads and truck routes - who are disproportionately low-income individuals and people of color - face higher exposure to these harmful emissions. This pattern reflects a widespread, national-scale environmental inequity. Using high-resolution, national data, our novel tool shows nitrous oxide (NOX) and fine particulate matter (PM2.5) concentrations from light-, medium, and heavy-duty vehicle traffic occurring on most public roadways at a 200m resolution across the entire United States. This granularity allows users to explore detailed exposure disparities near major roadways, truck routes, and other heavily trafficked areas.