Project Overview
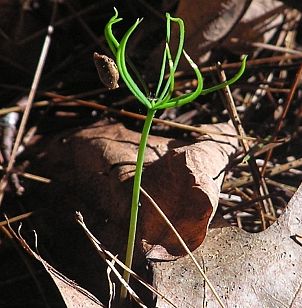
Holt Research Forest S-1 plots are located within and on the southern edge of the S-10 lines. They form two 600 m long strips across the study area, and cover a total of 1200 m2. Plots are numbered from 1 to 600 and listed as being north (quadrats 3E1 to 8E2) or south (quadrats 3I3 to 8I4). A tree seedling count is conducted on the 1m2 plots to provide information on the regeneration of the forest. All S-1 plots were measured in the 1986 field season; every fifth plot (1,6,11, etc.) is measured each subsequent year.
Objectives
Dataset Availability
Downloadable: 1 dataset
See the full list of available dataTags
Status - Active
Start date: 1986-05-01
Anticipated end date: 2017-05-01
Study Area

Loading...