Sentinel Streams
Long Term Biological Monitoring at Reference Streams
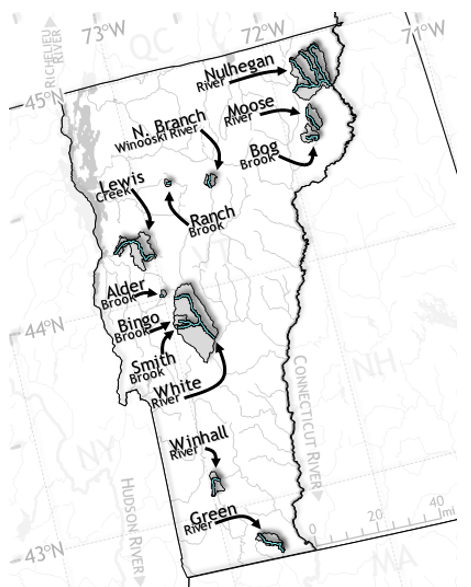
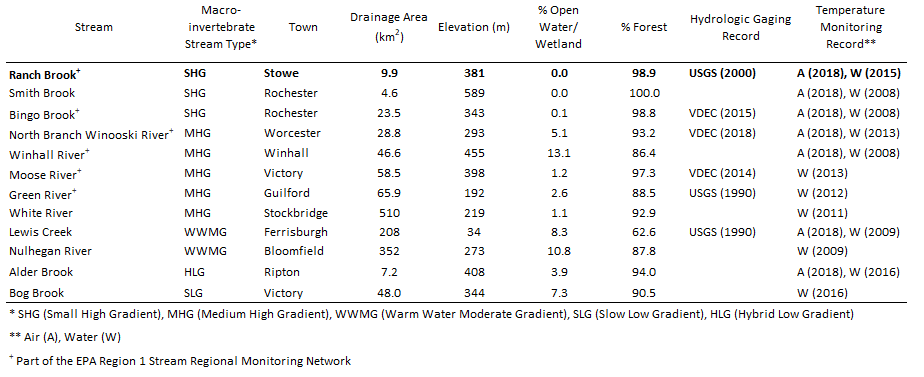
The Vermont Department of Environmental Conservation (VTDEC) conducts long term monitoring at twelve “sentinel” streams in Vermont. These reference streams are widely variable in terms of size (4.6-510 km2), elevation (34-589 m) and geographical separation. Most are in watersheds that have substantial protected lands, such as Green Mountain National Forest or Vermont Wildlife Management Areas, and all but one has a watershed with greater than 90% combined forest and wetland (based on 2016 land use/land cover data, Table 8). Six of these sentinel streams are included in the US Environmental Protection Agency (EPA) Regional Monitoring Network of high-quality reference streams throughout New York and New England (U.S. EPA 2016).
By focusing on streams with negligible prospects for development or land use change, VTDEC hopes to be able to isolate long term impacts related to climate change. Many of these streams have monitoring data going back to the 1990’s, and all are currently being monitored on an annual basis for water chemistry, physical habitat, water temperature, and macroinvertebrate community condition. Many of these sites are also being monitored for stream discharge, air temperature, and fish community composition. Through this work, VTDEC seeks to gain a better understanding of how climate-induced changes in water quality, temperature and hydrology lead to long-term alterations in biological communities.
One of DEC’s longest running sentinel streams is Ranch Brook in Stowe, VT. With a drainage area of 10 km2 and an elevation of 381 m, it is one of the smallest and most pristine sentinel streams. Ranch Brook has annual macroinvertebrate community data, and a continually operated stream gage that has been collecting data since 2000, and has served as a focal point for early analyses on the VTDEC sentinel network.
The Data
VTDEC biologists collect macroinvertebrate community samples from stream reaches during an annual index period that runs from September 1st through mid-October. Utilizing this relatively short period of time allows for insects and other invertebrates to be captured at comparable sizes and life stages each year. Samples are sorted and identified in the laboratory, and biologists use population data, as well as several community variables (called metrics) to assess stream health. These metrics cover many aspects of community structure and function, including density, biodiversity, tolerance to pollution and ecological feeding habits.
Metric values are compared to established thresholds determined from historical statewide data. VTDEC recognizes five stream community types that result from variation in stream size, gradient, and habitat; Small High Gradient (SHG), Medium High Gradient (MHG), Warm Water Moderate Gradient (WWMG), Hybrid Low Gradient (HLG), and Slow Low Gradient (SLG). Metric thresholds can vary by stream type, and outcomes are used to determine an assessment rating for community health, using a tiered scale ranging from Poor to Excellent (VTDEC, 2017). Ratings of Very Good to Excellent represent communities at or near the expected natural condition. In addition to assessment ratings, this report focuses on three key macroinvertebrate metrics used in assessment determinations. Ephemeroptera, Plecoptera and Trichoptera (EPT) Richness is a measure of the diversity of water quality sensitive taxa (Ephemeroptera, Odonata and Trichoptera (EOT) richness is used in low gradient streams). Total Density is the number of organisms per square meter. Previous analyses at sentinel sites show that this metric reacts strongly and quickly to extreme flow events. Biotic Index (BI) is a metric that demonstrates the macroinvertebrates community’s sensitivity to pollution and/or enrichment, and is correlated with stream thermal regimes (Hilsenhoff 1987; Hilsenhoff 1988).
Climate change is predicted to cause increased average air temperatures and an increase in the frequency of heavy precipitation events (Henson 2019, Easterling et al. 2017). In turn, it is expected that this will lead to warmer stream temperatures and more variability in discharge, including drought conditions and increased extreme flow events. In addition to annual information on macroinvertebrate community health, a primary focus at sentinel streams has been the collection of temperature and hydrological data. Several sentinel sites have been co-located with USGS gauging stations, and VTDEC has installed stream gages on several others. VTDEC biologists have also begun to use time-lapse cameras to help to visually monitor flow levels, and to track the mobilization of substrate during high flow events. Year-round water temperature data is collected at all twelve sentinel sites, in addition to riparian air temperature at ten locations.
2018 in Summary
Figure 28 shows the 2018 results for overall assessment ratings, as well as the results for three key metrics used to assess biological condition. Sentinel sites are grouped by stream type and are compared to average results from a statewide survey of randomly selected streams sampled from 2013 to 2017. Threshold values indicating minimum criteria for “Good” biological condition (Class B(2); VTDEC 2017) in Vermont streams are also displayed. Results from Ranch Brook include samples taken at both the beginning and end of the 2018 fall index period.
Assessment ratings and metric values at sentinel sites are generally well above the minimum VTDEC thresholds for a robust and healthy community, and their similarity to statewide averages shows the overall high quality of streams throughout Vermont. However, higher assessment ratings of Very Good or better are generally indicative of communities at or near reference condition, and macroinvertebrates at four sentinel sites failed to meet this benchmark in 2018. Of these, the communities at the Green River and Moose River did not meet the richness values needed for higher assessment levels, and the Moose River and Winhall River had slightly elevated Biotic Index scores.
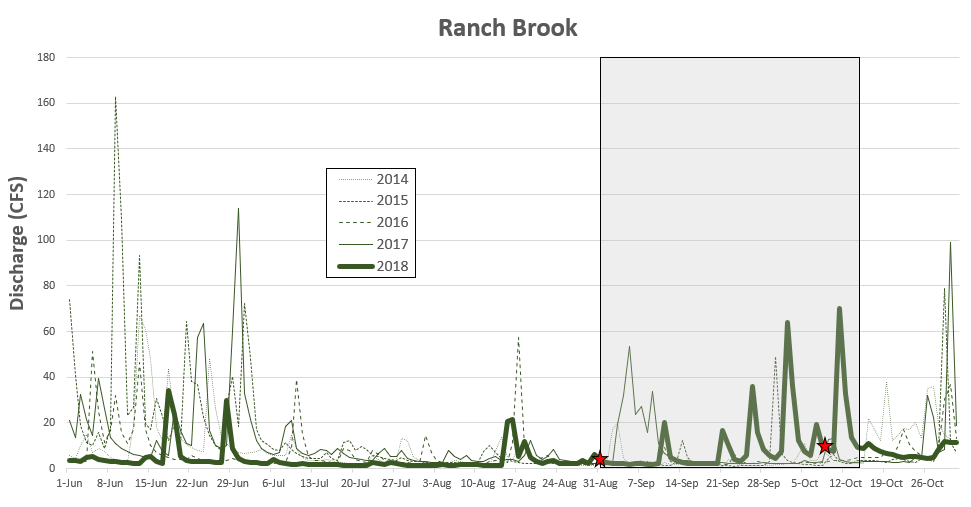
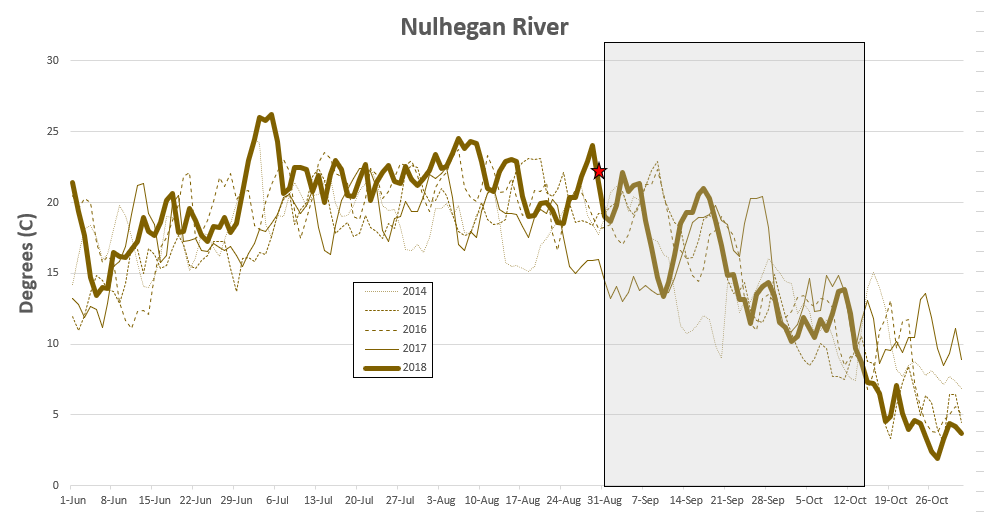
It appears that there may have been an overall decline of some metrics in 2018, compared to the previous year, most notably Biotic Index (9 of 12 sites). It has been speculated that this may have been due to very low flows as a result of summer drought-like conditions in many areas of Vermont. Stream flow data from Ranch Brook demonstrates this pattern (Figure 29). In the three months leading up to the index period, there were very few high flow events, and base flows were less than seen in recent years. Very low flows can lead to degraded water quality and habitat conditions, which in turn can decrease both insect densities and the proportion of sensitive taxa (Boulton & Lake 2008). While Ranch Brook has only recently begun being monitored for water temperature, data from other streams (like the Nulhegan River; Figure 30) show generally higher temperatures in the summer of 2018 when compared to other recent years.
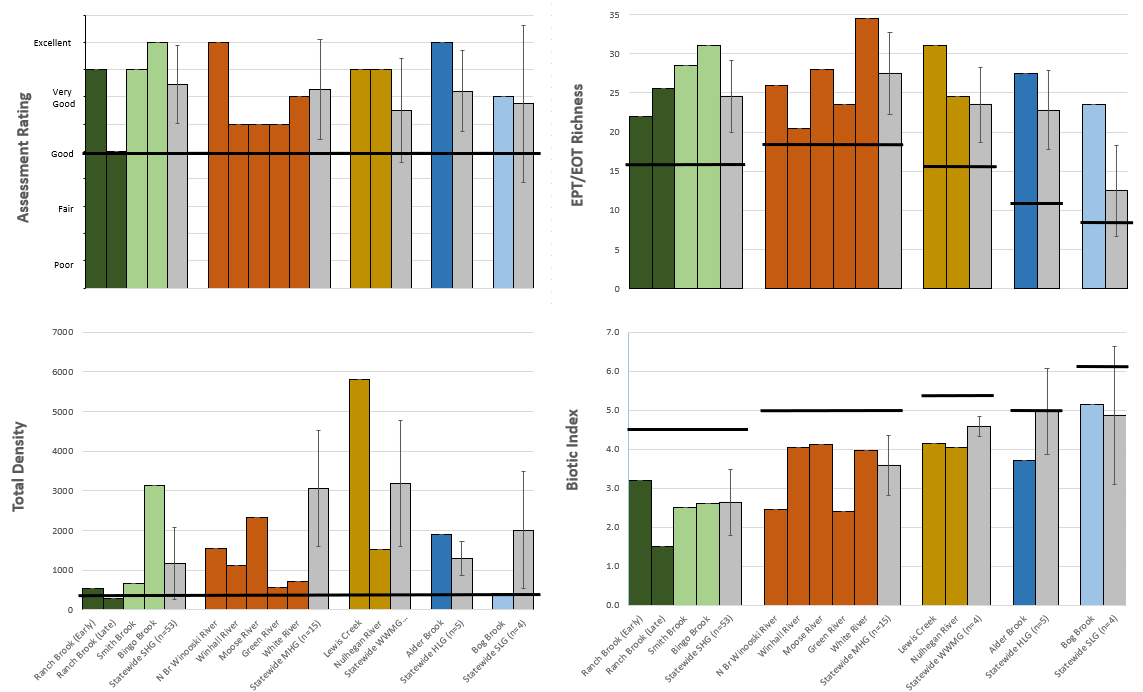
Ranch Brook, which has served as the primary case study for sentinel stream monitoring, received assessment ratings of Very Good/Excellent and Good for its two community samples in 2018. The decrease in assessment rating was a result of a change in macroinvertebrate density over that time period. Density was found to be moderate when sampled at the beginning of September (522 organisms/m2), which is common for small, low productivity streams, but was just below the minimum threshold of 300 per square meter when sampled in mid-October. It is believed that this may have been the result of a series of high flow events (following the previously mentioned low flows) in the two weeks leading up to the October sampling event, causing some of the organisms to be scoured from the substrate (Figure 29). EPT richness in the Ranch Brook samples (22 and 26, respectively) was still significantly higher than the minimum criteria (16) for small high gradient streams, suggesting that the loss of organisms did not significantly affect diversity.
Long Term Trends
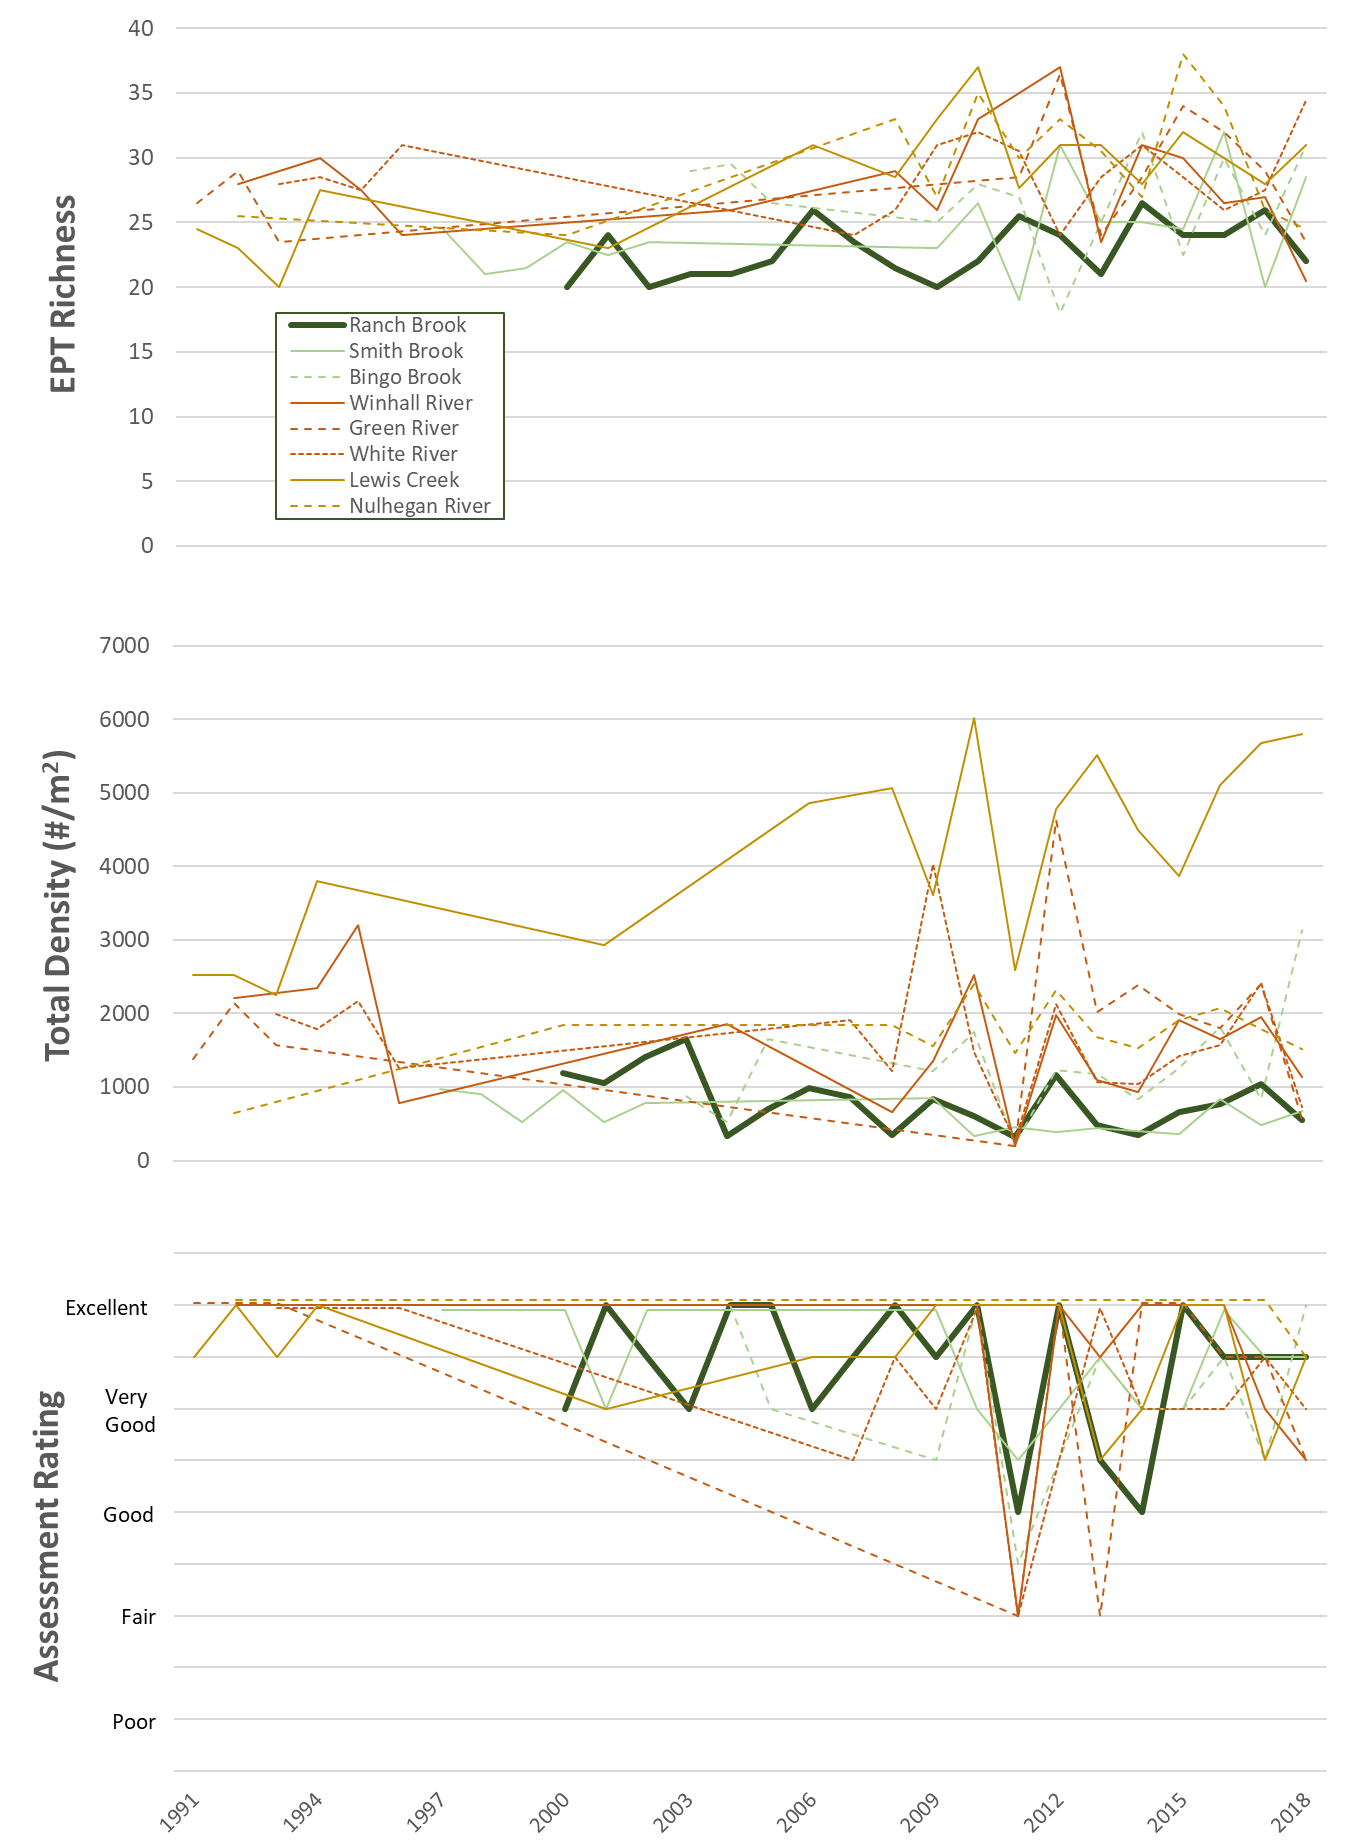
While several sentinel sites were added by VTDEC since 2012 in an effort to increase the strength of the long-term monitoring program, eight of the sites have biological monitoring data going back to 2003 or earlier (Figure 31). Through this data set, VTDEC hopes to be able to observe any emergent trends that may be related to climate change or other large-scale environmental factors.
The richness of sensitive EPT taxa appears to have remained relatively steady over time at most sentinel sites. Ranch Brook is a small and relatively low productivity stream. It has slightly lower EPT richness than most other sentinel streams, and all community samples since 2000 have had EPT richness between 20 and 26.
In contrast, macroinvertebrate density has typically shown more variability over time, and has reacted dramatically to high flow events. Tropical Storm Irene caused extreme flooding throughout Vermont in 2011, occurring immediately before the start of DEC’s fall index period. Densities dropped up to an order of magnitude at most small and medium sized sentinel streams, and assessments at these sites generally received failing ratings due to abundances below DEC’s minimum criteria. Densities rebounded in 2012, but some sites had lingering effects in subsequent years as macroinvertebrate communities continued to stabilize.
Ranch Brook experienced a series of high flow events between 2010 and 2013, with the three highest annual peak discharges on record occurring over this four-year period. This resulted in a series of lower than expected assessment ratings due to higher variability in density, Biotic Index, and distribution of feeding groups. This trend has appears to have stabilized with less extreme flow events over subsequent years, though October 2018 densities at Ranch were again lower than expected, likely due to corresponding precipitation and high flows.
Implications
It will take a much longer period of record to fully understand how long-term changes in temperature and hydrology are influencing biological communities at sentinel sites. Only Ranch Brook has a continuously paired hydrological and biological record longer than 10 years. Most sites have a water temperature record of 6 years or less. However, it is expected that, as the monitoring records increase, patterns may begin to emerge that will help to understand how changes in hydrology (i.e. extreme flow events or drought) and warming temperatures may permanently alter these stream communities. Changes in reference condition due to climatic variables may eventually alter our immediate expectations of a healthy biological community. The monitoring of these sentinel sites, and other reference streams, is essential for VTDEC’s ability to differentiate impacts caused by climate change versus more localized stressors.
Despite the limitations of the data set, some early patterns are helping our current understanding. The magnitude of flood events like that of Tropical Storm Irene can diminish biological health by dramatically reducing macroinvertebrate densities. The increased frequency of high flow events like those experienced at Ranch Brook may destabilize communities and lead to volatility in metrics and assessments over time. In an ecological context, the instability in community metrics is a direct result of changes in the populations that make up these communities. At Ranch Brook it seems apparent that the magnitude of the annual peak discharge is correlated to the relative abundance of the mayfly family Baetidae (Figure 32). Mayflies of this family are known to be early colonizers of disturbed substrates. In contrast, very low flow conditions may increase stream temperatures and alter macroinvertebrate communities in other ways. Many species that depend on colder water may begin to be lost from these communities as average stream temperatures rise, leading to an assemblage of more tolerant taxa. Understanding the population dynamics and life history traits of species that vary with these climatic variables will be essential, and VDEC seeks to further explore these questions.
It appears that very low flows at many streams in 2018 may have led to increased stream temperature, and altered macroinvertebrate communities.
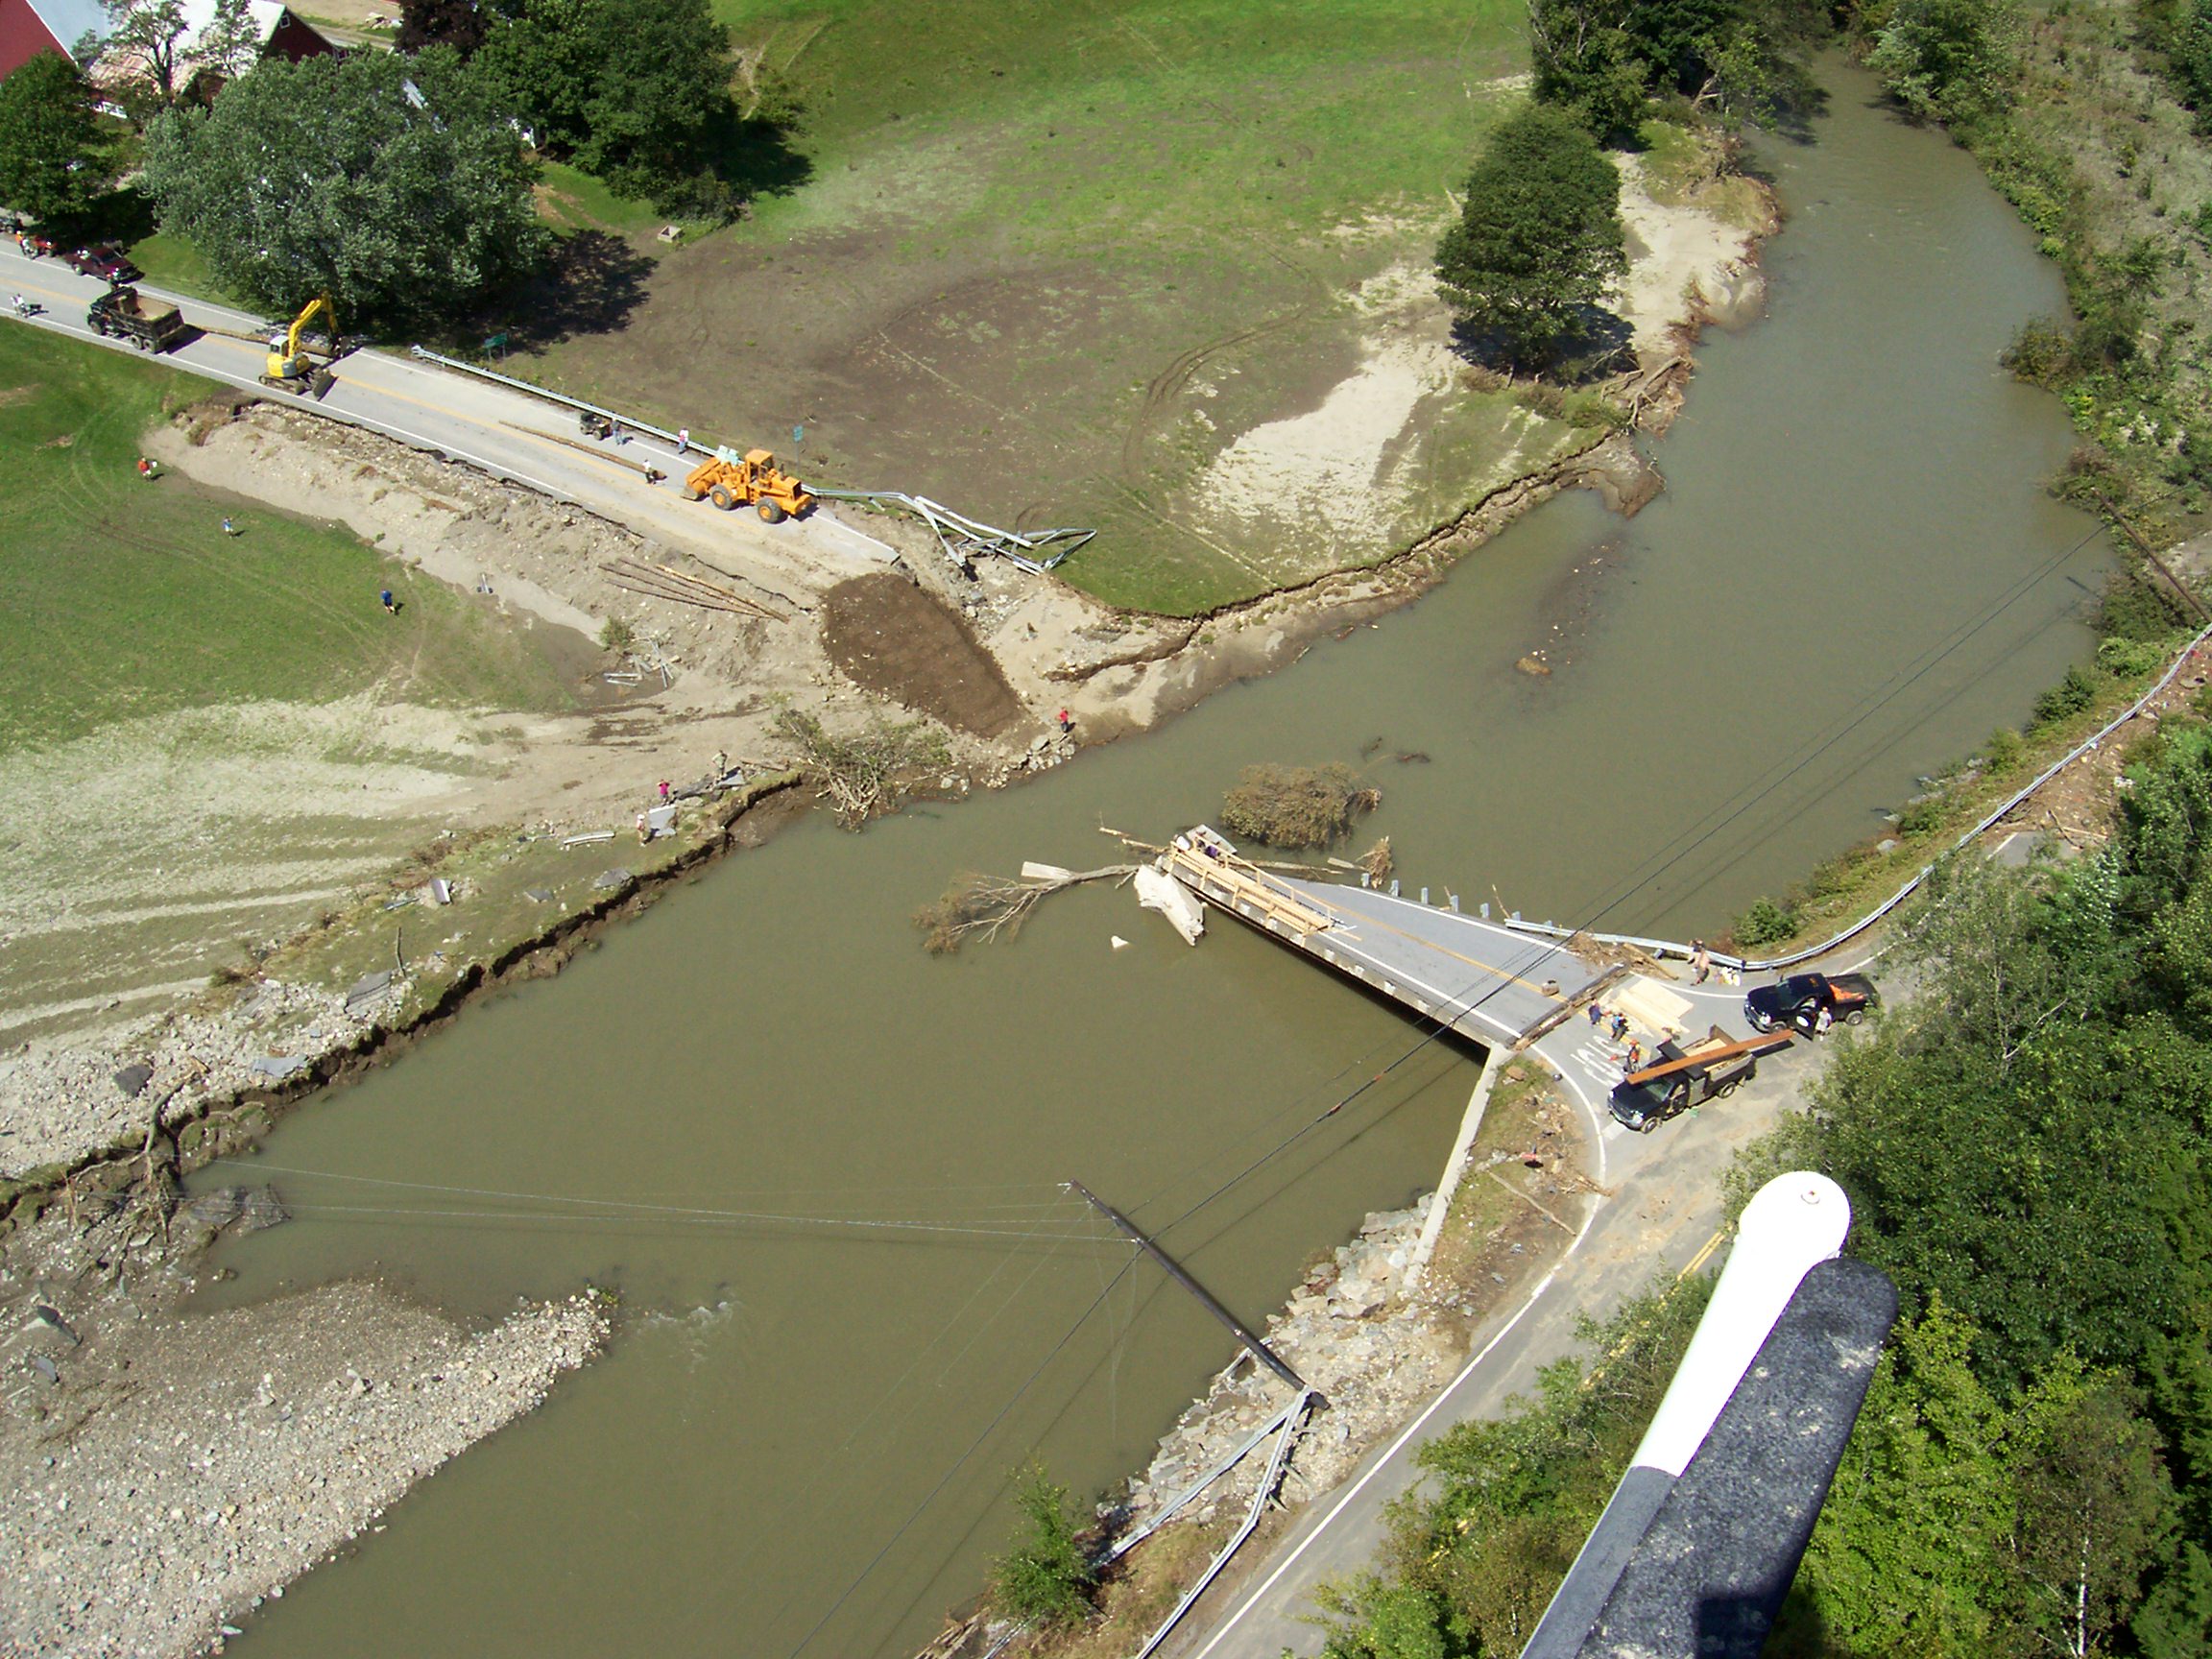
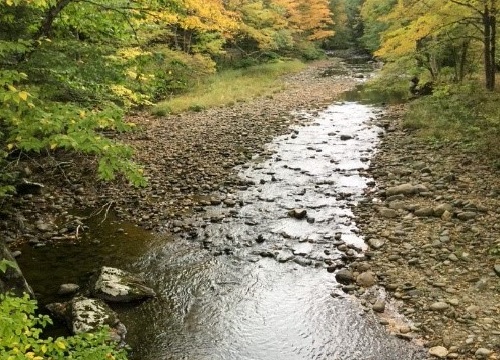
Green River, Guilford, VT (photo courtesy of Jim Deshler)
References
Boulton, A. J., and P. S. Lake, 2008. Effects of drought on stream insects and its ecological consequences. In: Aquatic Insects: Challenges to Populations, Proceedings of the Royal Entomological Society’s 24yh Symposium [Lancaster, J and R. A. Biers (eds.)]. Cromwell Press, Trowbridge, England, pp. 81-102.
Easterling, D. R., K. E. Kunkel, J. R. Arnold, T. Knutson, A. N. LeGrande, L. R. Leung, R. S. Vose, D. E. Waliser & Wehner, M. F.b 2017. Precipitation change in the United States. In: Climate Science Special Report: Fourth National Climate Assessment, Volume I [Wuebbles, D. J., D. W. Fahey, K. A. Hibbard, D. J. Dokken, B. C. Stewart, and T. K. Maycock (eds.)]. U.S. Global Change Research Program, Washington, DC, USA, pp. 207-230.
Henson, Robert, 2019. The Thinking Person’s Guide to Climate Change (2nd Edition). American Meteorological Society, Boston, Massachusetts.
Hilsenhoff, W. L., 1987. An improved biotic index of organic stream pollution. The Great Lakes Entomologist 20: 31-39.
Hilsenhoff, W. L., 1988. Seasonal correction factors for the biotic index. The Great Lakes Entomologist 21: 9-13.
USEPA (U.S. Environmental Protection Agency), 2016. Regional Monitoring Networks (RMNs) to Detect Changing Baselines in Freshwater Wadeable Streams. U.S. Environmental Protection Agency, Office of Research and Development, National Center for Environmental Assessment. Washington, DC.
VT DEC (Vermont Department of Environmental Conservation), 2017. Vermont Water Quality Standards Environmental Protection Rule Chapter 29A. Available online: http://dec.vermont.gov/sites/dec/files/documents/wsmd_water_quality_standards_2016.pdf
Additional Resources
VT DEC Biomonitoring and Aquatic Studies http://www.watershedmanagement.vt.gov/bass/htm/bs_biomon.htm
FEMC Project Database Link
Sentinel Stream Monitoring: https://www.uvm.edu/femc/data/archive/project/sentinel-stream-monitoring