Forest Phenology
Field Assessments of Sugar Maple Phenological Events
The timing of seasonal changes in vegetation, including springtime leaf expansion and fall senescence, has important implications for ecosystem processes. Long-term field assessments of tree phenology allow us to detect subtle changes in the timing and duration of phenology, which help us better understand how changes in climate are impacting forested ecosystems.
The Data
Current FEMC data sets include visual assessments of sugar maple (Acer saccharum Marsh.) bud break and fall senescence, from 1991 to present, at two elevations on the western slopes of Mount Mansfield in the Green Mountains of Vermont. Annual phenology assessments start each spring while buds are dormant and continues until leaves are fully expanded. Spring phenology is assessed twice weekly on five dominant sugar maple trees at the Proctor Maple Research Center, at an elevation of 415 m (1400 feet). Trees are assigned to one of eight bud developmental stages based on an assessment of 10 random buds (Skinner and Parker, 1994) and then averaged to a plot-level mean.
Metrics of fall phenology include visual ratings of percent color and leaf drop, Maple recorded weekly beginning in September on these same trees. Additional sugar maple trees were also monitored at a site above the Underhill State Park at an elevation of 670m (2200 feet). Percent color is assessed as the proportion of the current leaves exhibiting a color other than green. Percent leaf drop is estimated as the proportion of potential leaves missing. While these are subjective visual estimates, at important stages, such as full color or full leaf drop, the estimates are most reliable. After field data are collected, color estimates are recalculated to represent the proportion of the initial fully foliated crown with color as:
Temporal trends in spring phenology were assessed by examining the dates of two significant phenological events across 23 years of data: (1) first day of year (DOY) of bud break (phenological stage 4); and (2) first day of year of full leaf expansion (phenological stage 8).
Fall phenology was similarly examined by comparing the timing of two significant fall phenological events across time: (1) the day of year (DOY) with maximum fall color observed in the canopy; and (2) the day of year (DOY) on which all trees’ leaves had either colored or fallen from the canopy. Yearly anomalies for all phenological events were calculated by comparing each year’s data to the mean value for the entire measurement period. Linear regression was performed to assess the trends in seasonal developmental events across the 26-year period.
2018 in Summary
The day-of-year of first bud break in 2018 for sugar maple (DOY 127) was two days later than the long-term average (DOY 125). Full leaf out (DOY 138) was similar to the long term average (DOY 137). The transition from bud break to full leaves was more rapid than normal, taking 12 days compared with the long-term average of 15 days. At lower elevations, maximum fall color occurred 2 days earlier than the long-term mean, and full leaf drop occurred 2 days later than the long-term mean. At higher elevations, peak color was consistent with the long-term mean, and full leaf drop was 1 day earlier than the long-term mean (same as in 2017).
Long Term Trends
Spring phenology in 2018 was similar to the long-term mean and fits a long-term trend toward an earlier start of spring (Figure 10). High variability in our spring phenology data is likely the result of our low sample size (n=5) for each year. As such, it is difficult to make statistical inferences for bud burst or leaf out. Nevertheless, there does appear to be a weak but consistent trend for earlier spring phenological measures over the course of our monitoring efforts (Figure 10).
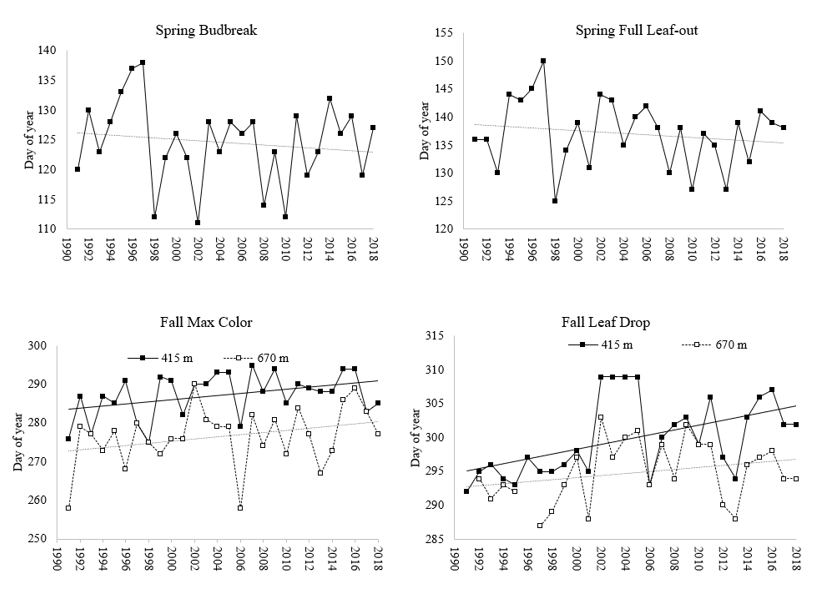
In the fall, significant trends towards later fall color and leaf drop at lower elevations continued to be observed (Figure 10). The delay of maximum fall colors at low elevations showed consistently later peak foliage over time, culminating in an average delay of 8 days across the data record. Fall leaf drop showed a similar 10-day cumulative delay at low elevations. Interestingly, trees at upper elevations did not show a significant trend of changing fall phenology for either of the fall metrics. This continues to be surprising given model data suggesting that warming due to climate change may be more severe at higher elevations (Giorgi et al. 1997). Exploring microclimatic differences at each elevation are necessary to tease apart the possible mechanisms behind differing phenological responses of trees at the two sites.
These trends toward earlier springs and later falls are consistent with trends reported in earlier analyses of the FEMC data set (see https://www.uvm.edu/femc/attachments/project/999/reports/SugarMapleSpringPhenology_Mansfield2010.pdf )
Implications
There is mounting global evidence for trends of changing vegetation phenology, including earlier spring leaf out and later leaf senescence in the fall, supported by our data. The net effect of these long-term changes in phenology timing is a notable increase in growing season length. It is unclear how this may impact forested ecosystems. There are possible implications for water cycling in forests, as earlier springs may escalate evapotranspiration resulting in increased periods of low stream flow during the peak growing season (Daley et al., 2007). Although a longer growing season typically increases forest productivity, carbon sequestration dynamics could be altered by water and nutrient limitations in northern hardwood forests. While expanded growing seasons may benefit some species, it may leave others more vulnerable to climate extremes that occur more often in shoulder seasons. There may also be cascading impacts through forested ecosystems, including phenological asynchrony across taxonomic groups.
The changes we observed in the timing of foliar development carry important economic repercussions for Vermont’s maple syrup and tourist industries. Vermont is the largest producer of maple syrup in the United States, accounting for 41% of the country’s production and earning 50 million dollars in 2011 (Sawyer et al., 2013). Warmer winters and earlier springs are now shortening and advancing the sugaring season (Skinner et al., 2010), and maple syrup producers will need to employ new management techniques for the industry to adapt to the changing climate (Frumhoff et al., 2007; Skinner et al., 2010).
Climate change is accompanied by much uncertainty regarding the future of the region’s forests. Increased pest outbreaks, range shifts leading to increased competition between species, and water limitations are some of the stressors that will face sugar maple trees in Vermont. Knowledge regarding the alteration of seasonal developmental events and the consequent lengthening of the growing season provides ecologically and economically important information to sustainably manage our forests in the face of these environmental changes.
Sugar maples continue to show a trend towards earlier spring and later fall phenological events. Earlier springs may shorten the window for maple syrup production.
References
Daley, M. J., N. G. Phillips, C. Pettijohn, and J. L. Hadley. 2007. Water use by eastern hemlock (Tsuga canadensis) and black birch (Betula lenta): Implications of effects of the hemlock woolly adelgid. Canadian Journal of Forest Research 37:2031-2040.
Frumhoff, P. C., J. J. McCarthy, J. M. Melillo, S. C. Moser, and D. J. Wuebbles. 2007. Confronting climate change in the US Northeast. Union of Concerned Scientists. , Cambridge, MA.
Giorgi, F., J. W. Hurrell, M. R. Marinucci, and M. Beniston. 1997. Elevation dependency of the surface climate change signal: A model study. Journal of Climate 10:288-296.
Sawyer, S., E. Kahler, and K. Perkins. 2013. 3.3 Food Production: Maple Syrup in Analysis of Vermont’s Food System: Farm to Plate Strategic Plan. Vermont Sustainable Jobs Fund, Montpelier, VT.
Skinner, C. B., A. T. DeGaetano, and B. F. Chabot. 2010. Implications of twenty-first century climate change on Northeastern United States maple syrup production: Impacts and adaptations. Climatic Change 100:685-702.
Skinner, M., and B. L. Parker. 1994. Field guide for monitoring sugar maple bud development. FEMC Research Report #8. VT Agric. Exp. Sta. RR70. University of Vermont., Burlington, VT.
Additional Resources
FEMC Project Database Links
Bud Phenology: https://www.uvm.edu/femc/data/archive/project/tree-phenology-monitoring-bud-development
Fall Color and Leaf Drop: https://www.uvm.edu/femc/data/archive/project/tree-phenology-monitoring-fall-color-leaf
Image Credits
Norway maple. 2013. Photo by John Truong
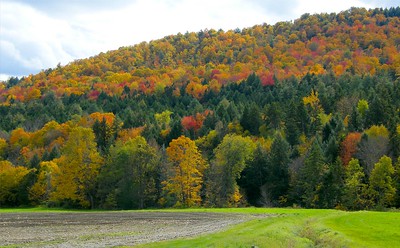
Stowe, Vt Church Fall Foliage. 2017. Photo by John Truong
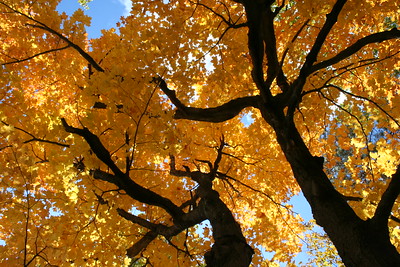
Notch Road in Stowe, VT. 2017. Photo by John Truong