Mercury Deposition
Mercury Deposition Network Monitoring at VT99
Mercury (Hg) is a persistent pollutant that can accumulate in organisms as it moves up the food chain, leading to neurological damage, lowered reproductive success, motor skill impairment and hormonal changes in humans and animals (Driscoll et al. 2007, Evers et al. 2004). Human activities such as fossil fuel burning and waste incineration elevate levels of atmospheric mercury, which is later transferred to forests and water bodies through both dry and wet (in precipitation) deposition. Since 1992, FEMC has been collecting data on both wet and dry mercury deposition, making it one of the longest records of mercury deposition in the U.S. In 2004, the FEMC joined the Mercury Deposition Network (MDN, part of the National Atmospheric Deposition Program) as one of nearly 100 sites in the U.S. and Canada. The FEMC air quality site serves as a sentinel site for the Northeastern U.S. – it is high enough in elevation to detect regional mercury transport events that are not detected by other stations. This extensive record has provided context to many shorter-duration studies.[2] FEMC and its partners have committed to this long-term monitoring in order to document and better understand the input of mercury into Vermont’s forested ecosystems and the inhabitants of those ecosystems, including birds, fish, bobcats and human beings.
The Data
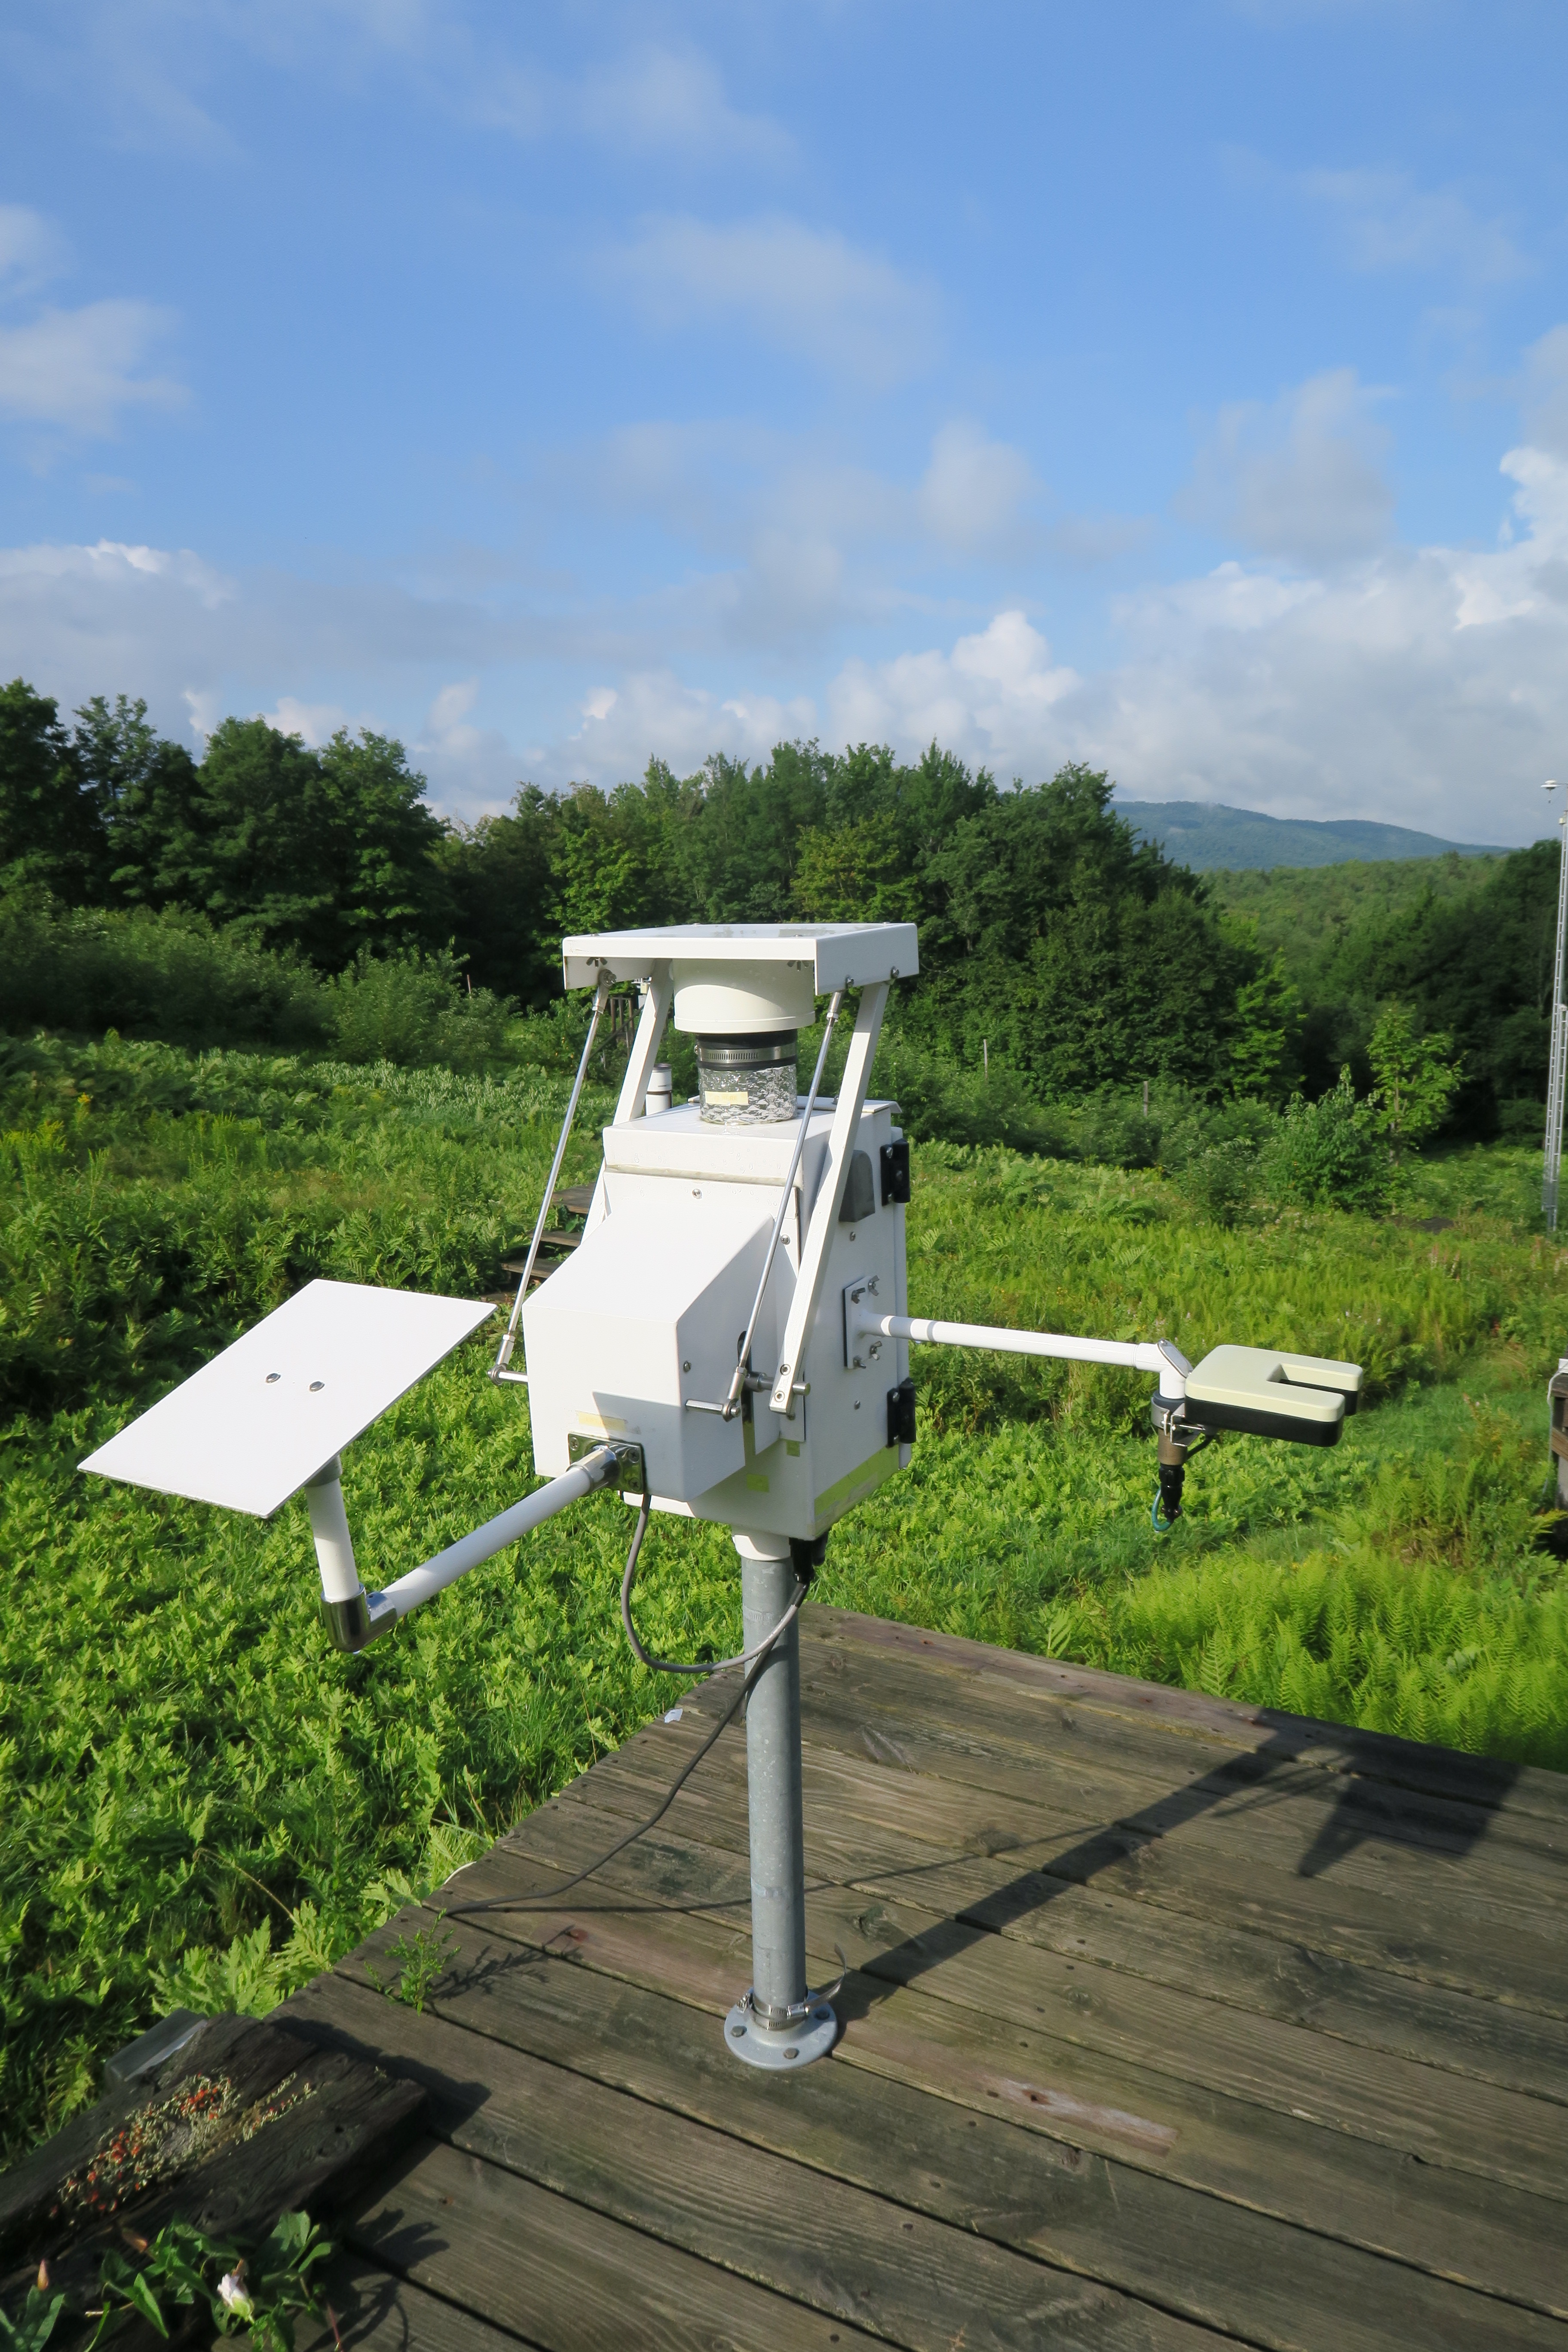
FEMC conducts year-round sampling of precipitation for mercury analysis at the air quality-monitoring site at the Proctor Maple Research Center in Underhill, Vermont (MDN site ID: VT99). Weekly composites of precipitation are gathered in an automated wet-only precipitation collector at the site The collector opens automatically when rain or snow is detected, capturing precipitation through a funnel and tube sampling train into a bottle charged with hydrochloric acid (to preserve the sample). The collector is heated in the winter and vented in the summer as needed. Samples are collected every Tuesday and shipped to the Wisconsin State Laboratory of Hygiene[2] for analysis of mercury concentration and cleaning of the sampling train. Data are submitted to NADP for quality control and posted on the NADP/MDN website (http://nadp.slh.wisc.edu/mdn/).
2018 in Summary
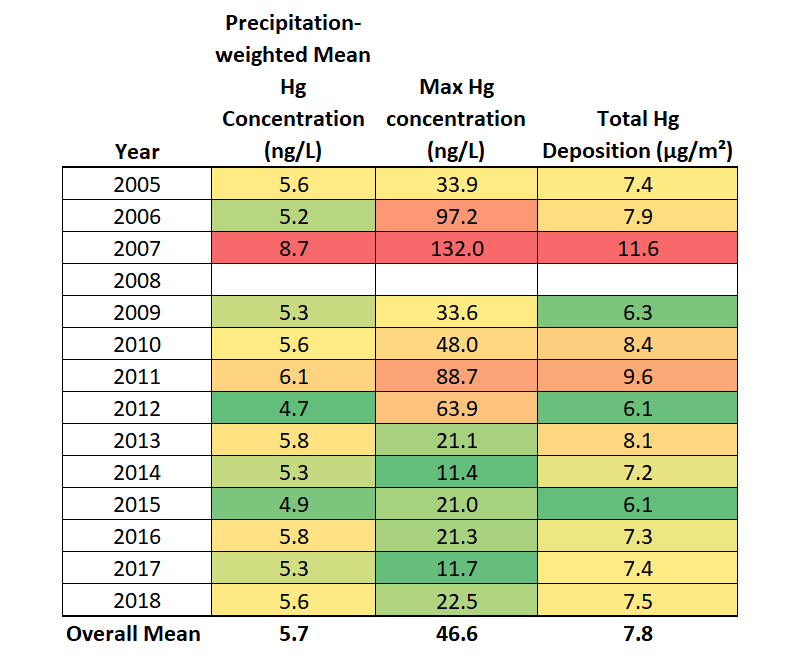
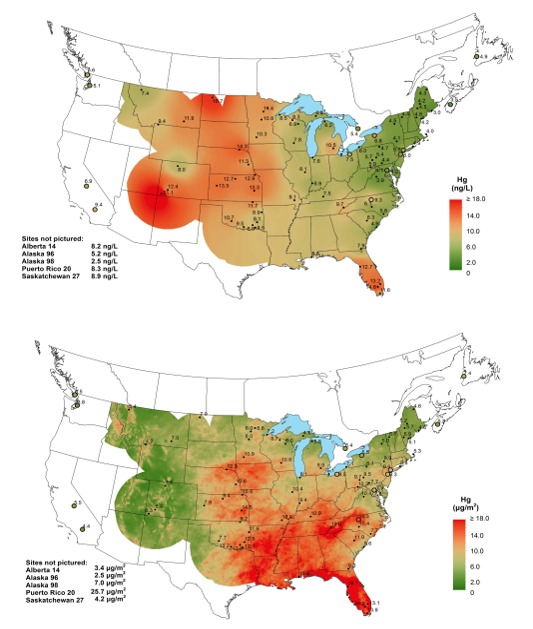
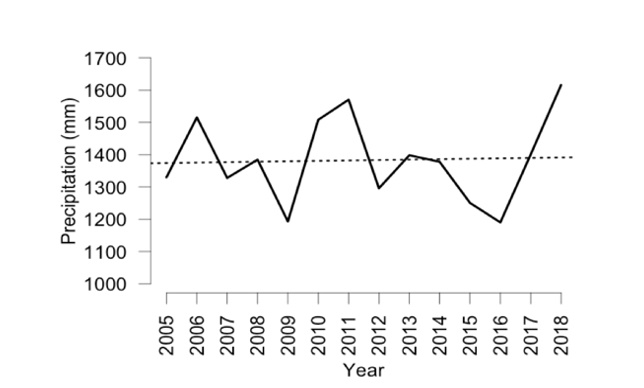
Mercury monitoring at FEMC’s air quality site VT99 in 2018 shows slightly lower total annual mercury (Hg) deposition than the average for the 14-year record and a slightly higher total annual mercury deposition than 2017 levels (Table 2). Over the 2005-2018 period for VT99, total mercury deposition fluctuated from a high of 11.6 µg/m2 in 2007 to a low of 6.1 µg/m2 in 2012 and 2015. Similarly, the precipitation-weighted mean mercury concentration and the maximum mercury concentrations measured at VT99 are quite variable. In 2018, precipitation-weighted mean concentration was slightly lower than the average for the record. In 2018, Vermont registered lower concentration and deposition averages than most sites elsewhere in the United States (Figure 14).
Long Term Trends
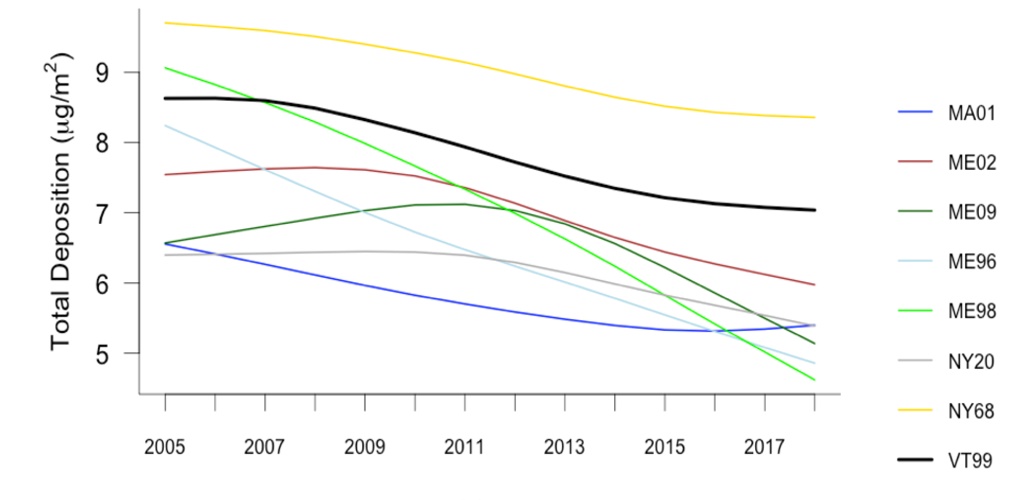
Total mercury deposition across the northeast appears to decrease over the 2005-2018 period (Figure 15), although interannual mercury concentration and precipitation volume remain variable.
Implications
In the long term, mercury deposition levels decreased dramatically with the implementation of the Clean Air Act Amendments of 1990 (Kamman and Engstrom 2002). However, as we have seen in Vermont, mercury deposition has not continued to decline as expected with other air pollutants.
Historically, sulfur emissions were strongly correlated with mercury emissions because they shared the same primary source -- coal-fired utility boilers -- but with the impressive reduction in sulfate deposition as a result of improved emissions controls and shut-downs of coal-fired utility boilers, sulfate deposition is no longer well correlated to mercury deposition. In the northeast, mercury concentrations have not continued to decrease as expected. This suggests that the reduced, but ongoing level of mercury deposition in Vermont is no longer associated with regional sulfur emissions and may have other sources.
Mercury persists in the environment and continues to be cycled through the various storage pools (i.e., soils, air, biota). The continued low-level input and occasional spikes in mercury deposition will likely drive cumulative increases in mercury in Vermont’s forests moving forward. Forest ecosystems and the organism that live there are particularly sensitive to these inputs (Driscoll et al. 2007, Gay 2016, pers comm, Weiss-Penzias et al. 2016). Conifers tend to have higher concentrations of bark and foliar mercury (Yang et al. 2018). Fish mercury burdens are one way to track these trends in Vermont as fish advisories continue to be issued (Chalmers et al. 2014, Vijayaraghavan et al. 2014). Until fish tissue sampling shows a long-term negative trend, the need to monitor ecosystem mercury is critical. Mercury cycling and bioaccumulation is a complex process that is not fully understood.
As of December 2018, the Environmental Protection Agency proposed a change to the Mercury and Air Toxics Standards (“MATS”), which would change the accounting of costs for any required reductions of toxic air pollutants, like mercury, from existing and new coal and oil-fired power plants, opening the rule to new legal challenges. If MATS survives, we should see a continued downward trend in mercury deposition from regional sources in Vermont and the Northeast. It is important to continue monitoring mercury deposition to assess the environmental impacts of changing environmental regulations and pollution sources. Further reduction of mercury emissions, globally and regionally, would likely reduce exposure and bioaccumulation in humans and other species.”
In 2018, Vermont experienced another year of below-average maximum concentrations of mercury in the 14-year record. However, Vermont’s mercury deposition has not been decreasing as much as expected, highlighting the role of monitoring for identifying regional and global patterns in mercury pollution.
References
Chalmers, A.T., Krabbenhoft, D.P., Van Metre, P.C. and Nilles, M.A., 2014. Effects of urbanization on mercury deposition and accumulation in New England. Environmental Pollution, 192, pp.104-112.
Driscoll, C. T., Han, Y. J., Chen, C. Y., Evers, D. C., Lambert, K. F., Holsen, T. M., Munson, R. K. (2007). Mercury contamination in forest and freshwater ecosystems in the Northeastern United States. Bioscience, 57(1), 17-28. doi: 10.1641/b570106.
Gay, D. 2016. Pers comm.
Evers DC, Lane OP, Savoy L, Goodale W. 2004. Assessing the Impacts of Methylmercury on Piscivorous Wildlife Using a Wildlife Criterion Value Based on the Common Loon, 1998–2003. Gorham (ME): Maine Department of Environmental Protection, BioDiversity Research Institute. Report no. BRI 2004-05.
Kamman NC, Engstrom DR. 2002.Historical and present fluxes of mercury to Vermont and New Hampshire lakes inferred from 210Pb dated sediment cores. Atmospheric Environment 36: 1599–1609.
Weiss-Penzias, P.S., Gay, D.A., Brigham, M.E., Parsons, M.T., Gustin, M.S. and ter Schure, A., 2016. Trends in mercury wet deposition and mercury air concentrations across the US and Canada. Science of The Total Environment. http://dx.doi.org/10.1016/j.scitotenv.2016.01.061
Yang Y., Yanai R.D., Driscoll C.T., Montesdeoca M., Smith K.T. 2018. Concentrations and content of mercury in bark, wood, and leaves in hardwoods and conifers in four forested sites in the northeastern USA. PLoS ONE 13(4): e0196293. https://doi.org/10.1371/journal.pone.0196293
Additional Resources
Vermont Health Department Fish Consumption Recommendations: https://www.healthvermont.gov/health-environment/recreational-water/mercury-fish
Global Sources of Local Pollution: An Assessment of Long-Range Transport of Key Air Pollutants to and from the United States. 2009. National Academy of Sciences. Chapter 4, Mercury: Atmospheric Mercury Primer https://www.nap.edu/read/12743/chapter/6#99
FEMC Project Database Links
Wet Deposition of Mercury at Proctor Maple Research Center (Mercury Deposition Network-MDN) https://www.uvm.edu/femc/data/archive/project/wet-deposition-mercury-proctor-maple-research
[2] Mercury Flux at PMRC - https://www.uvm.edu/femc/data/archive/project/mercury-flux-pmrc; Bicknell's Thrush Population Demographics and Ecology: Assessing levels of methylmercury in montane forest bird community on Mount Mansfield - https://www.uvm.edu/femc/data/archive/project/bicknells-thrush-population-demographics-ecology-ongoing ;
Mercury Burdens in Amphibians - https://www.uvm.edu/femc/data/archive/project/mercury-burdens-amphibians ;
Cloudwater Chemistry on Mount Mansfield - https://www.uvm.edu/femc/data/archive/project/cloudwater-chemistry-mount-mansfield ;
Litterfall Mercury Dry Deposition in the Eastern USA - https://www.uvm.edu/femc/data/archive/project/litterfall-mercury-dry-deposition-eastern-usa
[2] In 2019, analytical services for the Mercury Deposition Network were moved to the Wisconsin State Hygiene Laboratory in Madison, Wisconsin.