Aerial Detection Surveys
Forest Disturbance
Damage to trees caused by insects, disease, animals, and weather are a natural and common occurrence in Vermont’s forests. Such disturbances can result in changes to biodiversity and species composition, and allow for cycling of nutrients from trees to soil, but can also negatively affect timber quality and other important ecosystem services. There is also concern that climate change and further introduction of non-native pests and pathogens may alter disturbance patterns in the future.
The Data
The Insect and Disease Surveys (IDS) (formerly, Aerial Detection Surveys, ADS) have been used to map the cause and extent of forest disturbances in Vermont for nearly 50 years.
Statewide annual sketch-mapping survey data are collected by Vermont Department of Forests, Parks and Recreation (VT FPR), and the US Forest Service over the Green Mountain National Forest and other federal lands. The US Forest Service Forest Health Monitoring Program sets survey methods and standards for IDS across the US.
In most years, assessments cover the entire state (>2.5 million hectares). Mapped polygons include the disturbance cause, type, size, and severity which are confirmed with ground assessments. Causal agents of disturbance can range from insects and disease, to weather events (ice, wind, and frost), wild animals, and humans. Surveys are a cost-effective and vital tool for detecting emerging forest health issues and tracking trends, but are not comprehensive of all forest damage.
2018 in Summary
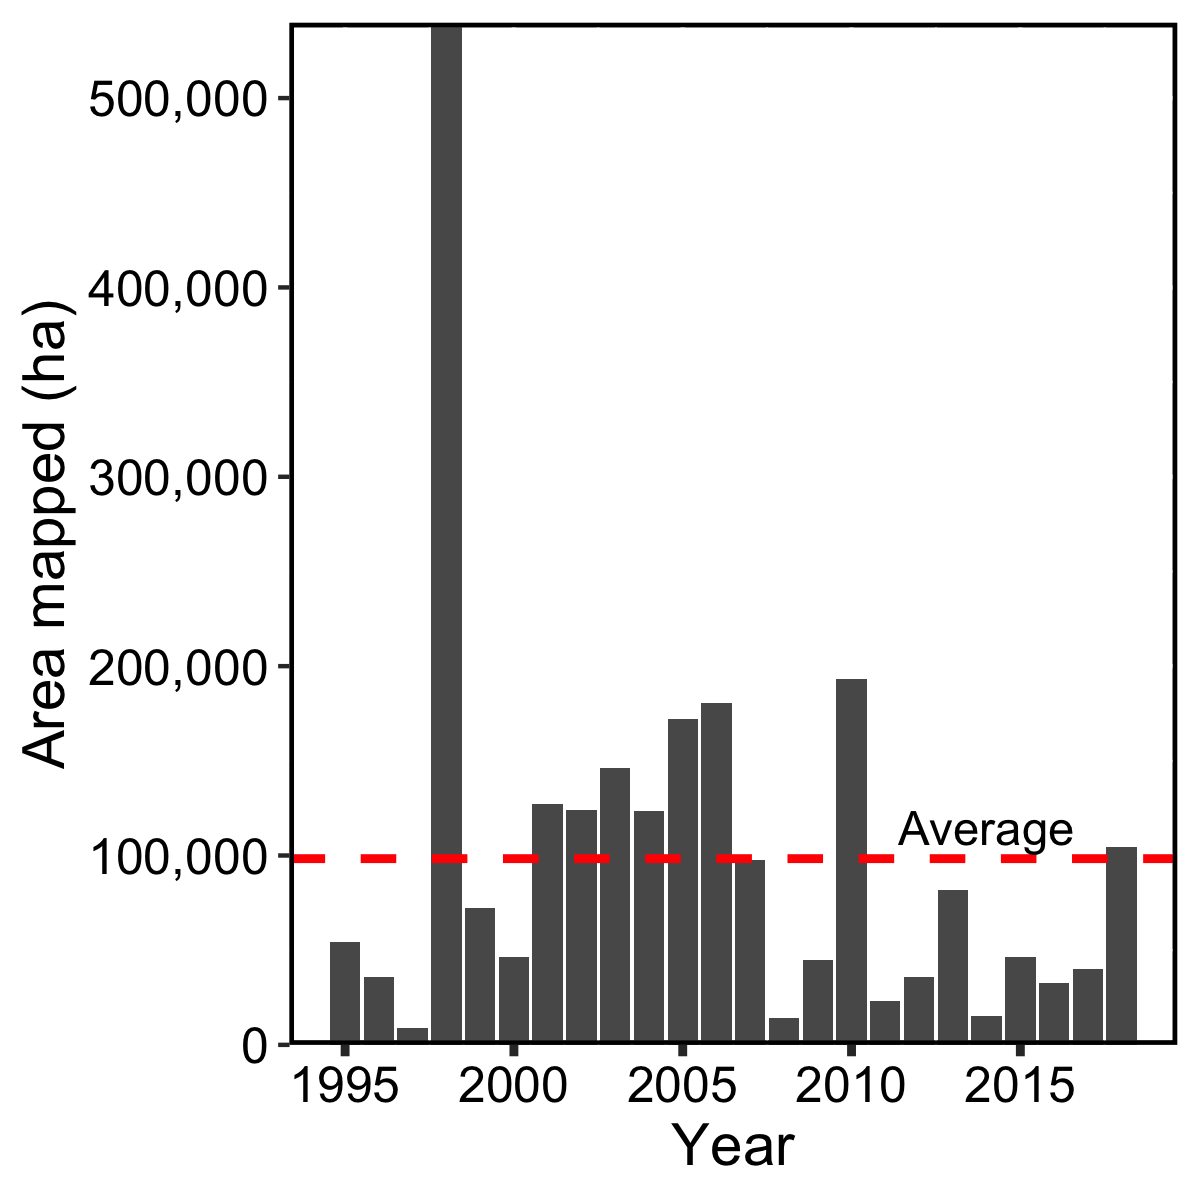
In 2018, 52,172 hectares (128,866 acres) of forest disturbance were mapped in Vermont, which is approximately 2.7% of Vermont’s forestland. This is an increase from 2017 when 39,898 ha were mapped, but it is less than the long-term (1995-2018) average of 96,165 ha/year.
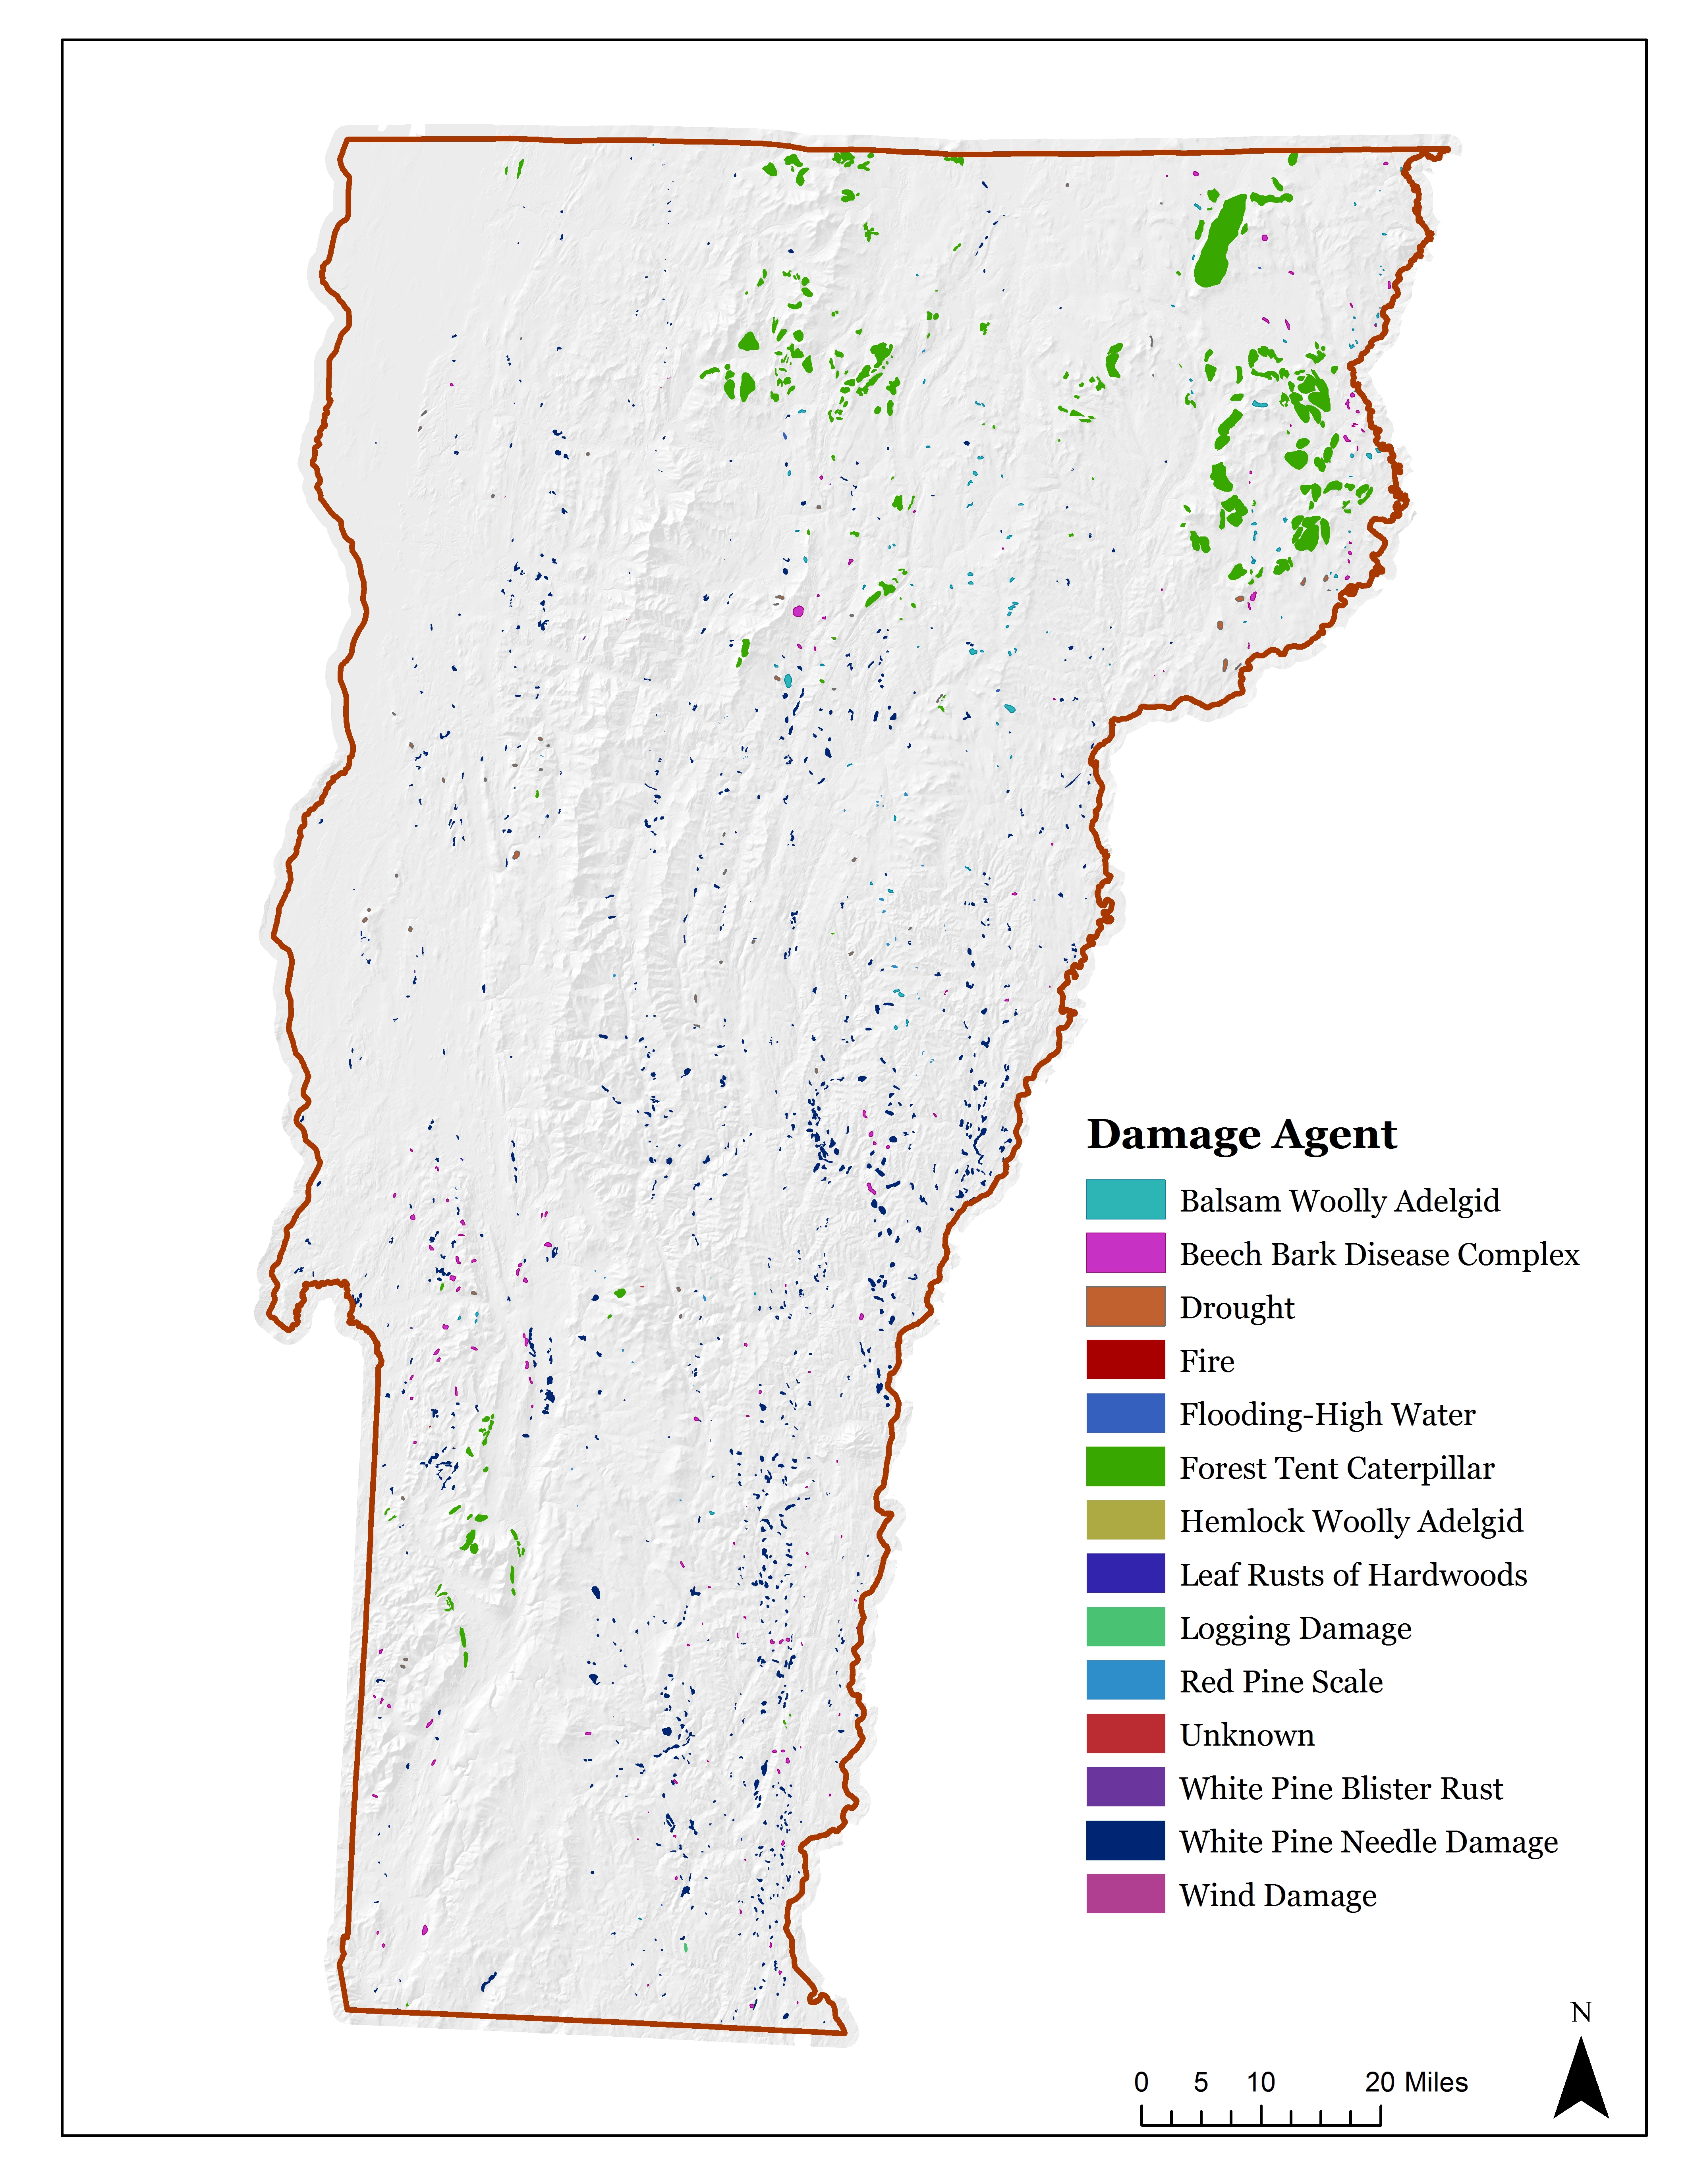
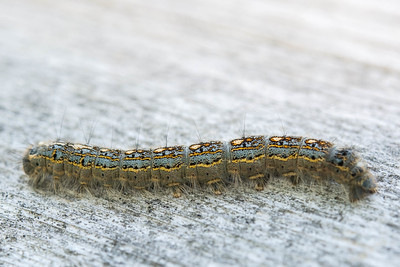
2018 marked the third year of a forest tent caterpillar (Malacosoma disstria) outbreak, with 30,715 ha of damage mapped during the season. This is an increase over the 24,515 ha mapped in 2017 and the 9,197 ha mapped in 2016. Outbreaks result in defoliation of hardwood trees and usually last several years. White pine needle damage was the second most widespread damage, with 16,491 ha mapped (Figure 6). This value represents a significant increase in the white pine needle damage area mapped in 2017 (6,650 ha).
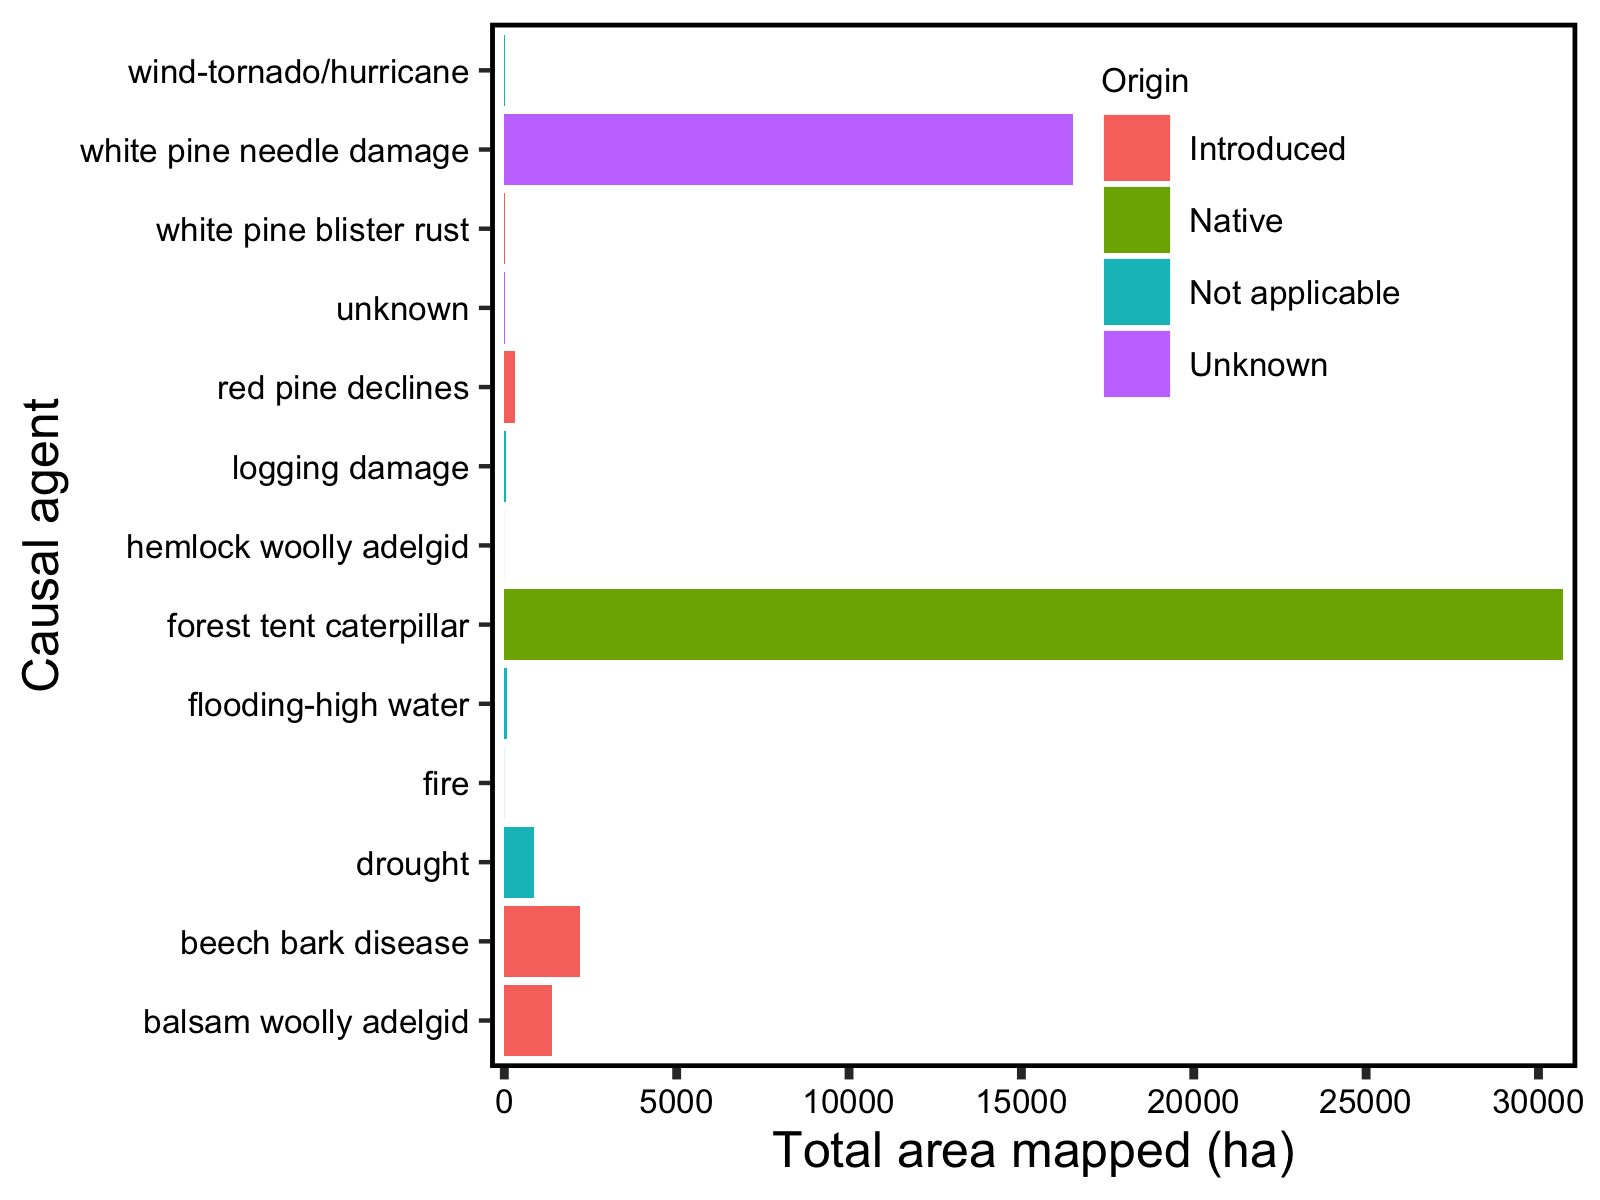
Symptoms attributed to drought were more common in 2018 than in 2017 and the impacts were likely underrepresented due to the timing of aerial surveys (VT FPR 2018). Forest tent caterpillar (FTC) populations increased in 2018, resulting in greater defoliation impacts across the state. White pine needle damage was widespread in 2018 and resulted in a two-fold increase in impacted area mapped when compared to 2017 (VT FPR 2018).
More complete results of the 2018 Vermont IDS effort can be found in the 2018 report, Forest Insect and Disease Conditions in Vermont (VT FPR, 2018).
Long Term Trends
A summation of all disturbances per year (1995-2018) reveals substantial year-to-year variability (Figure 6). This is partially due to shifting monitoring and assessment priorities year to year, but also depends on the nature of the disturbance. Several disturbances are episodic, particularly abiotic weather events (e.g., late spring frost events, drought) and many insect outbreaks. The year of the highest disturbance area occurred in 1998 with a severe ice storm that caused widespread damage to trees (381,843 ha). Only two agents have been detected every year of the 23-year period: beech bark disease and birch defoliator complex (Figure 9).
In total, 66 different damage agents have been mapped in Vermont since 1995. When the maximum extent of damage caused by specific damage agents is compared to number of years they were mapped, agents have varying impacts in the landscape (Figure 9). In general, insects and abiotic agents have had the largest effect on the region’s forests. The most damaging agents overall have been ice and snow damage (394,829 ha), forest tent caterpillar, and beech bark disease (224,188 ha)
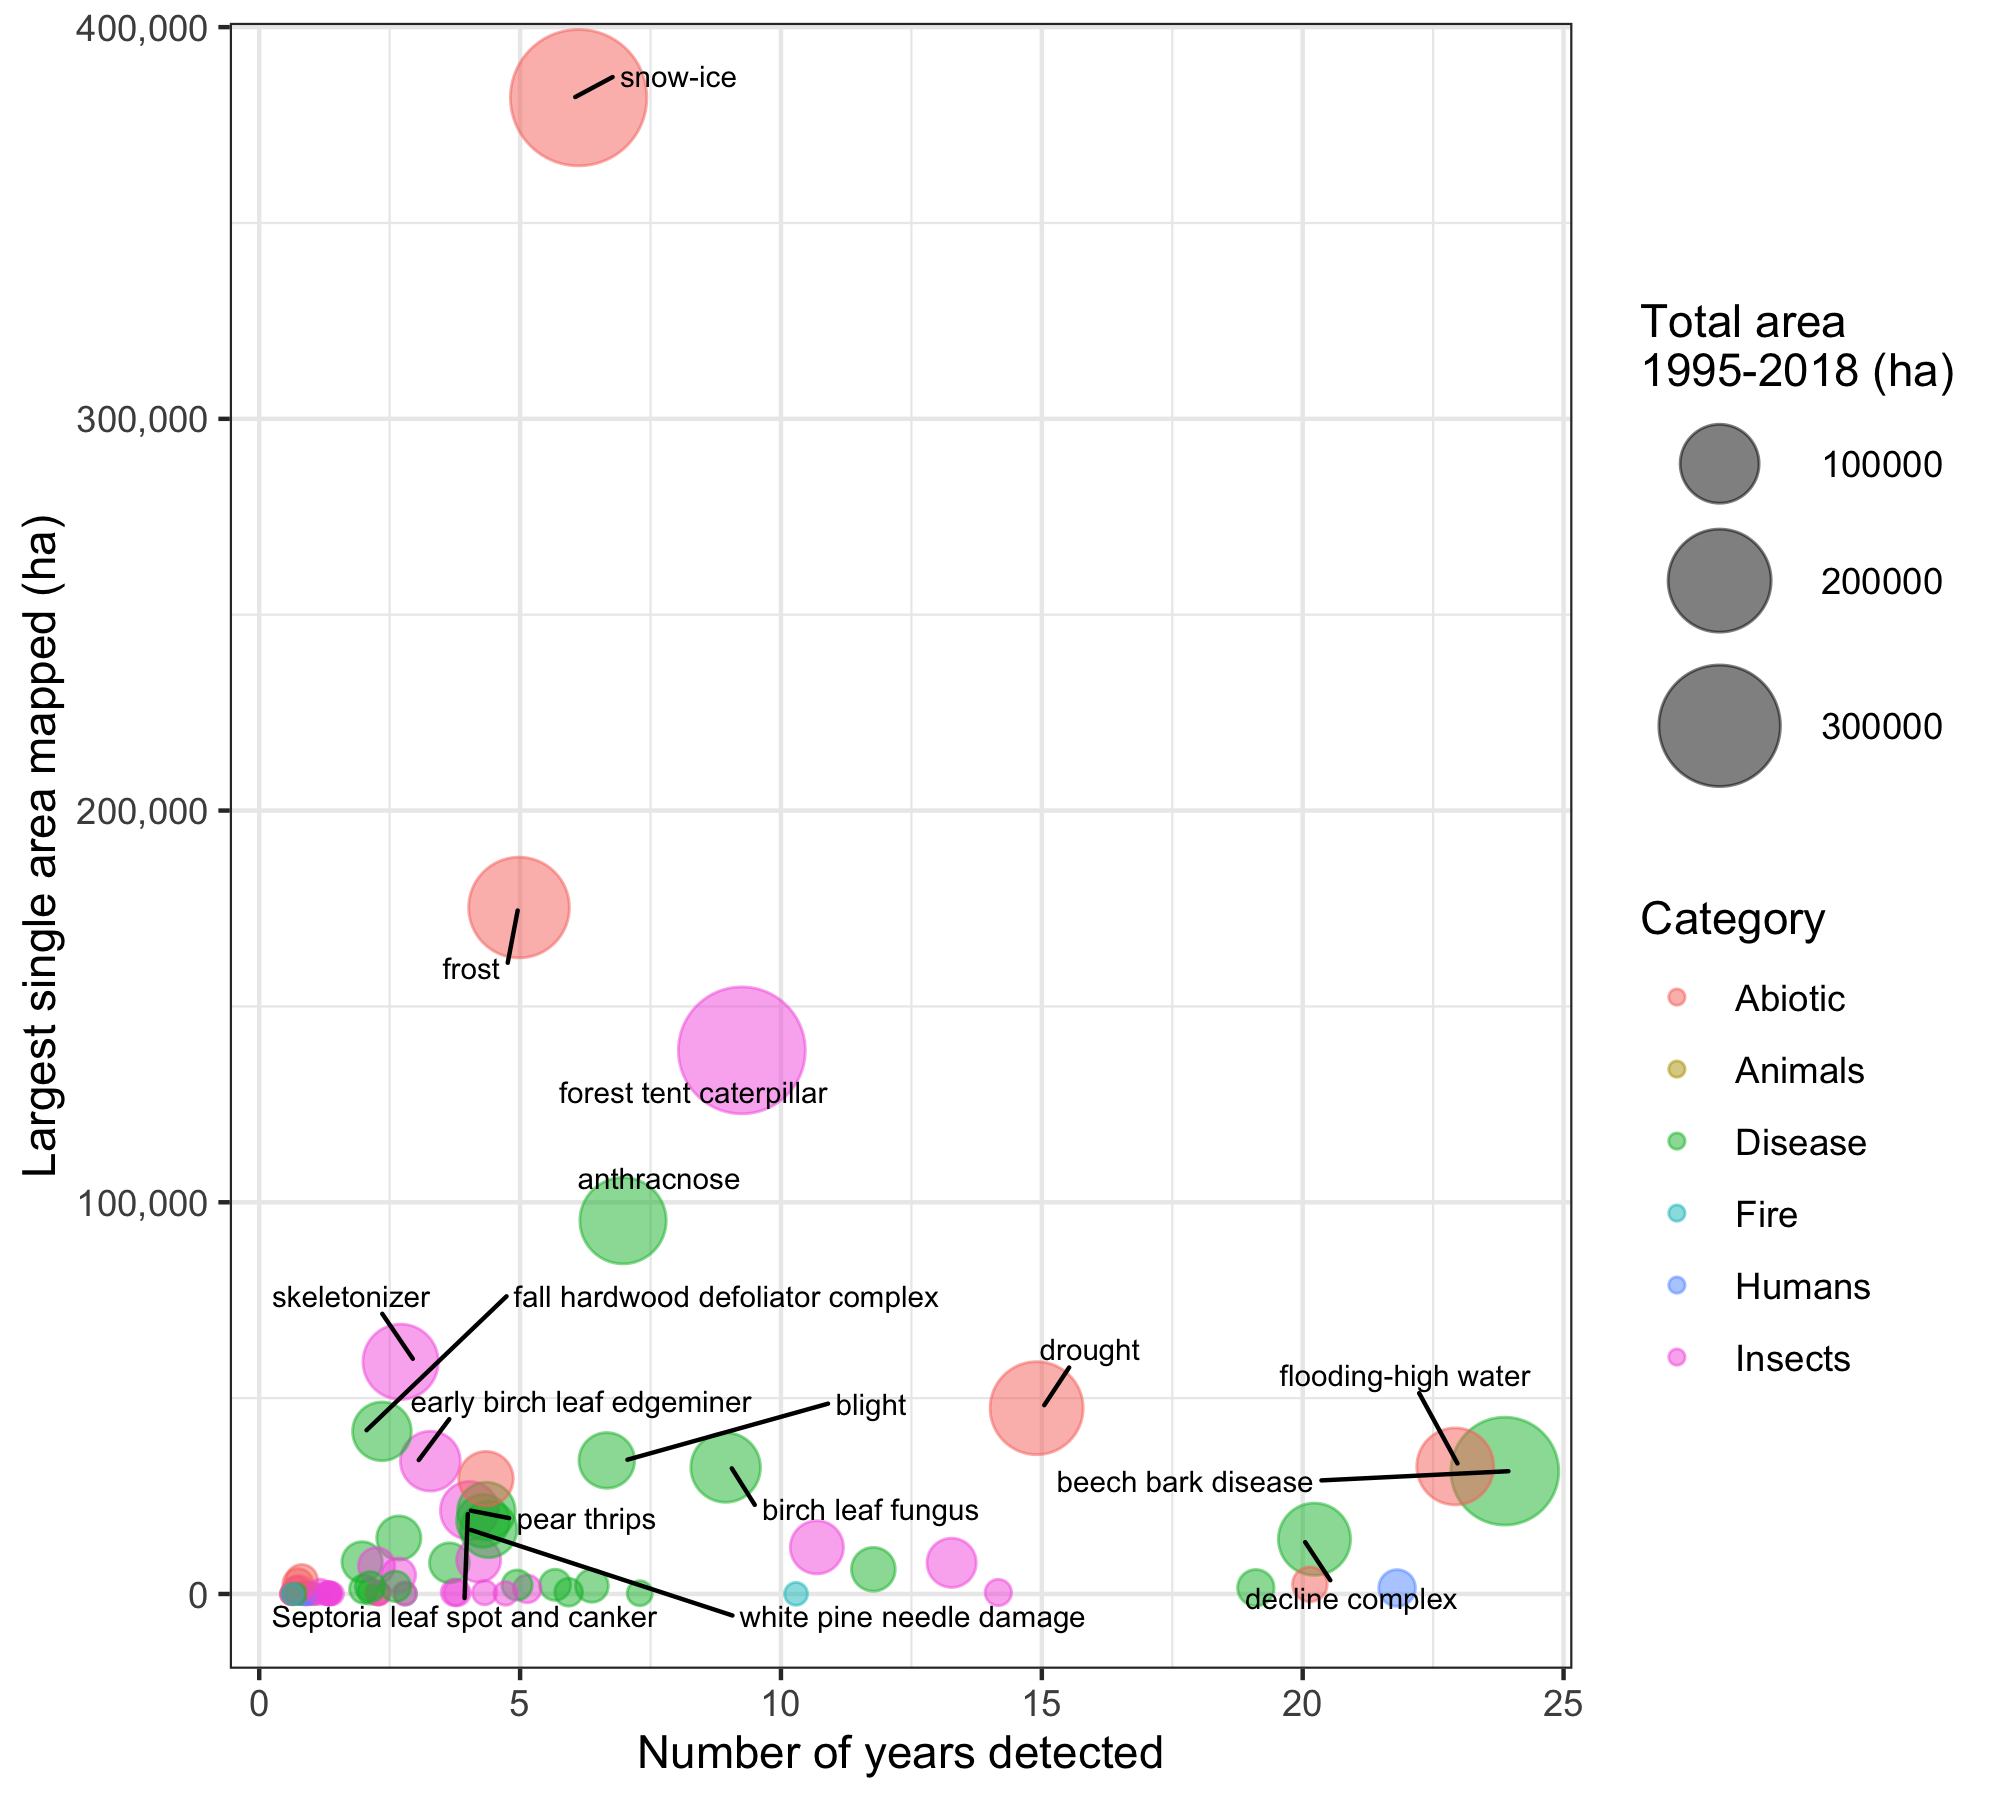
Abiotic disturbance agents, like ice and frost events and drought, can indiscriminately affect trees regardless of species (although there can be reasons why specific species may be more harmed in abiotic events, due to branching structure, wood density, or habitat, for example) and as a result can cause widespread disturbance. Most other disturbance agents have only affected a small area of forestland. Only seven agents out of 66 have resulted in total damage greater than 100,000 ha in the 23-year period. Many tree diseases identified in the region have not caused large disturbance extents despite frequent occurrence (Figure 9). Of diseases, beech bark disease and anthracnose have resulted in the largest disturbance area. Forest fire is an infrequent event regionally, and when it does occur, the extent is small.
Regional Context & Implications
Insect and Disease Survey data provides the longest statewide annual record of forest disturbances. Relatively low levels of total forest disturbance have been mapped. Most disturbances cause small damage extents and minor total damage.
The annual rate of disturbance in Vermont is comparable to the rest of northern Forest region (3% of forestland/year). Many, if not all, of the disturbances affecting Vermont’s forests are regional issues. Disturbances do not know where state boundaries lie, and as a result pests and pathogens, as well as abiotic stressors, like hurricanes, ice, and drought can affect the whole northern Forest region.
As our climate continues to change, it is projected that extreme weather events will become more frequent, which may mean more storms, wind, ice, frost, or flood events. Elevated summer temperatures, along with changes to rainfall patterns, could lead to more severe and frequent droughts. Such abiotic events can cause large areas of damage to multiple tree species (Figure 9). It is only as we continue to monitor disturbances over time that we can begin to understand the patterns of various types of events and how they may be changing.
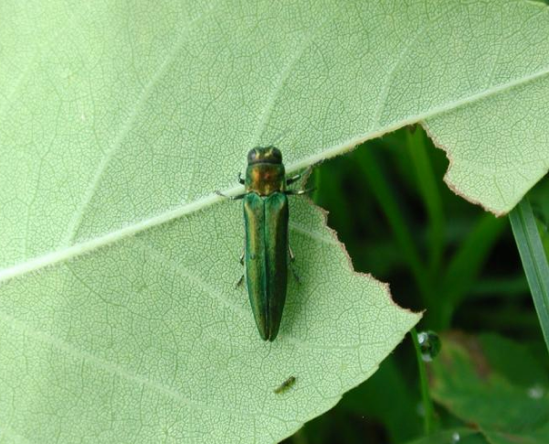
Many invasive insects and diseases have been detected in Vermont, or in neighboring states. In late February of 2018, the emerald ash borer was confirmed in the town of Orange making Vermont the 32nd state known to be infested. Overall, introduced pests and pathogens have caused much more disturbance to the region’s forests than those of native origin, and we can see widespread declines of specific species, such as ash (Fraxinus spp.) with the continued spread of emerald ash borer. The high species diversity in many of Vermont’s forest stands and continued vigilant monitoring may be helping to mitigate widespread issues and to identify problems before they become widespread.
In 2018, Vermont’s forests experienced greater levels of disturbance than in 2017 but less than the average (1995-2018). The most damaging disturbance agents in 2018 were forest tent caterpillar and white pine needle damage. Prolonged drought in 2018 also had significant impacts state-wide. The emerald ash borer was confirmed to be in Vermont in 2018.
Additional Resources
Vermont Agency of Natural Resources. 2017. Climate Change in Vermont. Available online at http://climatechange.vermont.gov/vermonts-changing-climate
Vermont Forest Parks and Recreation (VT FPR). 2018. Forest Insect and Disease
Conditions in Vermont: 2018. Report. Available online at: https://fpr.vermont.gov/sites/fpr/files/Forest_and_Forestry/Forest_Health/Library/2018%20Conditions%20report.pdf
FEMC Project Database Links
Aerial Sketchmapping: https://www.uvm.edu/femc/data/archive/project/statewide-aerial-sketchmapping-tree-defoliation-mortality