Mercury Deposition
Mercury Deposition Network Monitoring at VT99
Mercury (Hg) is a persistent pollutant that can accumulate in organisms as it moves up the food chain, leading to neurological damage, lowered reproductive success, motor skill impairment and hormonal changes in humans and animals (Driscoll et al. 2007, Evers et al. 2004). Human activities such as fossil fuel burning and waste incineration elevate levels of atmospheric mercury, which is later transferred to forests and water bodies through both dry and wet (in precipitation) deposition. Since 1992, FEMC has been collecting data on both wet and dry mercury deposition, making it one of the longest records in the U.S. In 2004, the FEMC joined the Mercury Deposition Network (MDN, part of the National Atmospheric Deposition Program) as one of over 100 sites in the U.S. and Canada. The FEMC air quality site serves as a sentinel site for the northeastern U.S. – it is high enough in elevation to detect regional mercury transport events that are not detected by other stations. This very long record has provided context to many shorter-duration studies, including the way mercury cycles through the forest canopy, how mercury bioaccumulates in birds and amphibians, how mercury levels are influenced by elevation, and how falling leaves contribute to deposition. FEMC and its partners have committed to this long-term monitoring in order to document and better understand the input of mercury into Vermont’s forested ecosystems and the inhabitants of those ecosystems, including birds, fish, bobcats and human beings.
The Data
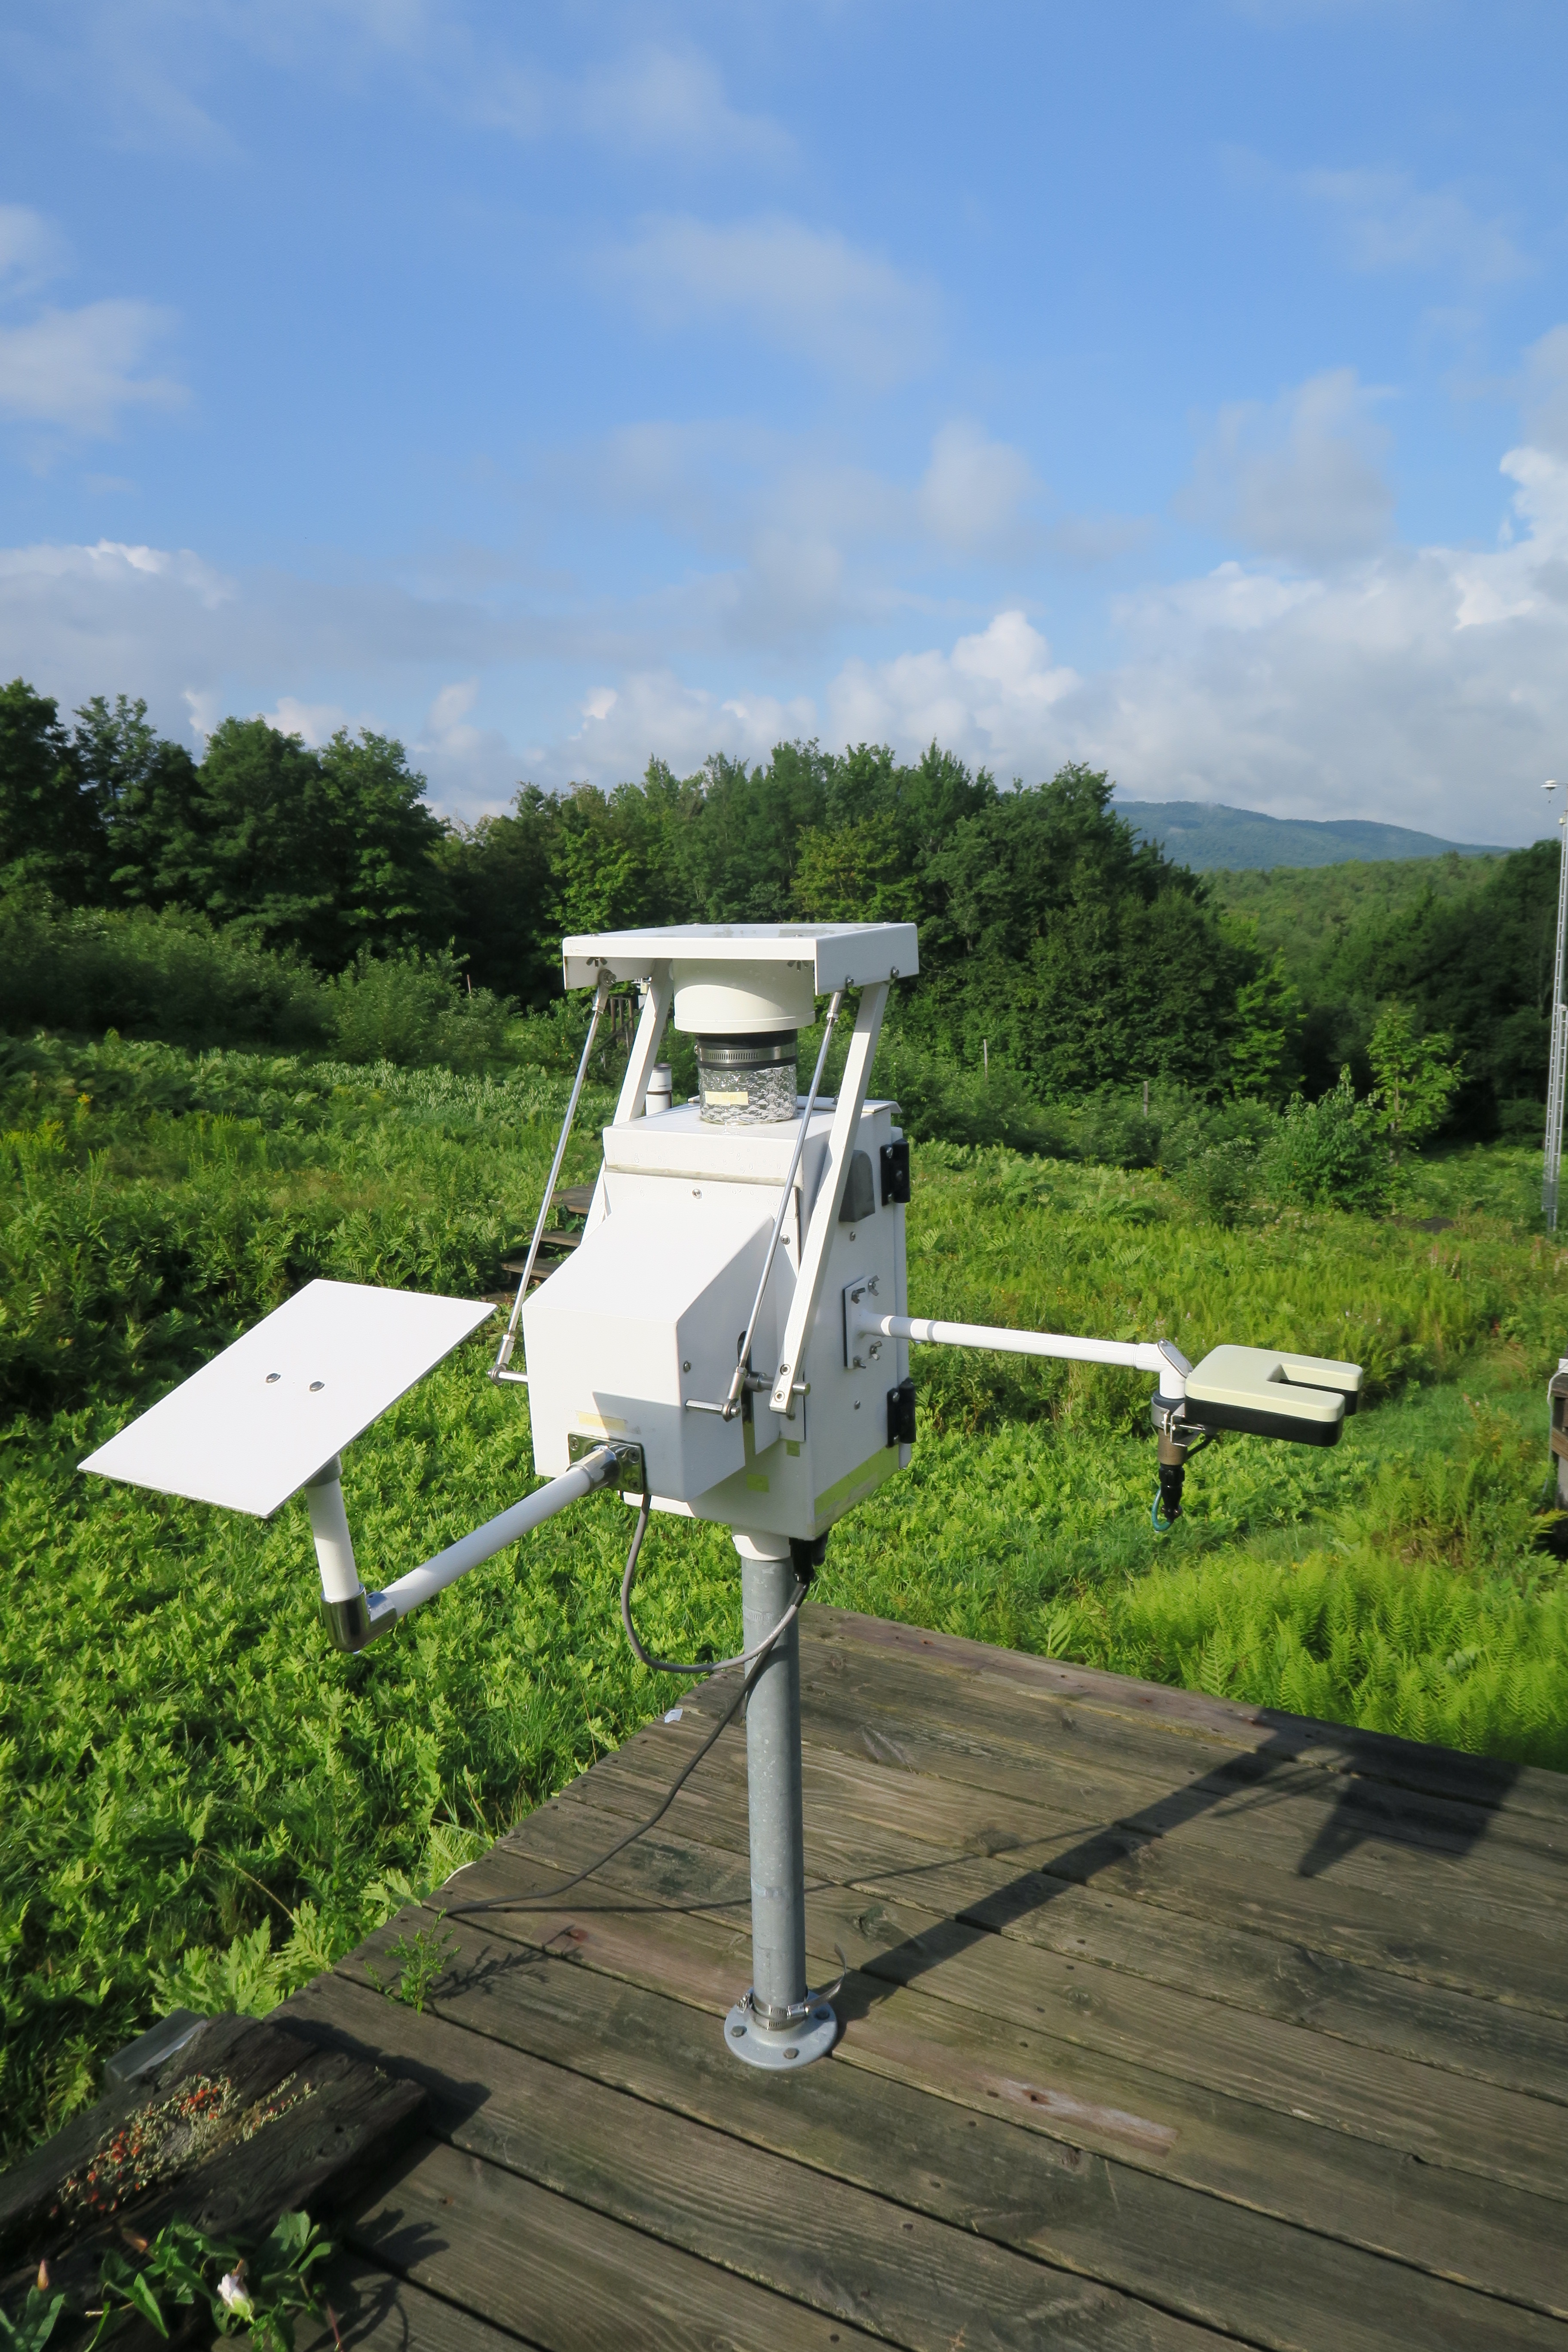
FEMC conducts year-round sampling of precipitation chemistry at the air quality-monitoring site at the Proctor Maple Research Center in Underhill, Vermont (site ID: VT99). Weekly composites of precipitation are gathered in an automated wet-only precipitation collector at the site. The collector opens automatically when rain or snow is detected, capturing precipitation through a funnel and tube sampling train into a bottle charged with hydrochloric acid (to preserve the sample). The collector is heated in the winter and vented in the summer as needed. Samples are collected every Tuesday and shipped to the Mercury Analytical Laboratory at Eurofins Frontier Global Science, Inc. in Bothell, WA for analysis of mercury concentration and cleaning of the sampling train. Data are submitted to NADP for quality control and posted on the NADP/MDN website (http://nadp.slh.wisc.edu/mdn/).
2017 in Summary
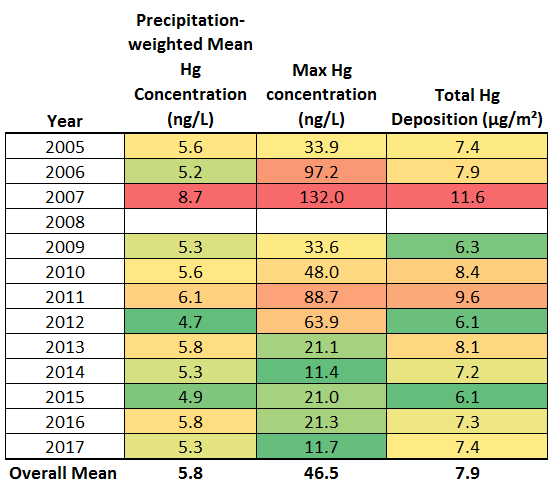
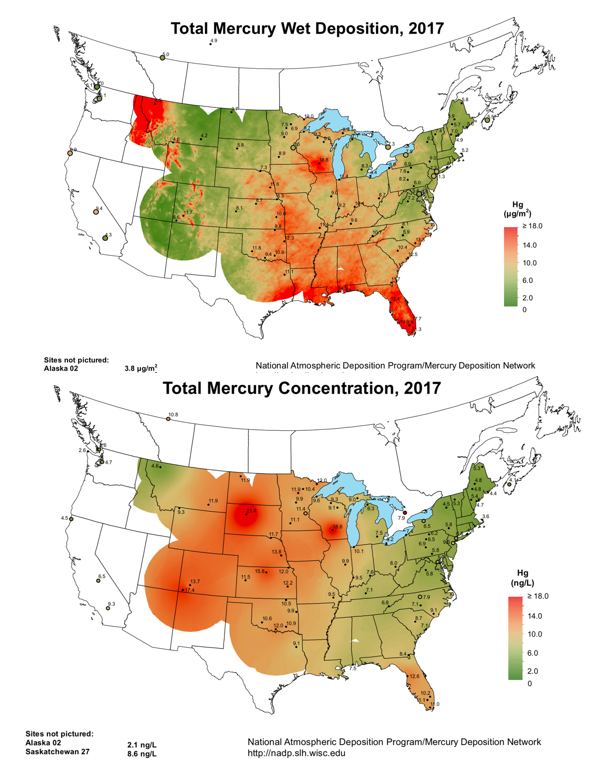
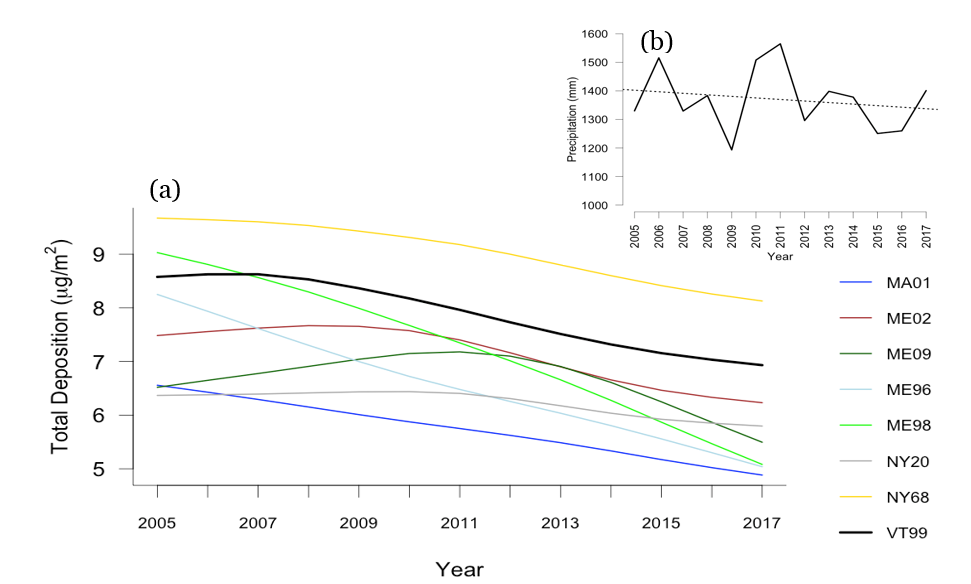
Mercury monitoring at FEMC’s air quality site VT99 for 2017 shows slightly lower mercury (Hg) deposition than average for the 13-year record, higher than 2015 and roughly equal to 2014 (Table 2). Over the entire record for VT99, total mercury deposition fluctuated from a high of 11.6 µg/m2 in 2007 to a low of 6.1 µg/m2 in 2012 and 2015. Similarly, the precipitation-weighted mean mercury concentration and the maximum mercury concentrations measured at VT99 are quite variable. In 2017, precipitation-weighted mean concentration was lower than average for the record, while the maximum recorded concentration in a single sample was well below historical average. In 2017, Vermont registered lower concentration and deposition averages than most sites elsewhere in the United States (Figure 12).
Long Term Trends
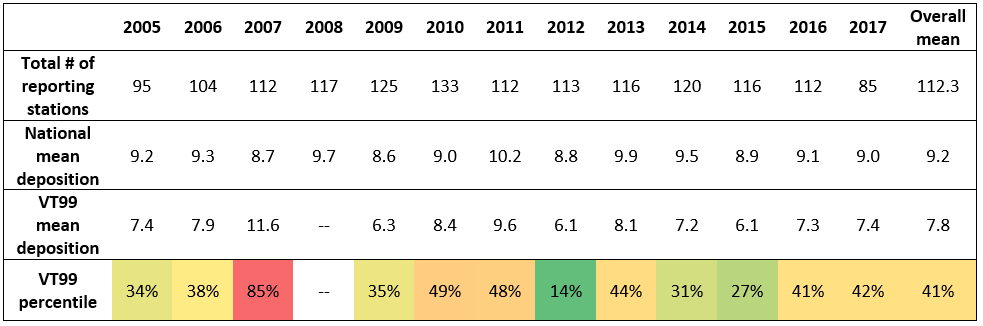
Over 13 years of monitoring at VT99, mean annual deposition was higher than 41% of national MDN sites (Table 3). The VT99 monitoring station has fallen from the high end of measured values (2007, with higher total Hg deposition than 85% of other MDN sites) and also climbed from low end of measured values (2012, with higher total Hg deposition than only 14% of other MDN sites). During most years of monitoring, the VT99 site typically falls in the middle of reported Hg deposition values across the Mercury Deposition Network (e.g., higher than 41% of sites). In 2017, we saw deposition that was similar to the long-term average (higher than 42% of other MDN sites).
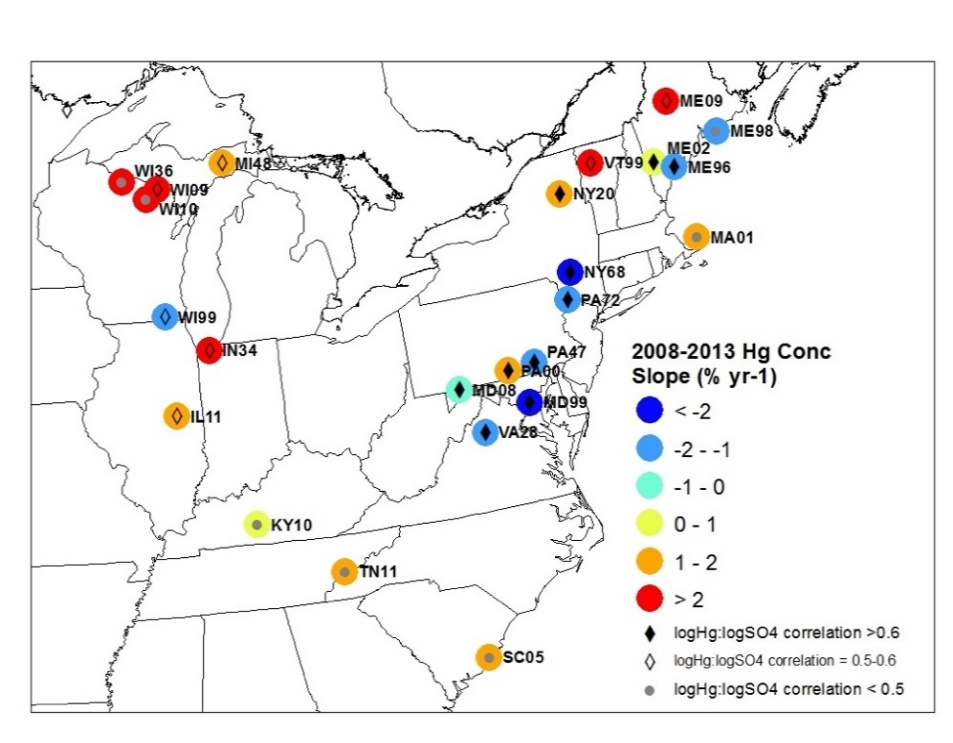
Indeed, a regional trends analysis using NADP MDN data (Figure 14) provides further signs of regional differences for VT99. Different time periods were analyzed, including the years 1997-2013 as well as several shorter portions of the record. The shorter time period analyses were a way to incorporate the changing spatial pattern into the trends analysis as the MDN network expanded. This period from 2008 to 2013 shows VT99 having a statistically significant positive slope in increased mercury concentrations. While five years is too short for a definitive trend, these results may suggest that VT99 has been more influenced by global sources compared to other MDN sites due to its relatively high elevation and the absence of nearby coal utility boilers (Weiss-Penzias et al. 2016).
Implications
In the long term, mercury deposition levels have decreased dramatically with the amendments to the Clean Air Act in 1990 (Kamman and Engstrom 2002). This legislation identified mercury as a toxic pollutant to be controlled to the greatest possible extent. However, as we have seen in Vermont, mercury deposition has not declined like other air pollutants.
Historically, sulfate emissions were strongly correlated with mercury emissions because they shared the same primary source -- coal-fired utility boilers -- but with the impressive reduction in sulfates mandated by the Clean Air Act, sulfates are no longer well correlated to mercury. In the northeastern region, mercury concentrations have not fallen as precipitously as expected. This suggests that mercury deposition in Vermont is not associated with regional sulfate emissions and may have other sources. Indeed, it is possible that the mercury falling in Vermont originates from overseas.
The atmosphere is the main pathway for mercury into Vermont’s ecosystems. It has been estimated that more than half of atmospheric mercury deposition falls in a dry form. Dry deposition is more difficult to measure than wet deposition (e.g., falls with precipitation); however, NADP is committed to expanding its network of mercury dry deposition sites. Unfortunately, the FEMC had to terminate its Atmospheric Mercury Network (AMNet) site to assessed dry deposition on Dec. 31, 2015; therefore, dry deposition rates have to be inferred from wet deposition rates.
Mercury persists in the environment and continues to be cycled through the various storage pools (i.e., soils, air, biota). The continued low-level input and occasional spikes in mercury deposition will likely drive cumulative increases in mercury in Vermont’s forests moving forward. Forest ecosystems and the organism that live there are particularly sensitive to these inputs (Driscoll et al. 2007, Gay 2016, pers comm, Weiss-Penzias et al. 2016). Conifers tend to have higher concentrations of bark and foliar mercury (Yang et al. 2018). Fish mercury burdens are one way to track these trends and in Vermont, and fish advisories are still being issued (Chalmers et al. 2014, Vijayaraghavan et al. 2014). Until fish tissue sampling shows a long-term negative trend, the need to monitor ecosystem mercury is critical. Mercury cycling and bioaccumulation is complex process that is not fully understood.
As of October 2018, the Environmental Protection Agency’s Mercury and Air Toxics Standards (MATS), which implements emissions reductions of toxic air pollutants, like mercury, from existing and new coal and oil-fired power plants, is under review by the EPA. If MATS continues in its current form, we should see a continued downward trend in mercury deposition from regional sources in Vermont and the Northeast.
Conversely, greater global mercury emissions could mean more deposition for everyone, and potentially higher fish concentrations and therefore higher concentrations in VT humans. This underscores the need to curtail anthropogenic contributions in Vermont and worldwide.

In 2017, Vermont saw one of the lowest maximum concentrations of mercury in the 13-year record. However, Vermont’s mercury deposition has not been decreasing as quickly as hoped, highlighting the role of monitoring for identifying patterns regional and global of mercury pollution.
References
- AMAP/UNEP, 2015. Global Mercury Modelling: Update of Modelling Results in the Global Mercury Assessment 2013. Arctic Monitoring and Assessment Programme, Oslo, Norway/UNEP Chemicals Branch, Geneva, Switzerland. iv + 32 pp. Available online at: http://www.unep.org/chemicalsandwaste/Portals/9/Mercury/GMA%20Report/Report%20-%20Modelling%20update%20of%20the%20GMA2013.pdf.pdf
- Chalmers, A.T., Krabbenhoft, D.P., Van Metre, P.C. and Nilles, M.A., 2014. Effects of urbanization on mercury deposition and accumulation in New England. Environmental Pollution, 192, pp.104-112.
- Driscoll, C. T., Han, Y. J., Chen, C. Y., Evers, D. C., Lambert, K. F., Holsen, T. M., and R.K. Munson. (2007). Mercury contamination in forest and freshwater ecosystems in the Northeastern United States. Bioscience, 57(1), 17-28. doi: 10.1641/b570106.
- Gay, D. 2016. Pers comm.
- Evers, D.C., Lane, O.P., Savoy, L. and W. Goodale. 2004. Assessing the Impacts of Methylmercury on Piscivorous Wildlife Using a Wildlife Criterion Value Based on the Common Loon, 1998–2003. Gorham (ME): Maine Department of Environmental Protection, BioDiversity Research Institute. Report no. BRI 2004-05.
- Kamman, N.C., and D.R. Engstrom. 2002.Historical and present fluxes of mercury to Vermont and New Hampshire lakes inferred from 210Pb dated sediment cores. Atmospheric Environment 36: 1599–1609.
- Mahaffey KR. 2005.Update on recent epidemiologic mercury studies. Pages 31–33 in Proceedings of the 2004 National Forum on Contaminants in Fish; 25–28 January 2004, San Diego, California. Report no. EPA-823-R-05-006.
- National Atmospheric Deposition Program (NADP). 2018. National Atmospheric Deposition Program 2017 Annual Summary. NADP Data Report 2018-01. Wisconsin State Laboratory of Hygiene, University of Wisconsin-Madison, WI.
- Rimmer, C.C., E.K. Miller, K.P. McFarland, R.J. Taylor, S.D. Faccio. 2010. Mercury bioaccumulation and trophic transfer in the terrestrial food web of a montane forest. Ecotoxicology 19(4):697-709. doi: 10.1007/s10646-009-0443-x.
- Vijayaraghavan, K., Levin, L., Parker, L., Yarwood, G. and Streets, D., 2014. Response of fish tissue mercury in a freshwater lake to local, regional, and global changes in mercury emissions. Environmental toxicology and chemistry, 33(6), pp.1238-1247.
- Weiss-Penzias, P.S., Gay, D.A., Brigham, M.E., Parsons, M.T., Gustin, M.S. and ter Schure, A., 2016. Trends in mercury wet deposition and mercury air concentrations across the US and Canada. Science of The Total Environment. Available online at http://dx.doi.org/10.1016/j.scitotenv.2016.01.061
- Yang Y., Yanai R.D., Driscoll C.T., Montesdeoca M., Smith K.T. 2018. Concentrations and content of mercury in bark, wood, and leaves in hardwoods and conifers in four forested sites in the northeastern USA. PLoS ONE 13(4): e0196293. https://doi.org/10.1371/journal.pone.0196293
Additional Resources
- Vermont Health Department Fish Consumption Recommendations: http://healthvermont.gov/enviro/fish_alert/documents/fish_alert.pdf
- Global Sources of Local Pollution: An Assessment of Long-Range Transport of Key Air Pollutants to and from the United States. 2009. National Academy of Sciences. Chapter 4, Mercury: Atmospheric Mercury Primer. https://www.nap.edu/read/12743/chapter/6#99
FEMC Project Database Link
- Wet Deposition of Mercury at Proctor Maple Research Center (Mercury Deposition Network-MDN) https://www.uvm.edu/femc/project/wet-deposition-mercury-proctor-maple-research