Forest Birds
Breeding Bird Surveys
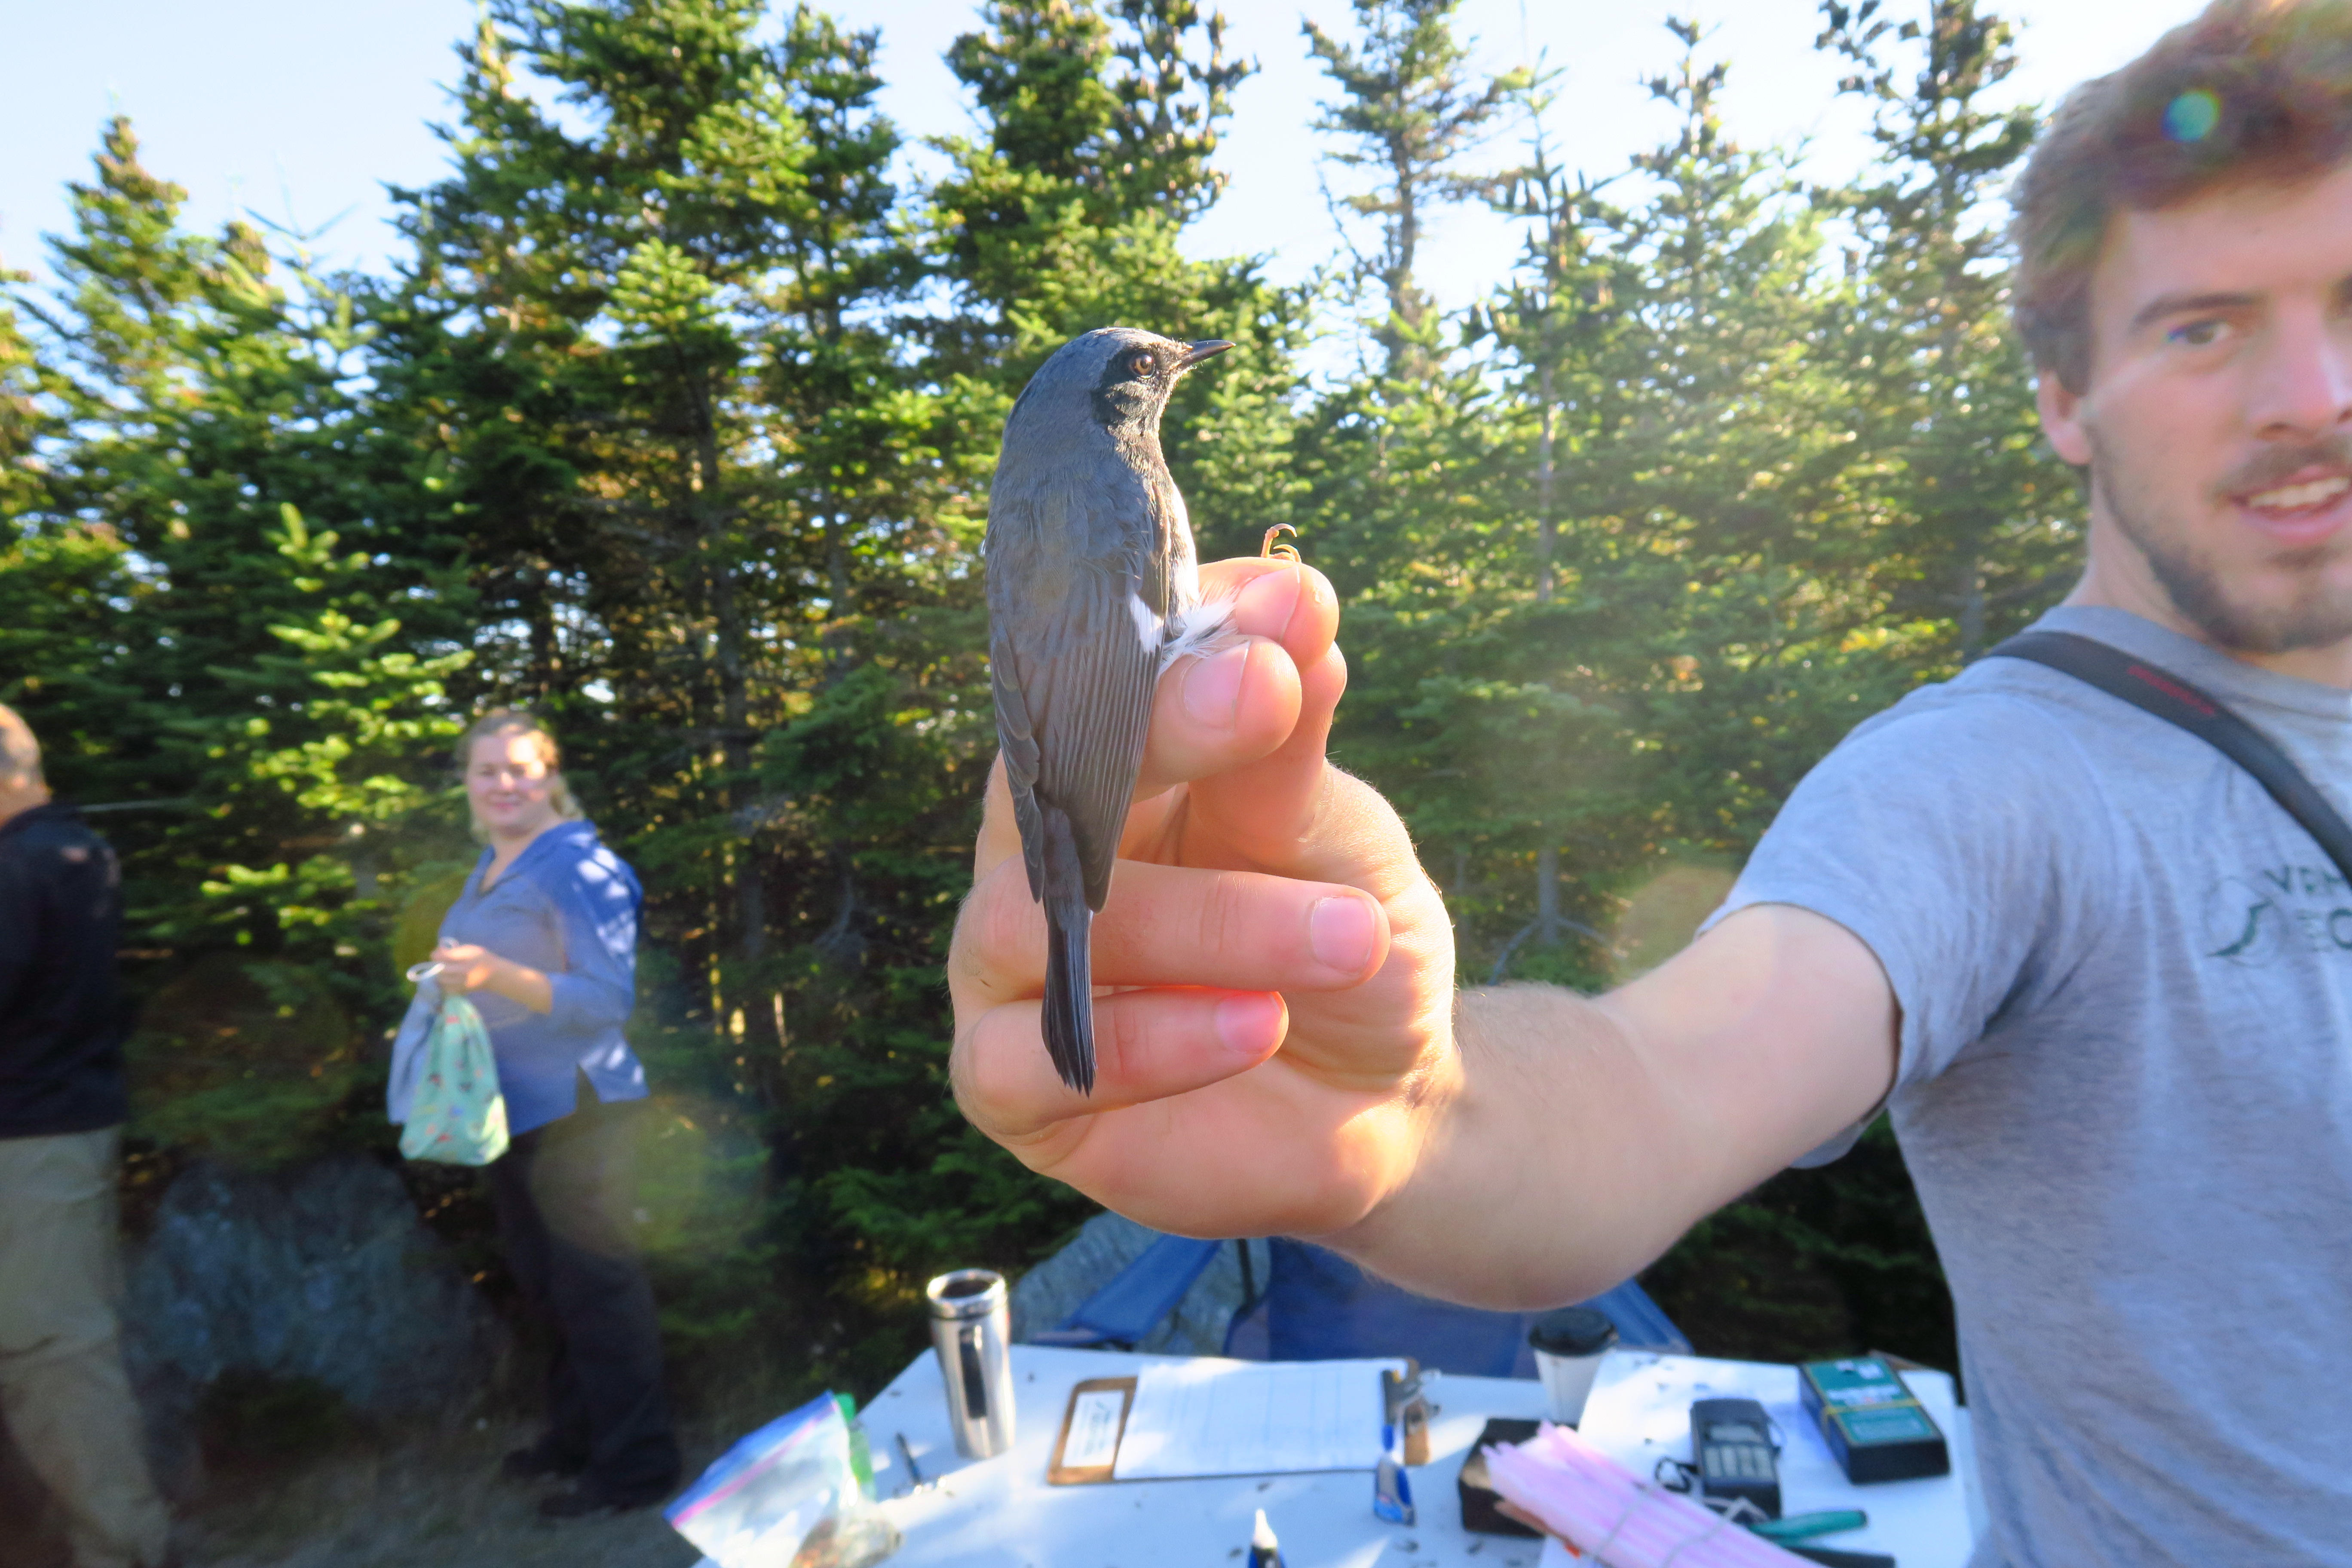
In 2017, the Vermont Center for Ecostudies (VCE) continued demographic monitoring of Bicknell’s Thrush (Catharus bicknelli), Swainson’s Thrush (C. ustulatus), Blackpoll Warbler (Setophaga striata), Yellow-rumped (Myrtle) Warbler (S. coronata coronata), White-throated Sparrow (Zonotrichia albicollis), and other songbirds, completing the 26th consecutive field season on the Mt. Mansfield ridgeline. VCE also conducted Year 2 of a complementary study to monitor potential phenological mismatching between insectivorous songbirds and other trophic groups. Regular monitoring is essential to assess trends in species presence, species richness, population levels, and demographics. With the addition of phenological information, improved understanding can inform conservation strategies. Such information is critical to the preservation of sensitive species.
The Data
Breeding bird surveys were conducted at permanent study sites located on the west slope of Mt. Mansfield in Underhill State Park (UNSP) and at the Lye Brook Wilderness Area (LBWA). These two study sites are part of VCE’s long-term Forest Bird Monitoring Program (FBMP), which was initiated in 1989 with the primary goals of conducting habitat-specific monitoring of forest interior breeding bird populations in Vermont and tracking long-term changes (Faccio et al. 1998, 2017).
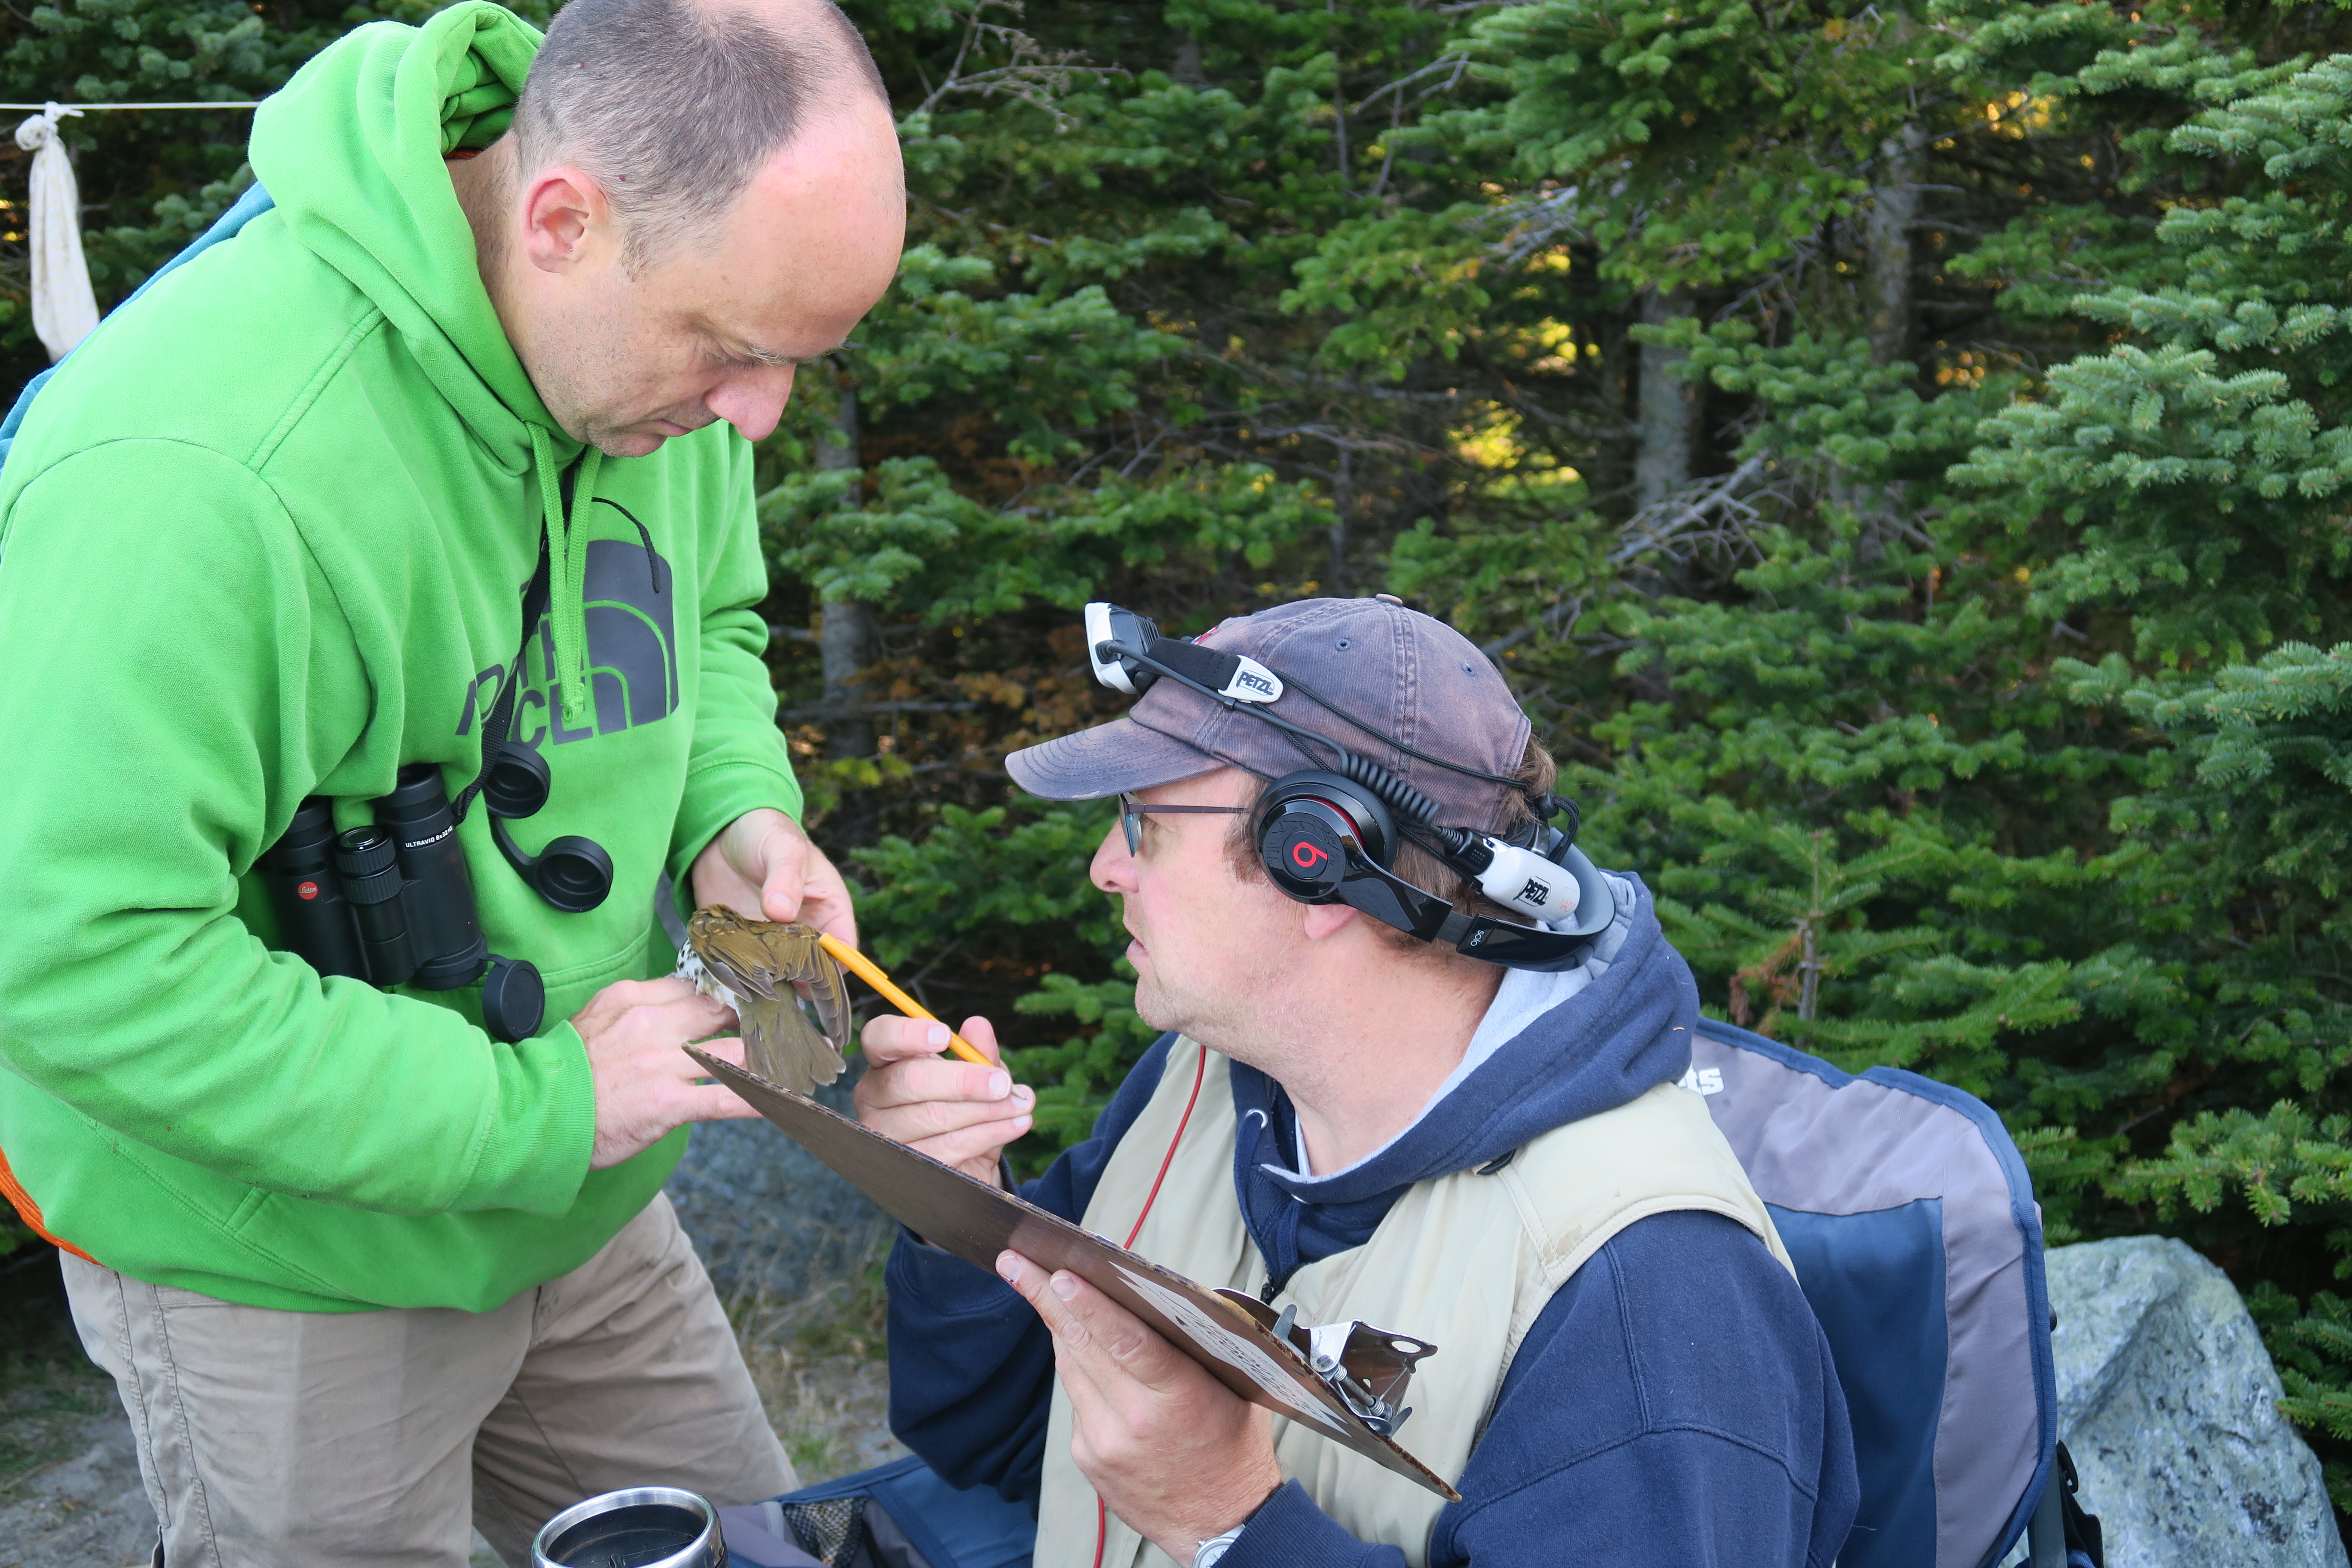
Each study site contains 5 point count stations. Survey methods include unlimited distance point counts, based on the approach described by Blondel et al. (1981) and used in Ontario (Welsh 1995). Counts begin shortly after dawn on days where weather conditions are unlikely to reduce count numbers. Observers record all birds seen and heard during a 10-min sampling period, divided into 2, 3, and 5-minute intervals. Montane fir-spruce sites on Mt. Mansfield were sampled once, while hardwood-dominated sites at LBWA and Underhill were sampled twice during the breeding season.
2017 in Summary
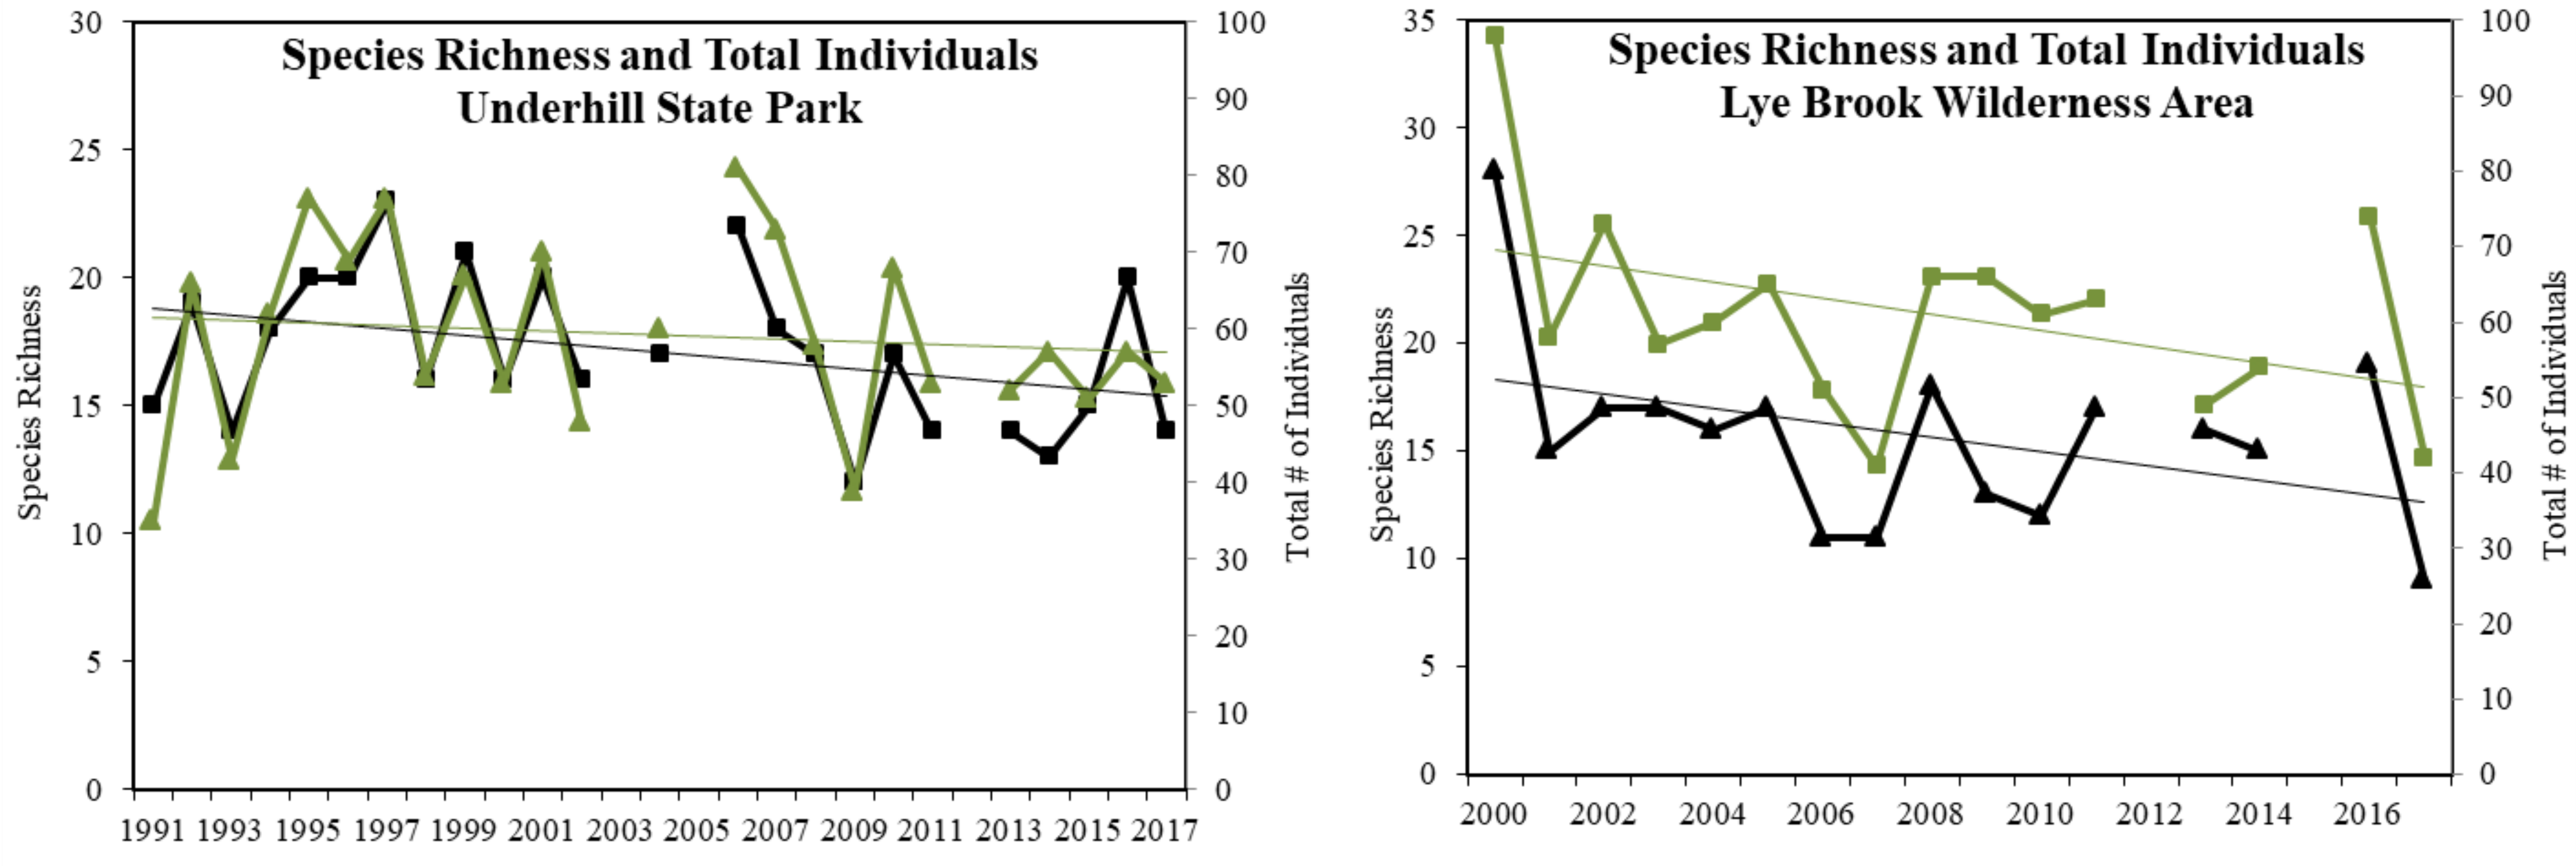
Surveys at the mid-elevation, northern hardwood study sites at Underhill State Park and Lye Brook Wilderness showed similar species composition, with a total of 50 and 49 species detected over all survey years, respectively. In 2017, the number of individual birds and species richness declined at both UNSP and LBWA, continuing the long-term downward trends for both these metrics (Figure 22). The long-term trends for both number of individuals and species richness have declined slightly at both sites (Figure 22).
Long Term Trends
Mt. Mansfield Ridgeline – In 2017 there were 413 bird captures comprising 312 individuals of 30 species, including 263 new bandings, 52 returns from previous years, and 23 within-season recaptures.
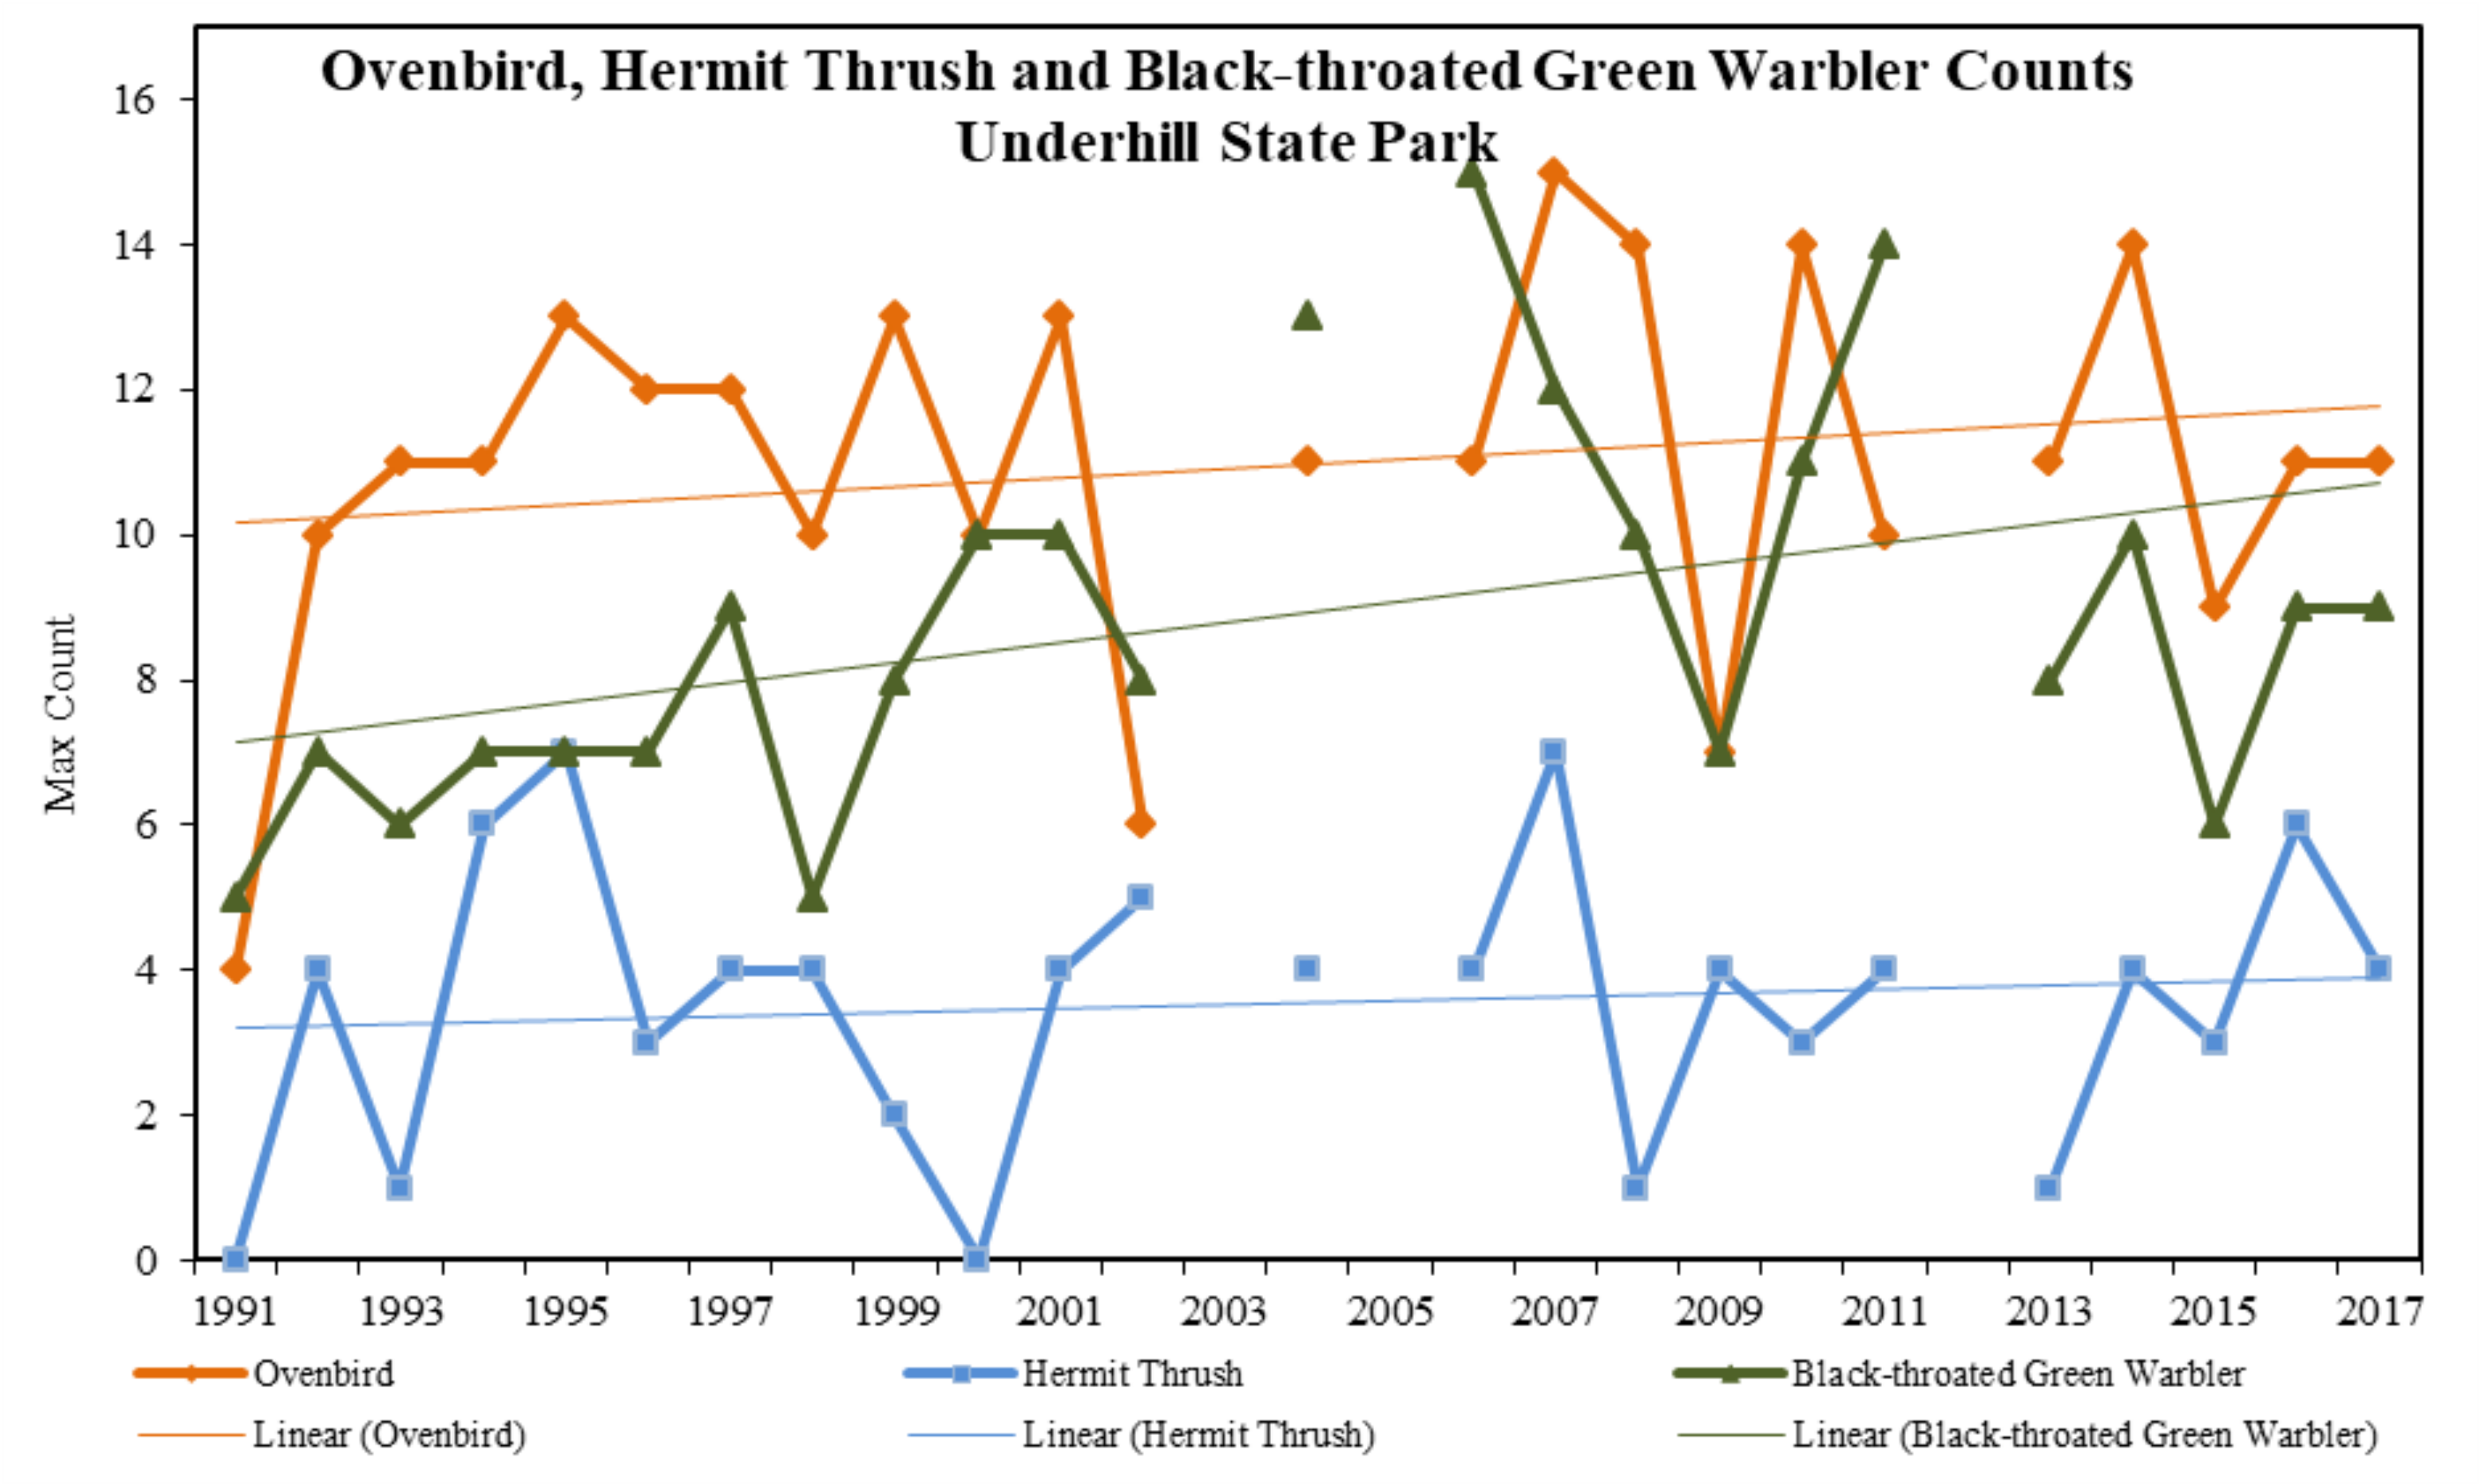
Underhill State Park – Total number of individuals and species richness decreased from 2016, with 53 individuals of 14 species recorded, including a Swainson’s thrush, the first since 2009. Among the nine most common species, five were above the 26-year mean, and four were below. Overall, 2017 counts of Ovenbird and Black-throated Green Warbler were the same as 2016; while the long-term trend for Hermit Thrush, Vermont’s State bird, remained relatively flat (Figure 23). These results reflect the broader, 26-year trends observed for these three species in the statewide Vermont FBMP dataset, in which both Black-throated Green Warbler and Ovenbird significantly increased, while Hermit Thrush showed no trend (Faccio et al. 2017). A single Canada Warbler was again detected in 2017; this species is declining at a rate of 4.13% annually (R2=0.634), representing the sharpest decline among the nine most commonly detected species.
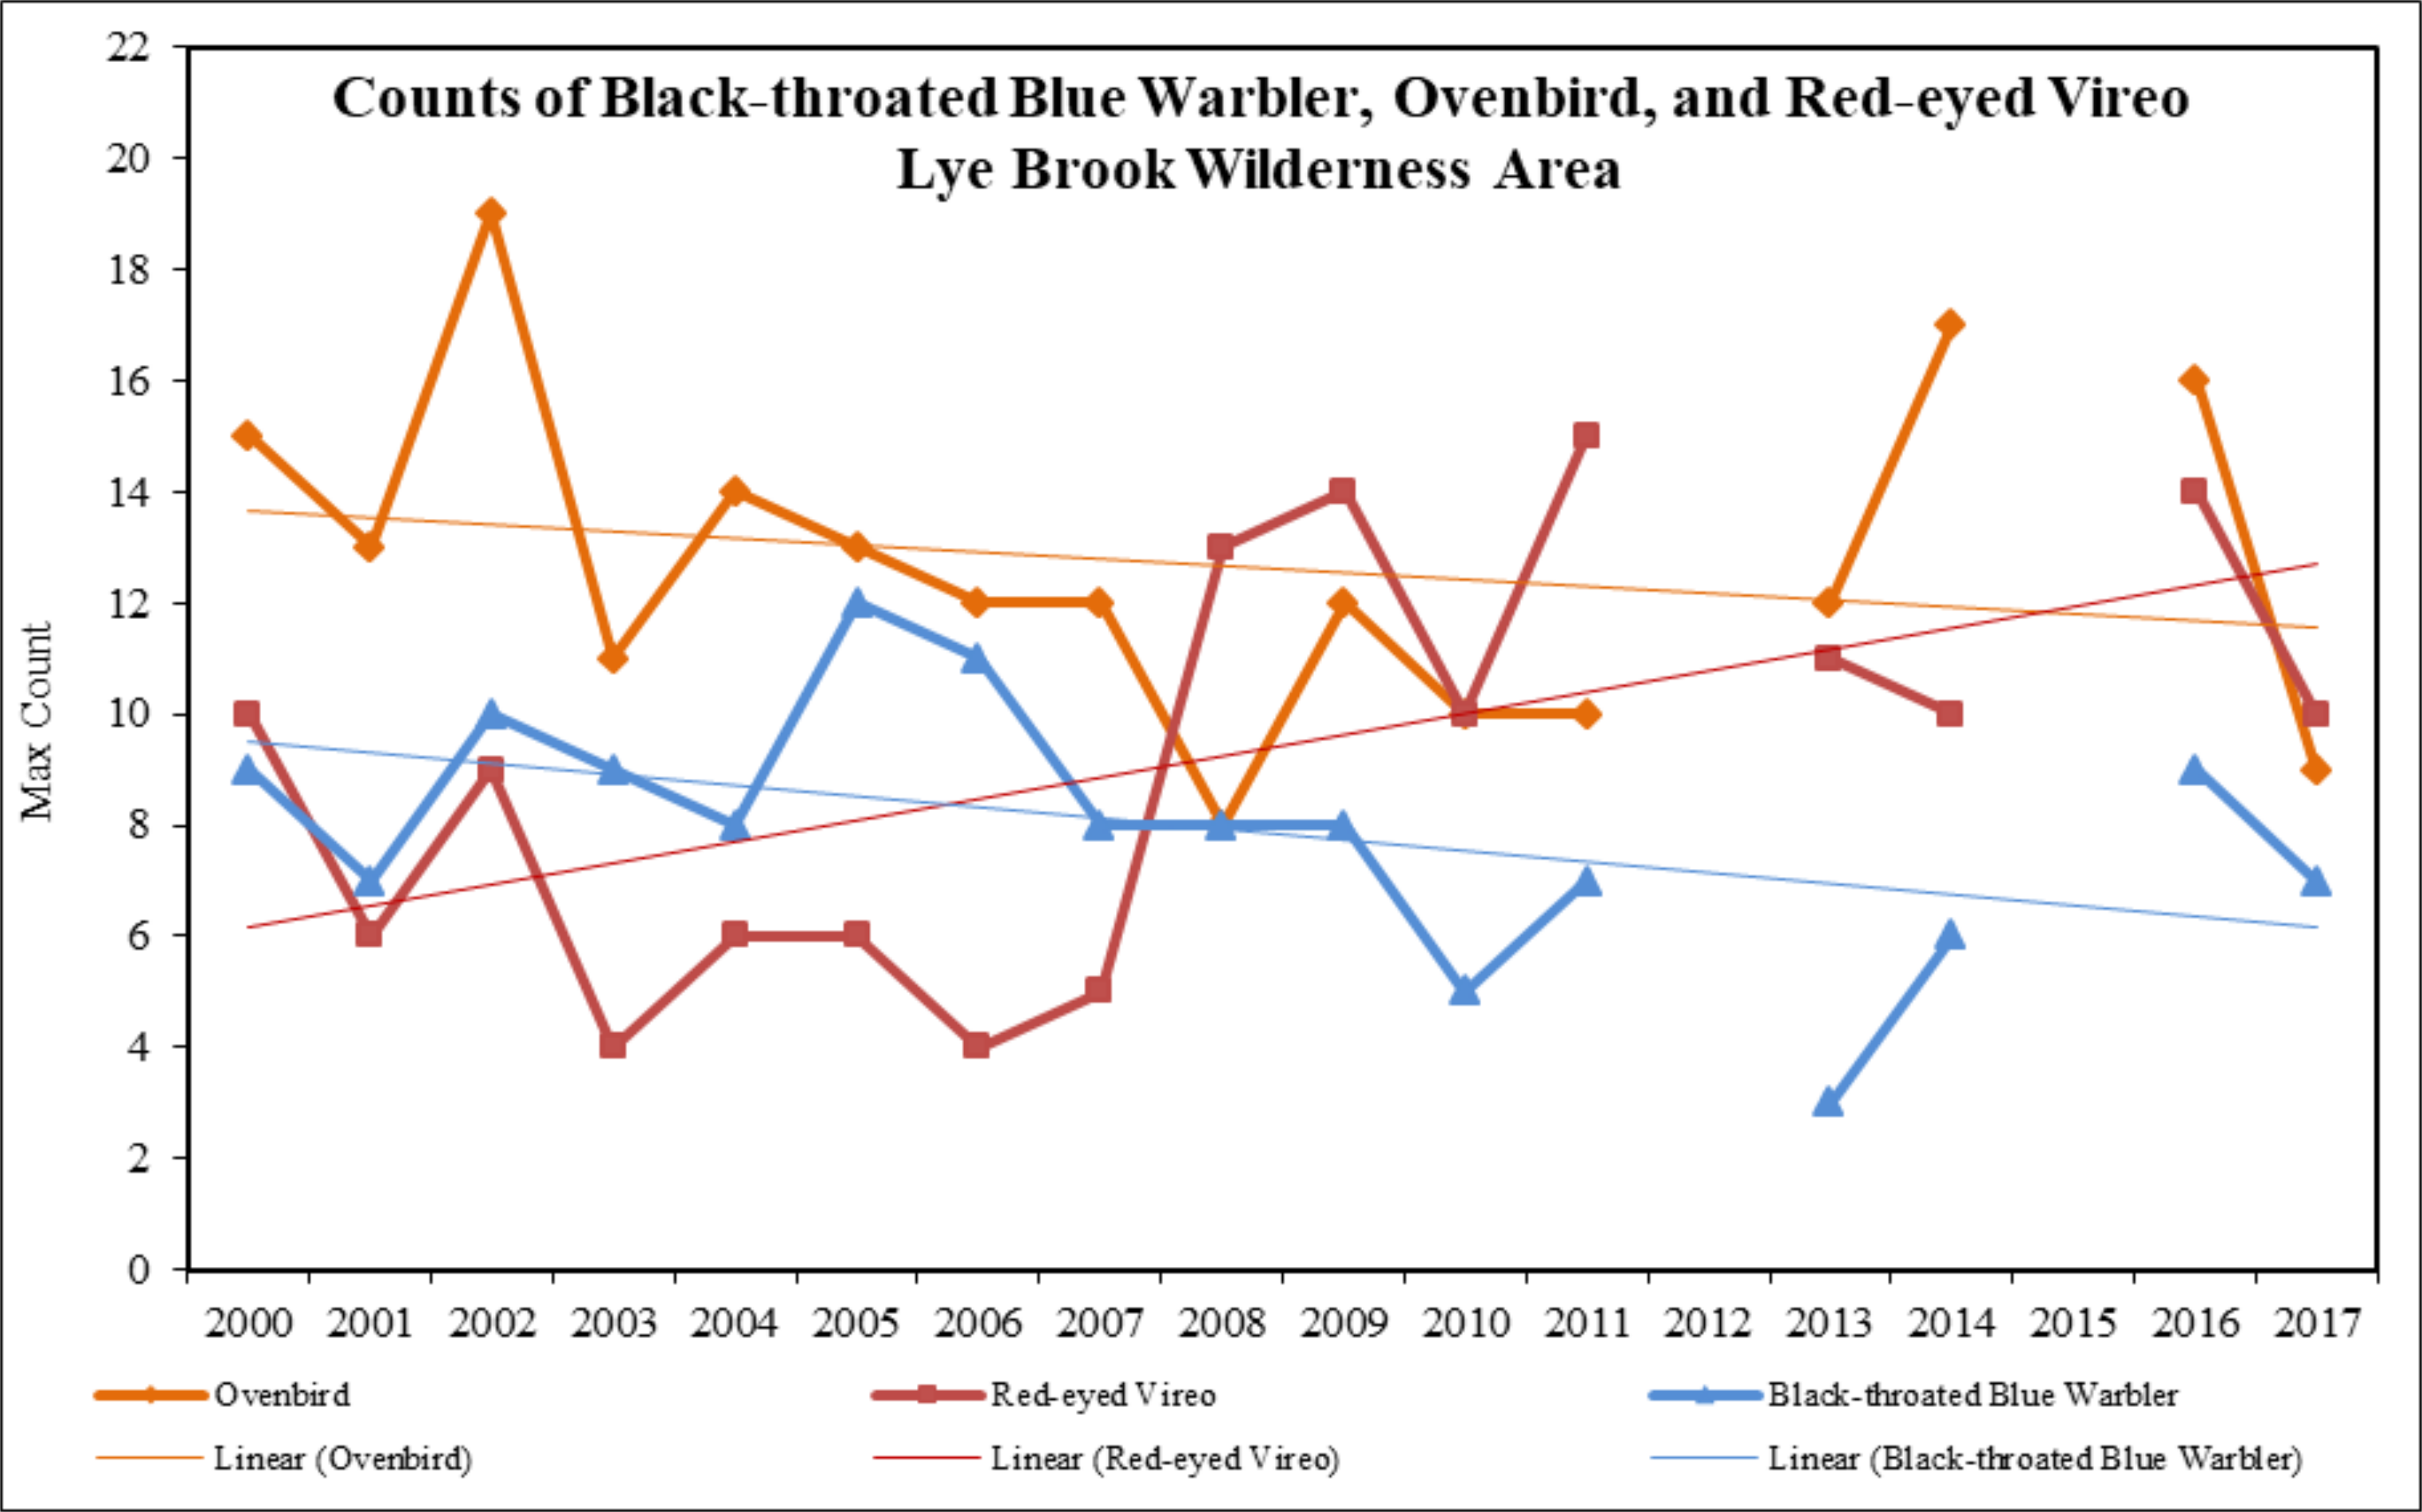
Lye Brook Wilderness Area – After relative abundance and species richness reached near-record levels in 2016, both metrics declined significantly in 2017, with relative abundance dropping to its second lowest level in the survey’s 16-year history (n=42) and species richness its lowest (n=9) (Figure 24). Among the nine most common species, counts of all nine declined from 2016, and only Red-eyed Vireo remained above its 16-year average. The long-term trend for Black-throated Blue Warbler showed a moderate decline of -2.03% per year (R2 = 0.224) (Figure 24), while Red-eyed Vireo showed a strong upward trend, increasing by 6.69% annually (R2 = 0.311) (Figure 24), mirroring the significant statewide trend exhibited by VCE’s 25-year study (Faccio et al. 2017).
Implications
Long-term trends of forest birds at both UNSP and LBWA suggest that the relative abundance of the total number of birds detected has declined slightly over the survey period. However, it should be noted that site-specific trend estimates must be interpreted with caution, as these data are from a limited geographic sample and can be greatly influenced by years with extreme high or low counts. Also, year-to-year changes in survey counts may simply reflect natural fluctuations in abundance, differences in detection rates of observers and/or species, variability of singing rates due to nesting stage, and/or a variety of dynamic factors, such as predator or prey abundance, overwinter survival, effects of diseases such as West Nile Virus, and local habitat change.
Not surprisingly, most of the strongest population trends observed at both study sites—including the increasing trends of Black-throated Green Warbler at UNSP and Red-eyed Vireo at LBWA, and the declining trend of Canada Warbler at UNSP—reflect the broader statewide trends for these species during the 25-year study of the Vermont Forest Bird Monitoring Program (Faccio et al. 2017).
It is unknown which of the many anthropogenic stressors (e.g., habitat degradation and loss due to development, land use change, acid precipitation and other atmospheric pollutants, or changing climatic conditions) may be contributing to these population trends, but it is likely all have had impacts. In addition, migratory species, whether short- or long-distance Nearctic-Neotropical migrants, have declined across Vermont forests, while year-round residents showed no trend (Faccio et al. 2017). This suggests that migratory species face additional limiting factors, both on their wintering grounds and during migratory stopovers that could be impacting populations. Continued data collection and comparison with survey data from other ecologically similar sites will be necessary to fully elucidate population trends of various species at these sites.
Black-throated Green Warbler and Red-eyed Vireo show increasing trends at long-term sites. Canada Warbler shows a strong decreasing trend at long-term sites. These changes mirror findings statewide, and could represent the influence of many anthropogenic stressors and/or natural factors.
References
- Blondel, J., C. Ferry, and B. Frochot. 1981. Point counts with unlimited distance. Pp. 414-420, In C. John Ralph and J. Michael Scott (Eds.). Estimating numbers of terrestrial birds. Studies in Avian Biology 6: 630pp.
- Faccio, S.D., C.C. Rimmer, and K.P. McFarland. 1998. Results of the Vermont Forest Bird Monitoring Program, 1989-1996. Northeastern Naturalist 5(4): 293-312.
- Faccio, S.d.,J.D. Lambert, and J.D. Lloyd. 2017. The status of Vermont forest birds: A quarter century of monitoring. Vermont Center for Ecostudies, Norwich, VT. 32pp.
- Welsh, D.A. 1995. An overview of the Forest Bird Monitoring Program in Ontario, Canada. Pp. 93-97, In C.J. Ralph, J.R. Sauer, and S. Droege, (Eds.). Monitoring bird populations by point counts. General Technical Report PSW-GTR-149. Pacific Southwest Research Station, Forest Service, U.S. Dept. of Agriculture, Albany, CA. 181pp.
Additional Resources
- For more information on Bicknell's thrush and changing phenology, please visit:https://vtecostudies.org/blog/the-mount-mansfield-phenology-project
FEMC Project Database Link
- Forest Bird Surveys: https://www.uvm.edu/femc/data/archive/project/forest-bird-surveys