Climate
Climate Monitoring in Vermont and the Northeast
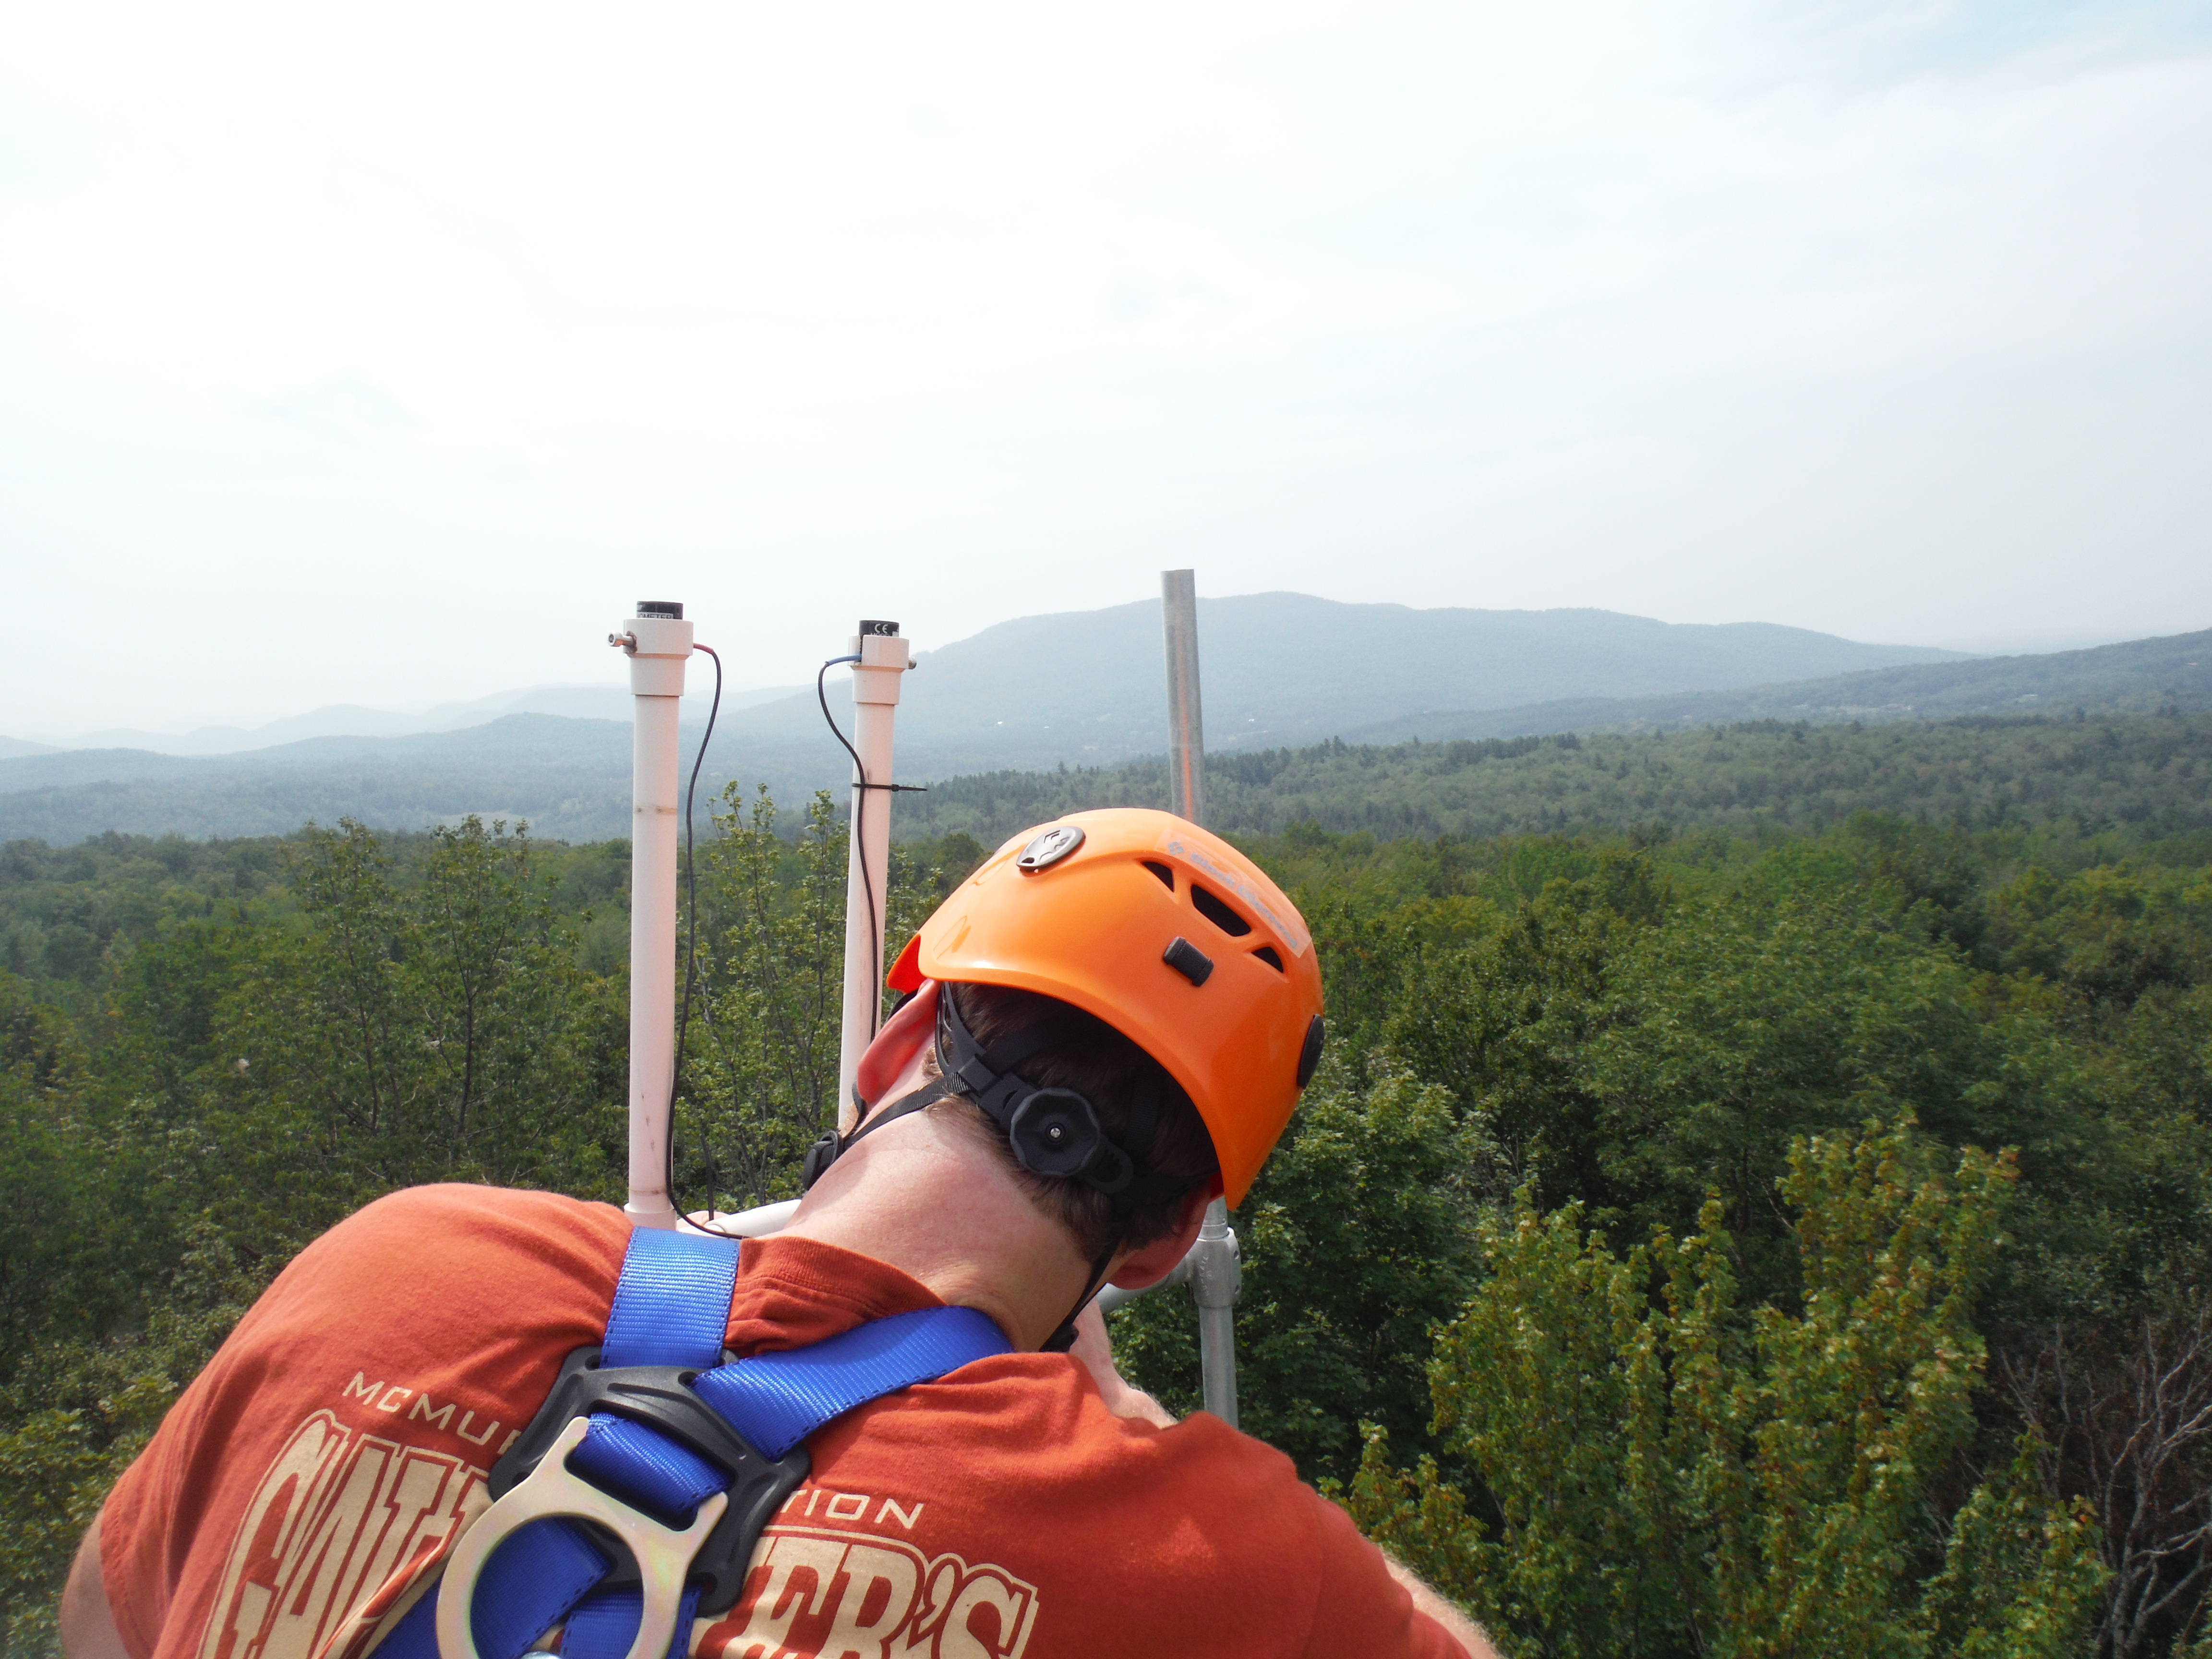
The Forest Ecosystem Monitoring Cooperative (FEMC) has been monitoring weather conditions in Vermont for over 20 years. FEMC currently operates seven meteorological stations across a range of elevations and cover types, maintaining real-time data streams and archiving of long-term data. In addition, the Northeast Regional Climate Center (NRCC) provides detailed information on trends in climate and weather for the Northeast.
Weather and climate are related but very different phenomena. Weather is the condition of the atmosphere (precipitation, temperature, etc.) over the short term, while climate refers to long-term trends and seasonal patterns. Without long-term weather records it would be impossible to tease out short-term (i.e. yearly) anomalies from more ecologically significant climate trends, which makes this information critical to scientists and planners of all kinds.
The Data
Continuous meteorological observations are taken at seven FEMC sites from the shores of Lake Champlain to slopes of Mt. Mansfield. To add temporal and spatial depth to our summary, we expanded the climate summary for 2017 beyond the FEMC monitoring stations in Vermont to include trends from the surrounding 11 states (Maine, New Hampshire, New York, Massachusetts, Connecticut, Rhode Island, New Jersey, Pennsylvania, West Virginia, Delaware, and Maryland) using records from the NRCC. This regional summary provides a broader picture of emerging trends across a larger region. Much of the following regional summary is adapted from the NRCC annual summary1.
2017 Vermont Summary
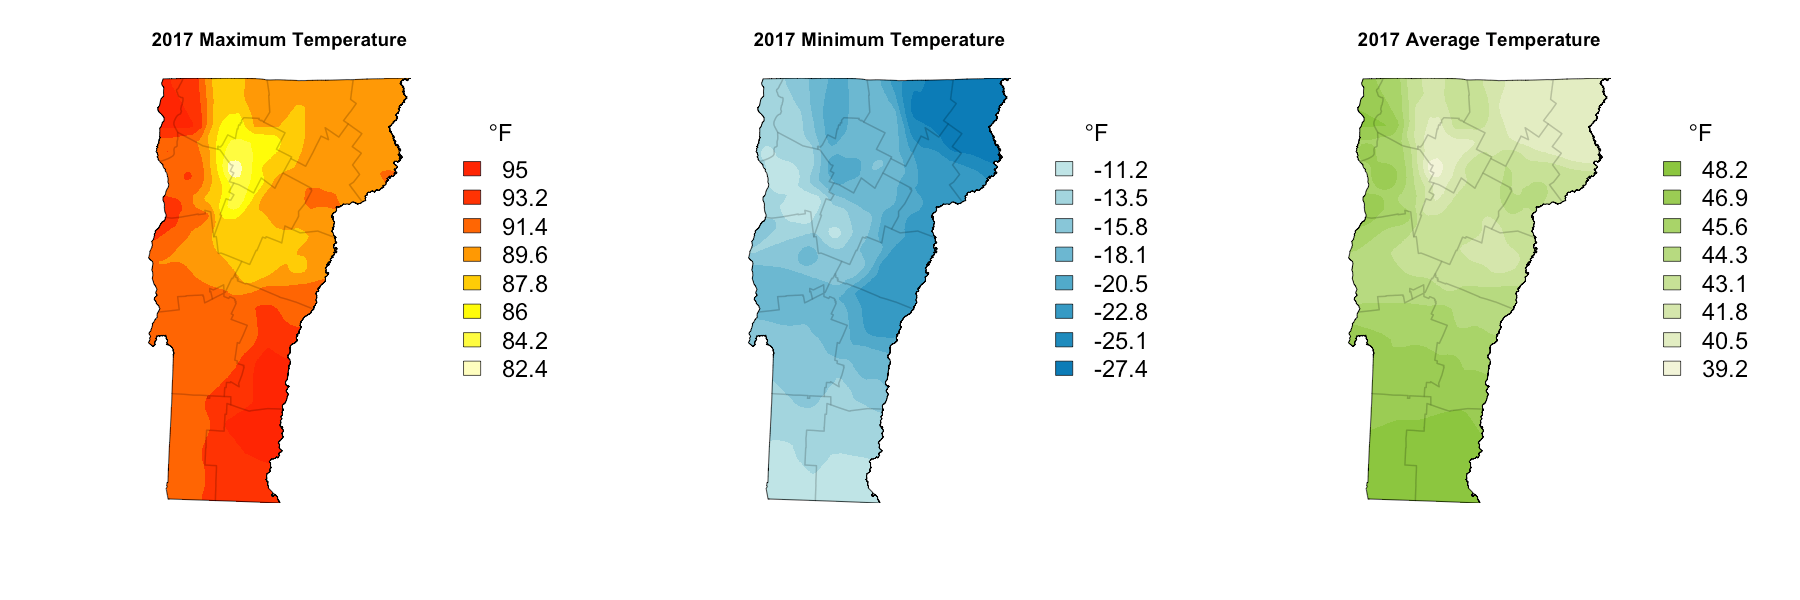
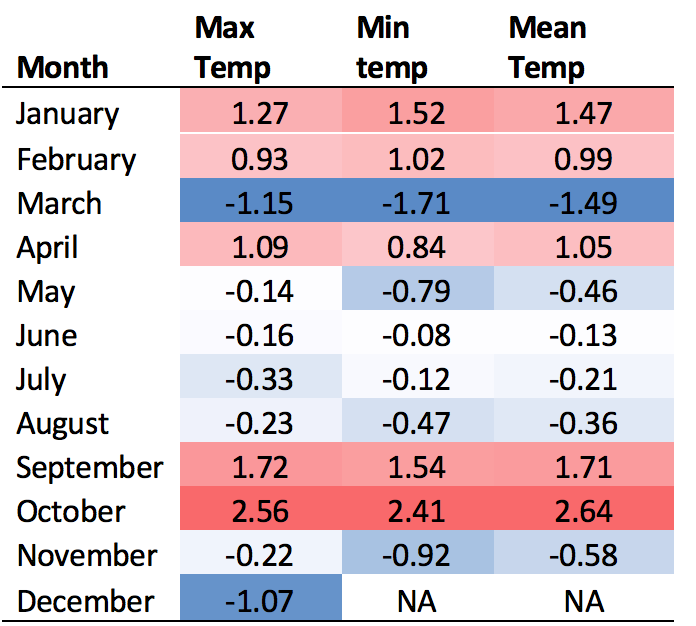
Overall, 2017 had variable temperatures for Vermont, with above-normal average temperatures recorded at the Mount Mansfield weather station in five months and below-normal in seven months (Table 5). Superlative temperatures across the state are in Figure 16.
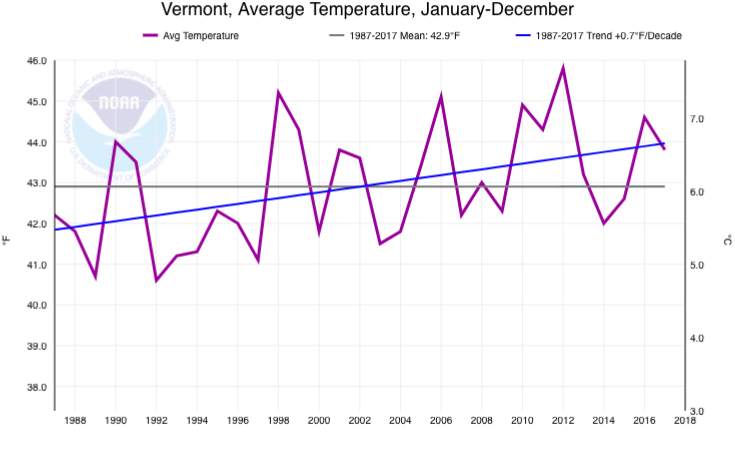
The annual statewide average temperature was approximately 1°F above the average for the last 30 years, and matches the predicted value based on the last 30 years of record keeping (Figure 17). Although, 2017 was another warmer than normal winter for Vermont at an average of 24.8° F (ranked 3rd warmest on record), it was colder than the record high average of 26.6° F in 2016.
2017 Regional Summary
Temperature
The climate pattern in the Northeast during 2017 is generally one of warmer than normal temperatures (Table 5) with extreme local precipitation events (Figure 19). Most areas emerged from a warm winter to a cool spring. Although there were local extreme snow events, the winter did not follow a single trajectory across the region.
The region’s average temperature was 48.8°F, which was 1.5°F above normal (Table 5). Nine out of twelve states ranked 2017 among their top ten warmest years on record.
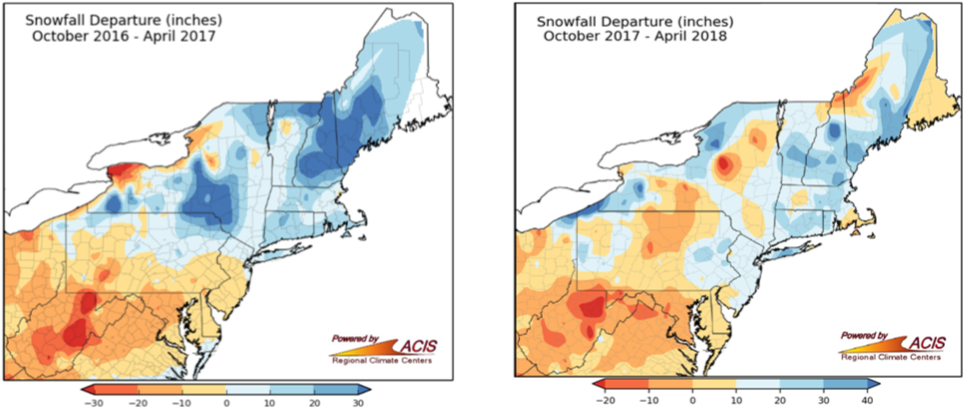
The year started with a warmer than normal winter: winter 2016-17 was the fifth warmest on record for the Northeast with an average temperature of 30.6°F, 4.7°F above normal. Five out of six New England states each had at least a fifth warmest winter on record, while Maryland, New York, Pennsylvania and West Virginia all had at least their third warmest winters. Snowfall varied across the region, with five states (Maine, New Hampshire, New York, Pennsylvania and West Virginia) receiving above average snowfall (Figure 18).
The 2017 spring was slightly warmer than average for the Northeast, with an average temperature of 46.0°F, 0.5°F above normal. Notably, several states had a very warm April, with record high temperatures in nine out of 12 states. The 2017 summer months were slightly cooler than average, with an average temperature of 67.3°F, 0.4°F below normal. The entire Northeast had cooler August than normal, with all 12 states experiencing temperatures ranging from 0.5°F to 1.7°F below normal. The cool summer was followed by the fifth warmest autumn on record with an average temperature of 52.4°F, 2.6°F above normal. Three of the New England states had record high average temperatures, while the others had their second highest autumn on record.
Rainfall
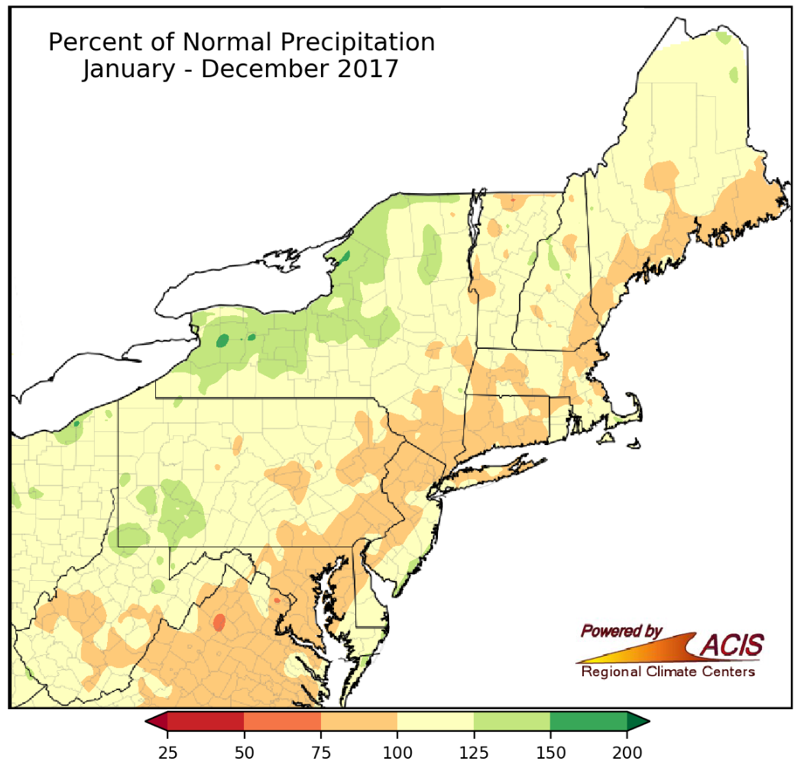
The Northeast wrapped up 2017 with an average of 46.35 inches of precipitation, 1.91 inches above the long-term average (Figure 19). Four states (Connecticut, Maryland, Massachusetts, New Jersey) were slightly drier (1.45-5.48 inches below average), while nine states had slightly wetter (0.02-3.20) than normal years. Notably, New York had one of its top ten wettest years (Figure 19).
Above-normal rainfall contributed to a cool and wet spring, and made 2017 the fifth wettest on record. Summer continued to be wet with 0.8 inches of precipitation above normal, while a dry autumn rounded out the year with below average precipitation.
Implications
Above-normal rainfall contributed to a cool and wet spring, and made 2017 the fifth wettest on record. Summer continued to be wet with 0.8 inches of precipitation above normal, while a dry autumn rounded out the year with below average precipitation.
2017 meteorological measurements in the Northeast show increased variability, following local and national assessments indicating that temperatures have increased over the past several decades. These variable temperatures potentially increase vulnerability to species adapted to cold weather dormancy.
Acknowledgements:
A special thank you to NOAA and the Northeast Regional Climate Center at Cornell University for the generous use of their regional data and their generous permission to adapt the regional climate summary.
References
- Betts, A. K. 2011. Climate Change in Vermont (unpublished report). Available online: http://www.anr.state.vt.us/anr/climatechange/Pubs/VTCCAdaptClimateChangeVTBetts.pdf
- EPA Climate Leaders Summit Report. Summit Date: Friday, November 8, 2013 Johnson & Wales University, Harborside Campus, Providence RI. Report Date: March 2014. Available online: http://www3.epa.gov/region1/climateleaderscollaboration/pdfs/ClimateLeadersSummitReport.pdf
- Grubinger, V. 2011. Climate Change and Vermont Agriculture. University of Vermont Extension. Available online: http://www.uvm.edu/vtvegandberry/factsheets/climatechange.html
- Intergovernmental Panel on Climate Change (IPCC) Climate Change 2014 Synthesis report Summary for Policymakers. IPCC, 2014: Climate Change 2014: Synthesis Report. Contribution of Working Groups I, II and III to the Fifth Assessment Report of the Intergovernmental Panel on Climate Change [Core Writing Team, R.K. Pachauri and L.A. Meyer (eds.)]. IPCC, Geneva, Switzerland, 151 pp. Available online: http://www.ipcc.ch/pdf/assessment-report/ar5/syr/AR5_SYR_FINAL_SPM.pdf
- Pucko, C. 2014. The Impacts of Multiple Anthropogenic Disturbances on the Montane Forests of the Green Mountains, Vermont, USA. University of Vermont, Department of Biology Ph.D. Thesis.
- Rustad, L. et al. 2012. Changing Climate, Changing Forests: The Impacts of Climate Change on Forests of the Northeastern United States and Eastern Canada. Gen. Tech. Rep. NRS-99. Newtown Square, PA: U.S. Department of Agriculture, Forest Service, Northern Research Station. 48 p. Available online: http://www.fs.fed.us/nrs/pubs/gtr/gtr_nrs99.pdf
Additional Resources
- Vermont State Climatologist: http://www.uvm.edu/~vtstclim/
- Northeast Regional Climate Center (NRCC): http://www.nrcc.cornell.edu/
- Northeast Regional Climate Center Data Online: http://climod2.nrcc.cornell.edu/
- NOAA Climate At A Glance: https://www.ncdc.noaa.gov/cag/time-series/
FEMC Project Database Link
- Burton Island meteorological monitoring https://www.uvm.edu/femc/data/archive/project/burton-island-meteorological-monitoring
- Colchester Reef meteorological monitoring https://www.uvm.edu/femc/data/archive/project/colchester-reef-meteorological-monitoring-38-m
- Diamond Island meteorological monitoring https://www.uvm.edu/femc/data/archive/project/diamond-island-meteorological-monitoring
- Mount Mansfield east slope mid elevation forest meteorological monitoring https://www.uvm.edu/femc/data/archive/project/mt-mansfield-east-slope-mid-elevation
- Mount Mansfield summit meteorology https://www.uvm.edu/femc/data/archive/project/mount-mansfield-summit-meteorology
- Mount Mansfield west slope mid elevation forest meteorological monitoring https://www.uvm.edu/femc/data/archive/project/mt-mansfield-west-slope-mid-elevation
- Proctor Maple Research Center meteorological monitoring https://www.uvm.edu/femc/data/archive/project/proctor-maple-research-center-meteorological-monitoring