Sentinel Streams
Biological Monitoring at Ranch Brook
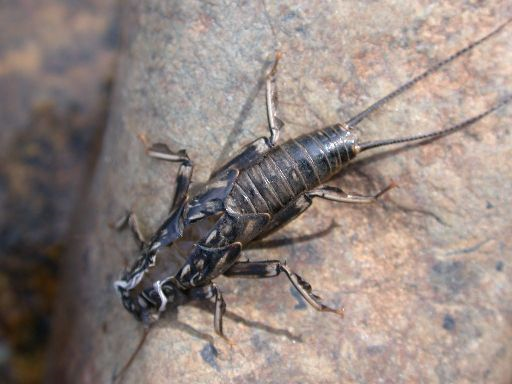
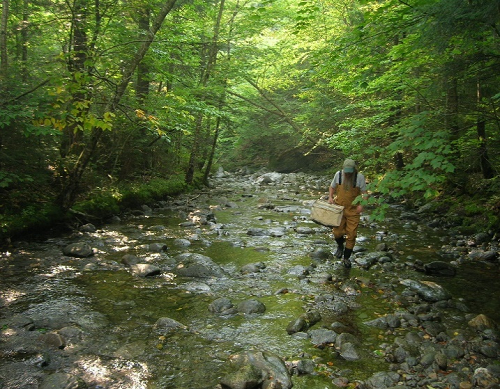
The Vermont Department of Environmental Conservation (DEC) is conducting long term monitoring of twelve "sentinel" streams in Vermont. These reference streams are widely variable in terms of size (4.6 -510 km2), elevation (33m – 585m) and geographical separation. Most are in watersheds that have significant protection against impacts from anthropogenic activity. One of the longest running sentinel monitoring stations is at Ranch Brook near Stowe, VT. With a drainage area of 10 km2 and an elevation of 378 m, it is one of the smallest and pristine sentinel streams.
By focusing on reference streams with negligible prospects for development or land use change, DEC hopes to be able to isolate long-term impacts related to climate change. All twelve streams are currently being monitored on an annual basis for water chemistry, physical habitat, water temperature, and biology (fish and macroinvertebrate communities). Several sites are also being gaged for stream discharge. Through this monitoring, we hope to be able to gain an understanding of how climate change is affecting stream habitat and water quality, and how changes in these abiotic variables may cause long-term alterations in biological communities.
The Data
Vermont DEC collects macroinvertebrate community samples during an annual index period that runs from September 1st through mid-October. Samples are collected from riffle habitats, and sorted and identified in the laboratory. DEC biologists use population data, as well as a number of community variables (called metrics) to assess stream health. These metrics cover many aspects of community structure and function, including biodiversity, tolerance to pollution and ecological feeding habits. Metric values are compared to established thresholds determined from historical statewide data. These metric outcomes are then used to determine a narrative assessment for community health, using a five-tiered scale ranging from Poor to Excellent.
Abiotic data related to stream habitat is collected in conjunction with biology, and is used to explain what factors are shaping the biological communities. These habitat variables include water chemistry (e.g. pH, alkalinity, sulfate, earth metals, turbidity, chloride, and nutrients), riparian canopy, substrate particle size, and periphyton cover. With a continuously operated USGS gage and annual monitoring by VTDEC since 2000, Ranch Brook has one of the best data sets in the state for pairing biological condition with stream hydrology. Continuous stream discharge data is available from the USGS gage, in addition to daily mean and annual peak discharge values.
2016 in Summary
Figure 26 shows 2016 results for four of the eight metrics used to assess biological condition, as well as the overall assessment rating. Average macroinvertebrate density over two sampling events at Ranch Brook during the fall index period was 948 individuals per square meter, higher than Vermont DEC's minimum biological criteria for a healthy stream. This is within the range of other similarly sized reference streams, and comparable to the mean of other randomly sampled small high gradient streams throughout the state. This also shows a continued recovery in density for Ranch Brook, which has showed a depressed density for several years following flood flows in 2010 and 2011. Total taxa richness (41) was very high in 2016 compared to DEC's minimum criteria (27), and similar to reference and statewide averages. This pattern was also seen in the richness of pollution sensitive "EPT" (Ephemeroptera, Plecoptera, and Trichoptera) taxa.
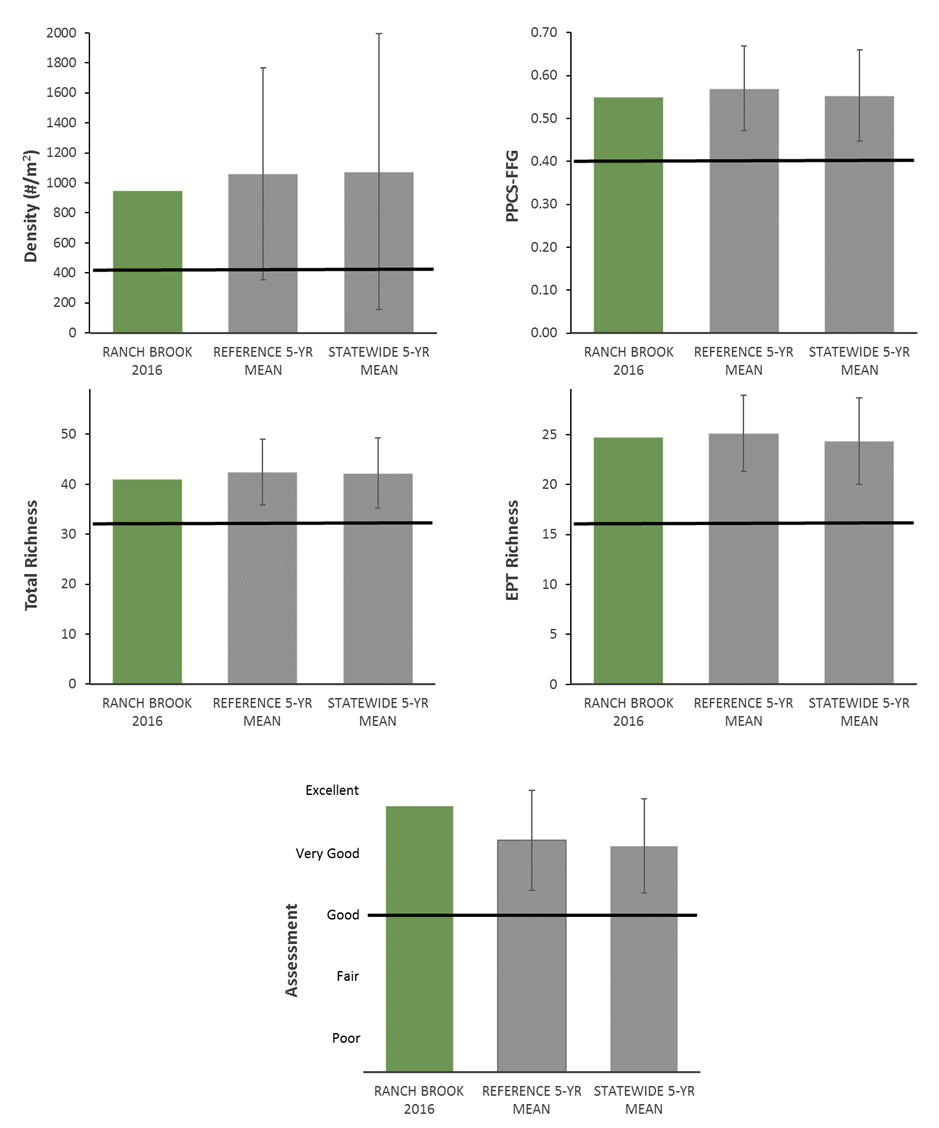
A "functional feeding group" refers to one of several types of ecological feeding types to which a stream macroinvertebrate species has evolved; including predation, filtering suspended organic matter from the water, scraping algae from rock surfaces, and shredding fallen leaves and other detritus. Small-forested streams like Ranch Brook typically have low algae growth and grazing, but high quantities of leaf detritus, and populations found at the site should reflect this. The PPCS-FFG score is based on a model that compares the distribution of functional feeding groups at a given site to what we would expect to find at a hypothetical site untouched by human activity. A relatively high score (0.55) at Ranch Brook indicates similarity to a typical reference stream, and is well above DEC's minimum threshold of 0.40.
High values for these four metrics, as well as the other metrics evaluated by DEC, caused Ranch Brook to get a ratings of "Very Good/Excellent" and "Excellent" for the two sampling events in 2016, at and near the highest possible scores. A score of Good (indicating a moderate change from the reference condition) is used as the benchmark for minimum acceptable biological health. In addition to acknowledging the high ecological condition of Ranch Brook, it should also be noted that other reference sites and randomly chosen streams throughout Vermont also score very highly. This is a good sign for the overall quality of headwater streams in Vermont.
Long Term Trends
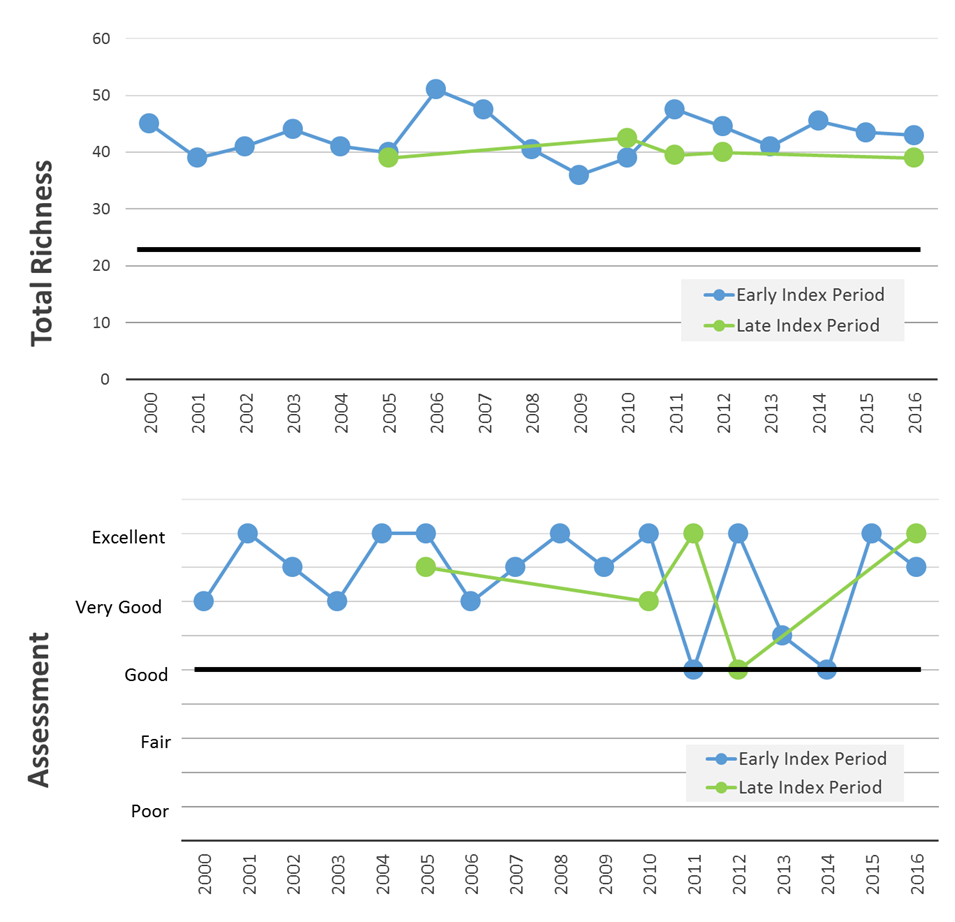
Macroinvertebrate richness has remained very stable over time (Figure 27). Ranch Brook is the only stream that DEC has frequently sampled twice during our index period; both in late summer/early autumn (before September 15th) and again in mid/late October. This consistency in richness holds regardless of what time the sample was collected.
In a previous annual report, we showed that density has been quite variable over time, and has an inverse relationship with peak discharge. The four highest annual peak discharges since 2000 have occurred over the previous five years, and decreased densities have corresponded with lower than normal assessment ratings. It appears that biological condition may have finally rebounded fully after two relatively low flow years in 2015 and 2016.
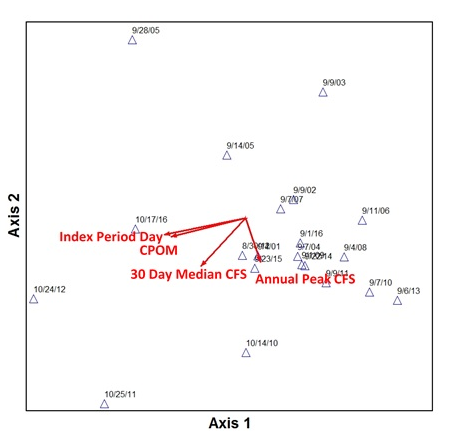
Metrics aggregate community data and most tend to show little variability over time at reference sites like Ranch Brook. To get an understanding of how populations within the community change, it is necessary to analyze the raw data. Figure 28 shows a multivariate ordination plot using densities of individual taxon populations in each sample. The distance between samples shows the degree of basic community similarity (i.e. samples close together have similar populations of taxa). Axes represent inter-correlated combinations of 20 environmental variables, with red vectors showing which abiotic factors have the strongest relationship with these axes. These vectors "point" toward the community samples which are mostly strongly influenced by those habitat variables.
Of all the environmental variables analyzed, the strongest factors shaping stream communities in Ranch Brook were found to be the number of days into the biomonitoring index period the sample was collected, and the quantity of coarse particulate organic matter (CPOM) present. CPOM quantity is highly indicative of the amount of fallen leaves dropped in the stream, which tends to increase dramatically by late autumn. Most samples taken in late October with high CPOM fall in the lower left side of the plot. Annual peak discharge and median discharge in the previous 30 days were also very important in influencing communities. Community samples shaped by high flows generally fall in the lower right portion of the plot.
Implications
Even though overall biological condition at Ranch Brook is consistently high over time, environmental and habitat factors are influencing what taxon populations are present in any given year. It makes sense that flow would be an important factor in shaping communities. In this type of reference stream, other variables related to water chemistry and substrate particle distribution may not be expected to change significantly over short time periods. Flow and temperature may respond more dramatically to climate change, though DEC has only been measuring temperature at Ranch Brook for the last 12 months.
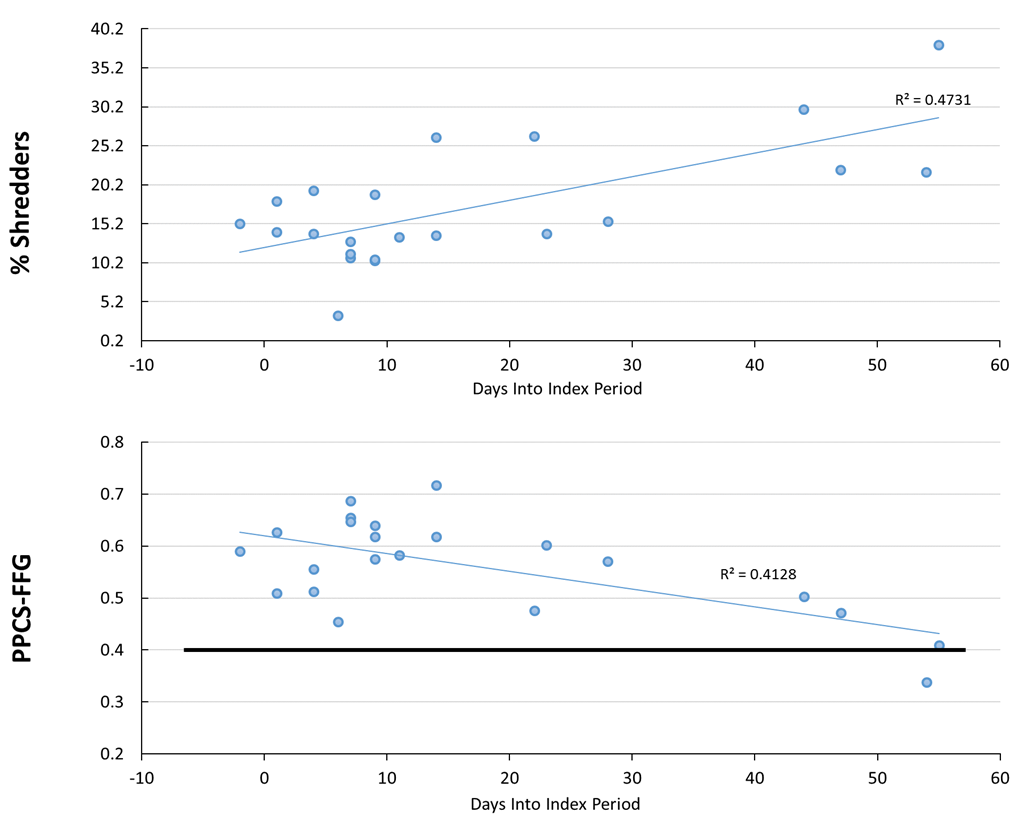
It is an important finding that the timing of sampling is a major factor in the presence and abundance of taxa in these communities, though perhaps not surprising. The mid to late October samples were all likely collected after leaf fall. As autumn progresses, the resource base for macroinvertebrates shifts more heavily to a community based on breaking down leaf detritus (Figure 29). This kind of seasonal community shift could confound our ability to fully understand how taxon populations are changing over longer periods because of climate change. These results suggest that it is important to consistently collect biological samples at sentinel sites at roughly the same time every year. Collecting biological samples at sentinel sites at both the beginning and end of DEC's fall index period might provide even more valuable data on how macroinvertebrate populations are affected by climate change variations in flow and temperature.
It appears that biological condition may have finally rebounded fully after relatively low flow years in 2015 and 2016.
Additional Resources
- VT DEC Biomonitoring and Aquatic Studies http://www.watershedmanagement.vt.gov/bass/htm/bs_biomon.htm
FEMC Project Database Link
- Sentinel Stream Monitoring: https://www.uvm.edu/femc/data/archive/project/sentinel-stream-monitoring