Forest Health
Long-Term Canopy Condition and Regeneration
Long-term trends in tree health provide information on the condition and vigor of Vermont's forests. Assessing tree crown condition and regeneration help us monitor the status of our forest, as well as detect change. Trees with healthier, denser foliage can sequester more carbon, add more wood annually, and better resist pests and pathogen outbreaks. Measuring regeneration gives us a sense of what our forest may look like in the future. While in any one year, crown health metrics may vary due to weather events and/or insect or disease outbreaks, the long-term species trends give us context for the annual observations. As our climate continues to change, monitoring forest health trends will be critical.
The Data
In 1990, a national Forest Health Monitoring (FHM) program was established to measure forest health and detect emerging problems. Following this protocol, the Forest Ecosystem Monitoring Cooperative (formerly the Vermont Monitoring Cooperative) established 48 FHM plots in Vermont between 1991 and 2016. In addition to the original 19 plots measured from 1991-2014, 22 plots were added in 2015, and 7 more in 2016.
The 48 Vermont FHM plots contain 1,983 mature trees from 31 species, spanning 8 forest types and 8 biophysical regions. Annually, crews assess tree species, canopy condition, seedling abundance, sapling survivorship, invasive species, and damage agents. Crown health assessments include early symptoms of tree stress, such as changes in foliage transparency, crown dieback, and live crown ratio. Elevated crown transparency can suggest either short or long-term decline, while crown dieback is a metric for more serious decline symptoms. Live crown ratio measures the percentage of the tree height with live foliage.
Regeneration counts provide an estimate of the relative success of germination and initial survivorship across species from year to year. Saplings (1 to <5 inches in diameter) have been measured on the 19 original FEMC plots between 1997 and 2007, and then again starting in 2014. From 2008 to 2013, the plots were measured on a 3-year rotation. Seedlings (<1 inch and greater than 12 inches for hardwoods or 6 inches for softwoods) have been measured periodically during that time as well. In beginning in 2014, all seedlings of any height have been tallied yearly. Regeneration serves as a proxy for the future composition of the forest canopy. In total, the information obtained from this plot network provides a robust estimate of the current condition of Vermont's forests, providing early indications of potential problems that may affect forests across Vermont and beyond.
2016 in Summary
Crown Health:In 2016, for all selected key hardwood species, mean dieback was elevated compared to the long-term mean (Table 1). A few species showed no significant change in crown dieback, including white pine, balsam fir, and red spruce, however, mean was slightly elevated for these species too. White ash, in particular, showed increased dieback in 2016 (16.9%), compared to the long-term average (8.3%), as did red oak (13% and 4.6% respectively). Overall dieback across all species was 12.2%, compared to 9.4% in 2015, which represents an increase compared to the long-term average of 7.8%. Several weather-related stress factors in 2015 may have contributed to crown health in 2016. Late spring frost injury, drought, and localized wind storms were observed across Vermont in 2015. While any one year can have events that stress trees (e.g., drought, insects, disease), long-term trends of increased dieback can be cause for concern.
Foliage transparency showed little change in 2016 (Table 1). At 20.7%, transparency was lower in 2016 than in 2015 (21.4%), and very similar to the long-term average (20.0%). The only species to exhibit an increase in transparency was paper birch. Changes in paper birch are consistent with reports of declines across the region, and may also be indicative of our maturing forests, of which paper birch is a minor component.
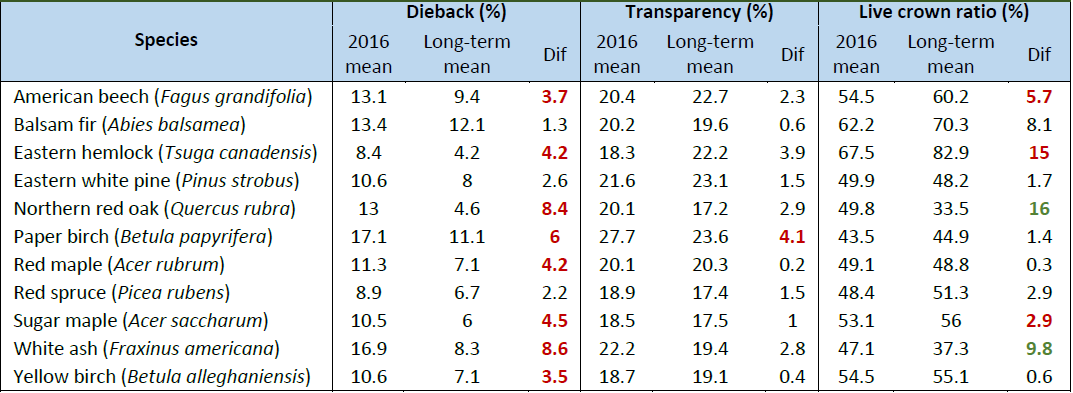
Live crown ratio of red oak and white ash increased in 2016 indicating expansion of branches with foliage, suggesting possible tree recovery. However, other species (American beech, eastern hemlock, and sugar maple) showed a decrease in live crown ratio. The average value in 2016 across all species was 52.7%, which is slightly lower than the 2015 value of 52.9% and the long term average of 54.3%. Rapid reduction of live crown ratio may be related to storm breakage or extensive top dieback.
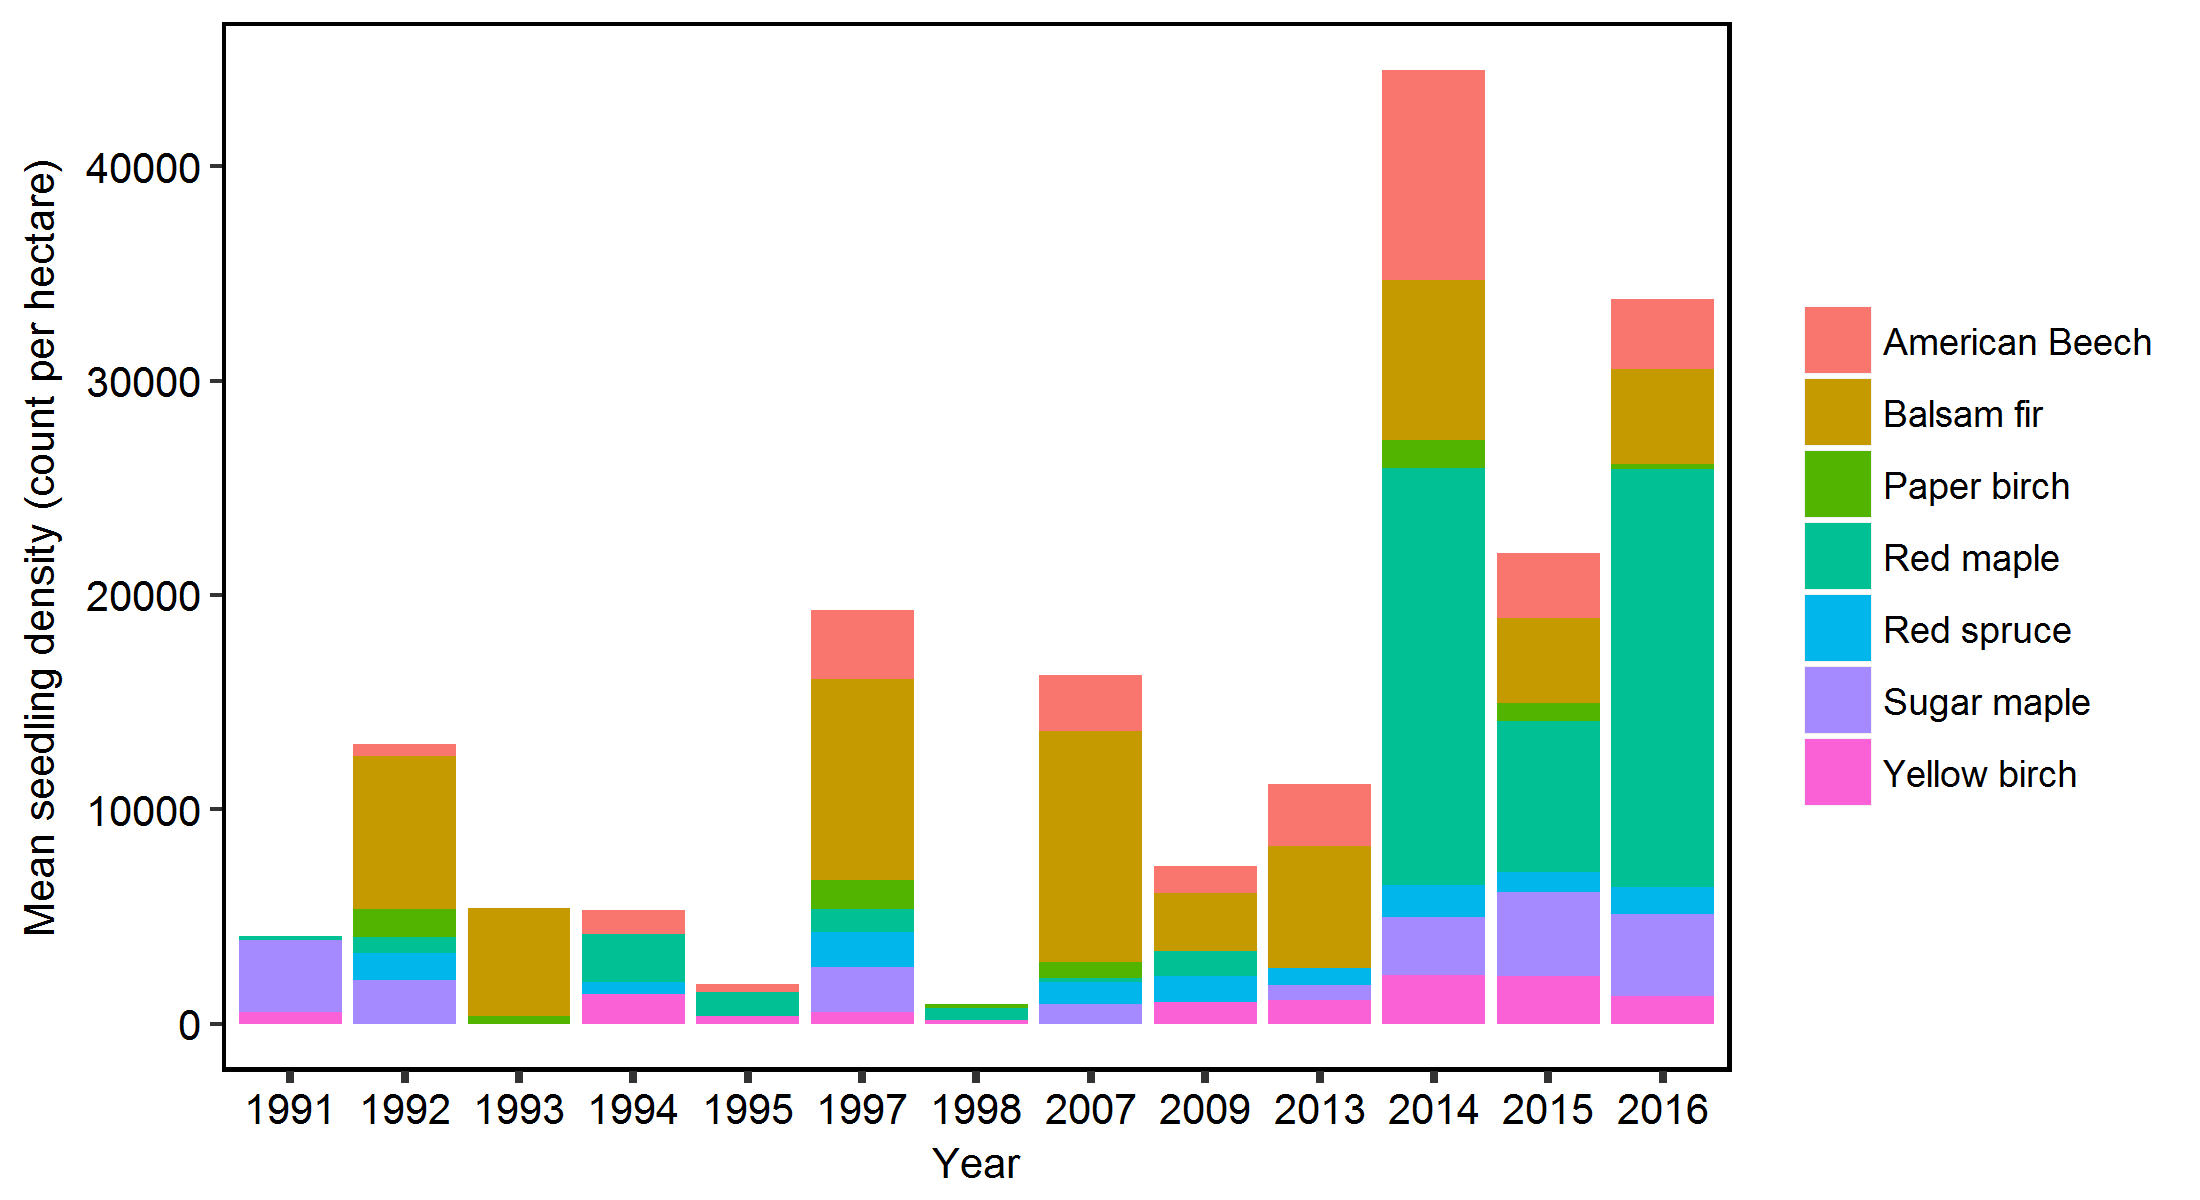
Regeneration:Regeneration counts increased in 2016 relative to 2015 (Figure 1). reflecting fluctuations in heavier and lighter seed years. Since 2014, there has been a high density of red maple seedlings in the FHM plots, with a mean density of 19,516 seedlings per hectare (ha). Sugar maple also produced good seedling densities, at 3,858 seedlings/ha. Compared to the previous two years, yellow birch regeneration was slightly depressed and very few seedlings of paper birch were detected. American beech seedlings still constitute a considerable component of the understory, a result of beech bark disease, which often prompts mature beech to produce copious root sprouts. These sprouts can outcompete other seedlings (as they are attached to the 'mother' tree) and can lead to dense beech understories.
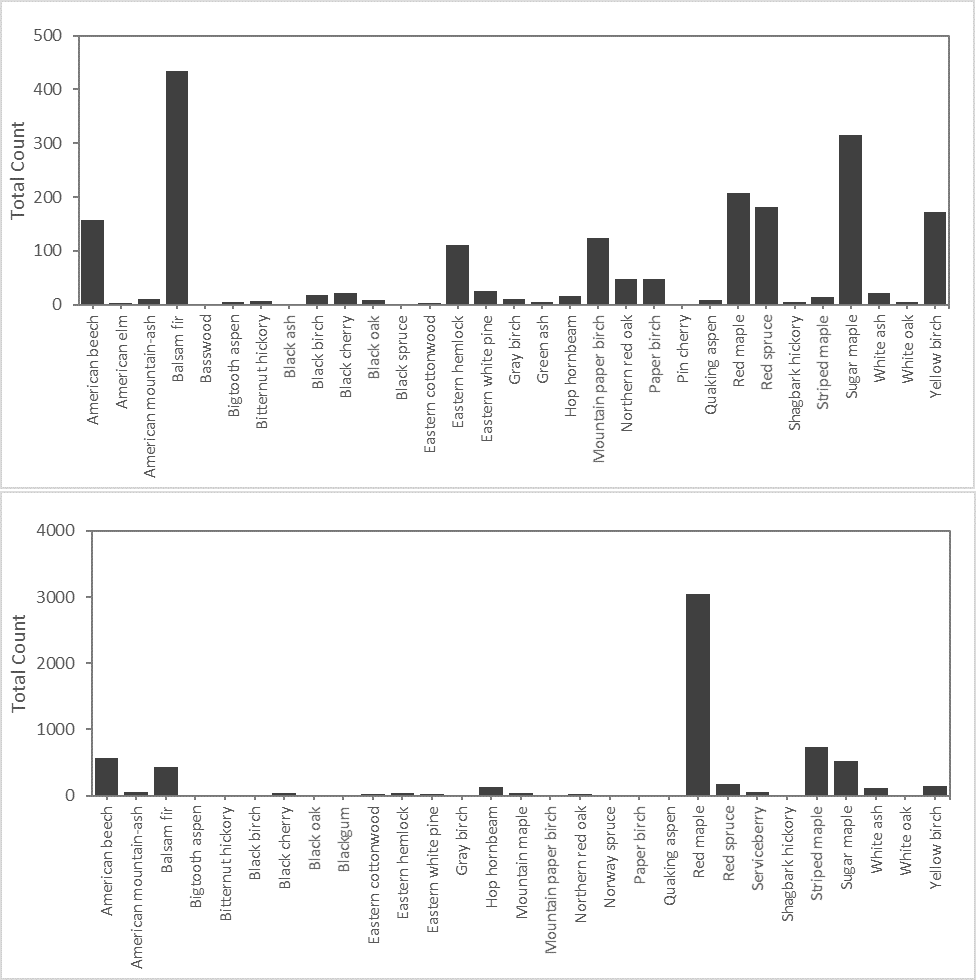
For dominant and codominant trees measured in 2016, balsam fir dominated the plots (435 trees), followed by sugar maple (315) and red maple (208) (Figure 2). However, despite the large number of mature trees, balsam fir did not have the highest number of seedlings (2,143 seedlings counted) (Figure 2). By far, red maple had the most seedlings in 2016 (5,387). American beech had the third highest number of seedlings (1,942). There were many more species detected as seedlings (although this does include some woody species that remain shrubs or small trees) compared to mature trees. In 2016 there were some surprising species detected in the plots, including black gum.
Long Term Trends
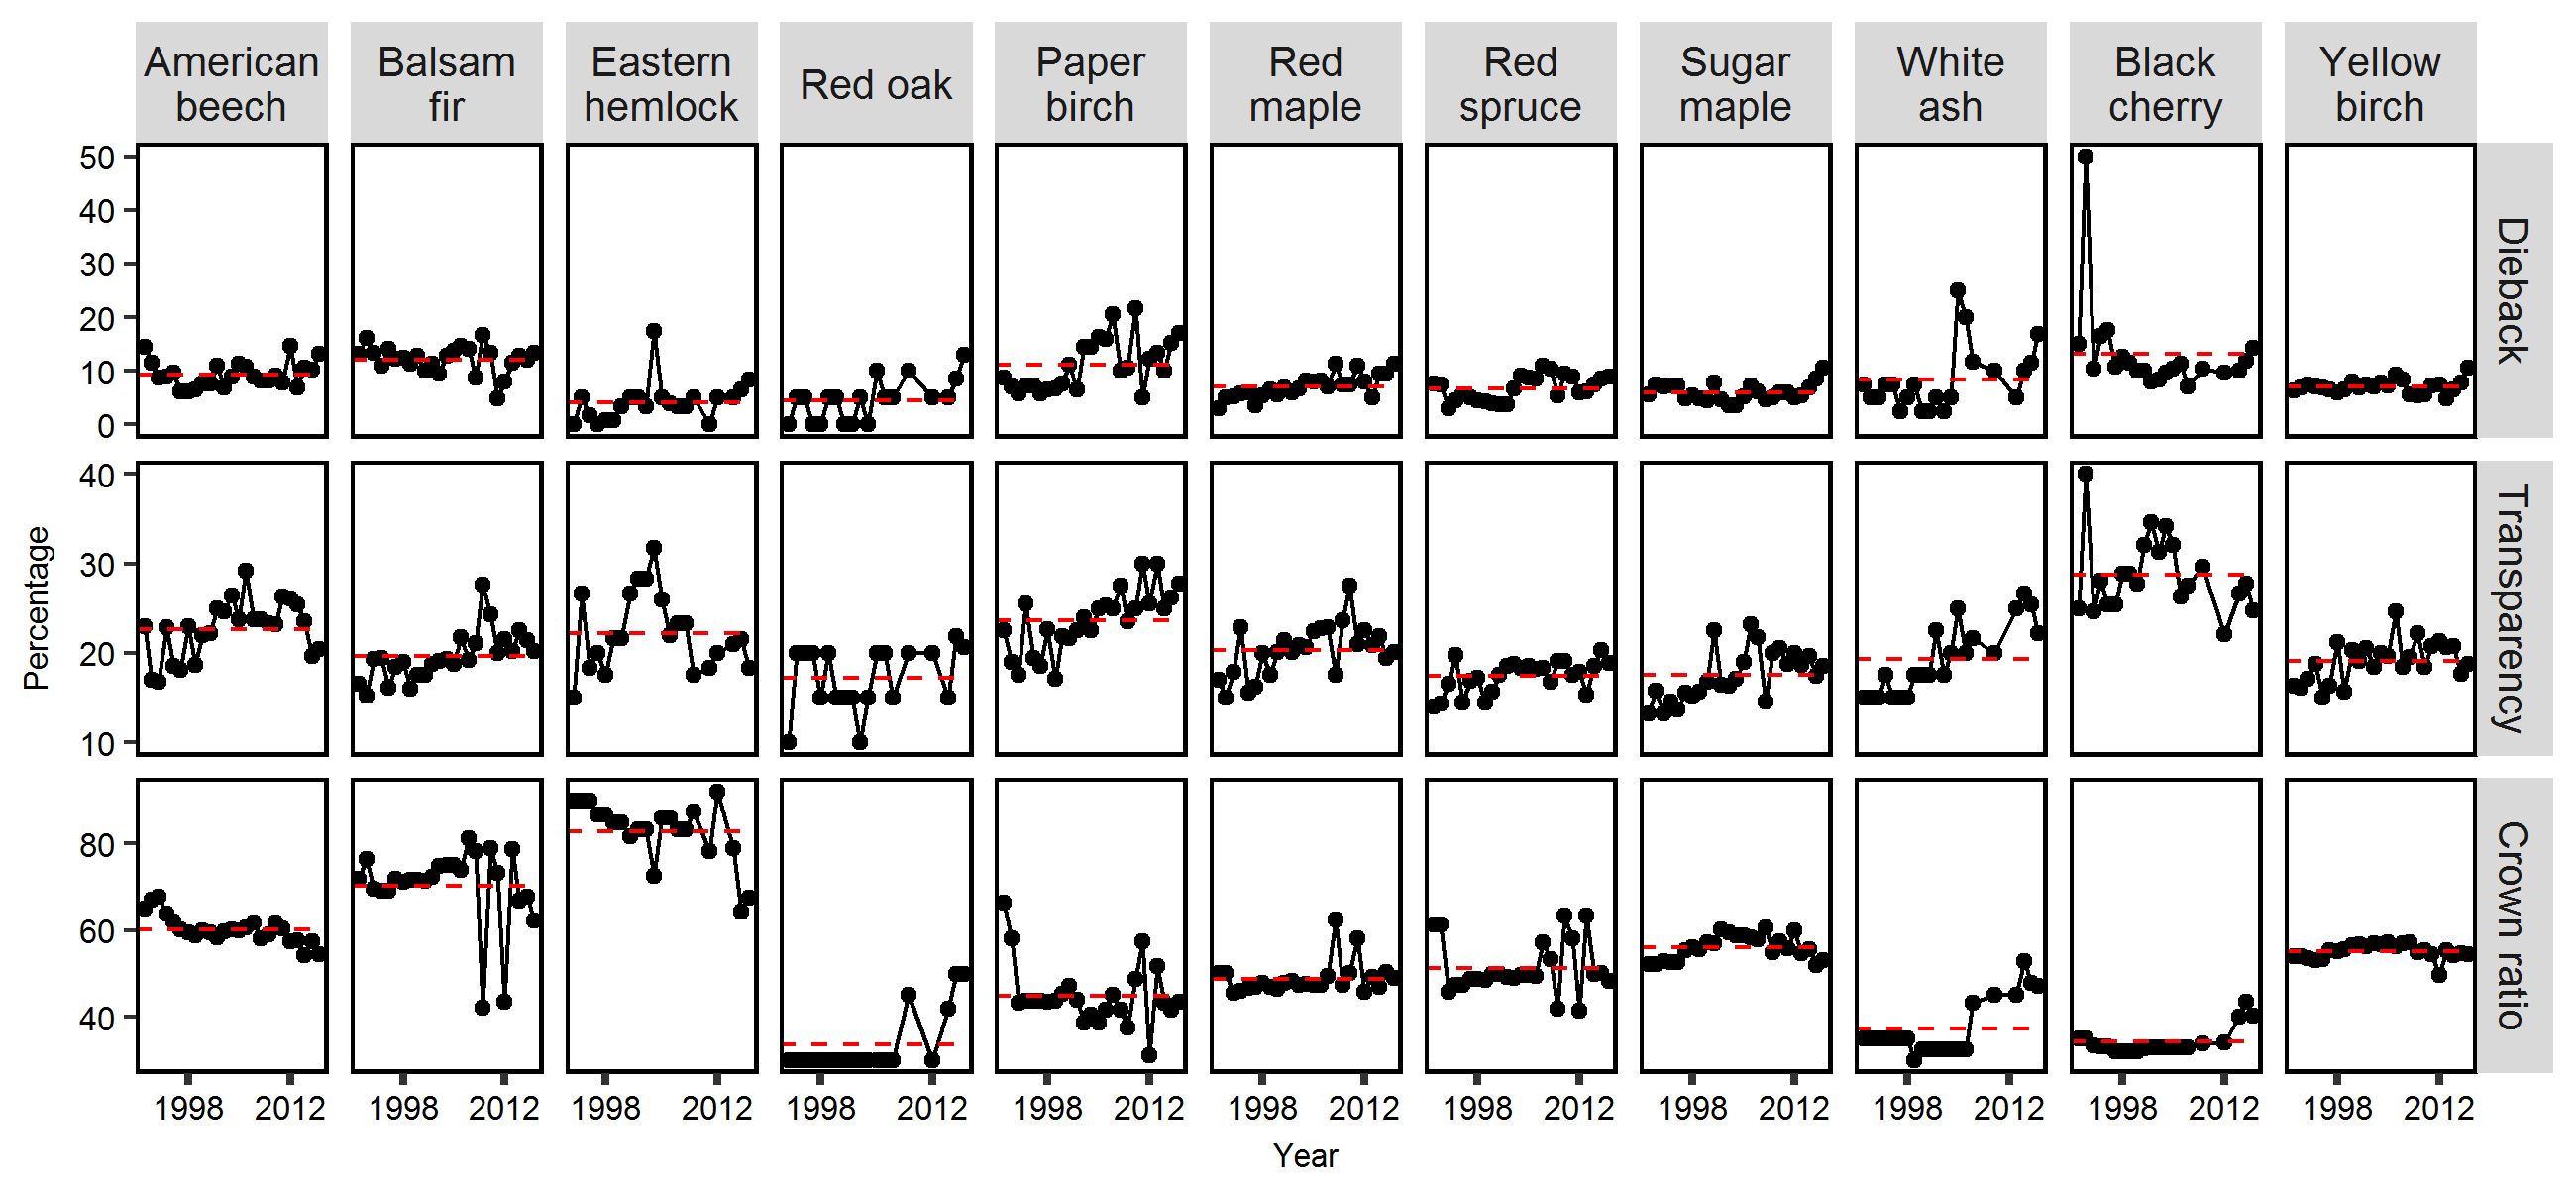
An examination of the full temporal dataset allows us to look past the year-to-year variability to consider species-specific trends and identify more chronic stress conditions. It is evident that there is high annual variability in all three crown health metrics, and particularly for certain tree species. Mean crown dieback has remained consistent for most species over the measurement period (Figure 3). The exceptions are paper birch and white ash, which have both experienced increased dieback over recent years. Mean crown transparency values have steadily increased for many of the species examined, with white ash and paper birch showing the most dramatic increase. Steady increases in crown dieback are worrying; this could indicate broad spatial trends in elevated tree stress and decline. However, live crown ratio, which is the amount of foliage relative to total height, has remained steady or in some cases increased for some species (Figure 3). A few exceptions are beech, hemlock and sugar maple, which may be the result of increased dieback or the impact of storms. The FEMC will continue to monitor these species to understand how changing environmental conditions are altering forest health or competitive relationship.
In 2016, overall seedling density was similar to previous years on 19 plots with long-term records (Figure 2). It is important to note that a protocol change, implemented in 2014, expanded the definition of seedlings to capture current germinants. Prior to 2014, seedlings were only counted when they exceeded a certain height (6" for conifers, 12" for hardwoods, as per FIA protocol), and from 2014 on, all seedlings with true leaves and smaller than 1" diameter were counted. Thus, one explanation for the increase in 2014 overall seedling density may stem from the inclusion of seedlings that were previously ignored in counts. Yet, this does not explain the significant drop in seedling density from 2014 to 2015. While different species cycle through different low and high mast years, the decrease is consistent across species. It is possible that the unusually dry spring, an official drought statewide and a moderate drought in southern Vermont in May, affected overall germination success and survivorship across species. In 2016, however, we saw an uptick from 2015, indicating that conditions were favorable for regeneration.
Seedling density across the 19 monitoring plots showed that red maple dominated the plots (Figure 1, Figure 2). Across all 41 plots, dominant species were balsam fir and red maple. While these patterns vary dramatically across plots due to the broad geographic and elevational range of plots spanning many forest types, the lack of regeneration of low to mid-elevation shade tolerant species such as sugar maple and eastern hemlock is concerning. Considering that the species composition of mature trees across the FEMC long-term monitoring plots (Figure 2) is dominated by balsam fir at upper elevations and northern hardwoods (sugar maple, American beech, and yellow birch) at mid-lower elevations, this data suggests that red maple regeneration is disproportionately high while sugar maple regeneration is disproportionately low. Given the regional economic and ecological importance of sugar maple, and apparent dominance of red maple regeneration in northern hardwood stands, further monitoring is warranted to understand the trends and patterns of sugar maple regeneration.
Regional Context & Implications
Long-term forest health monitoring has allowed us to detect subtle but steady changes in the condition of our forests. Long-term trends indicate that some species continue to fare better than others (e.g. increased dominance of American beech and red maple over sugar maple and birch species). Examination of metrics for other species indicates long-term trends that warrant ongoing monitoring of declining condition, particularly for paper birch and white ash. Regeneration data continues to indicate that the species currently dominating seedling classes may signal a shift in the composition of future forests in Vermont.
Forested ecosystems provide immeasurable benefits to society; from their aesthetic beauty and recreational opportunities, to biomass energy and carbon sequestration. While the composition of forests may change over time, ongoing work to monitor tree health and regeneration will inform forest management decisions to maximize forest resiliency, productivity, and health of Vermont's forests.
Long-term data suggest that certain species are showing greater dominance than should be expected, while others show continued declines. Tree crown health remained stable for some species, but white ash and paper birch continue to show signs of decline.
Acknowledgements: Special thanks to Sandy Wilmot and Josh Halman from the Vermont Forest Parks and Recreation Department for reviewing and editing the Forest Health Section of the 2016 FEMC Long-Term Monitoring Update.
Additional Resources
- VT Forests, Parks and Recreation Vermont Forest Health Highlights 2016. Online at https://fhm.fs.fed.us/fhh/fhh_16/VT_FHH_2016.pdf
- VT Forest Insects and Disease Conditions 2016. Online at http://fpr.vermont.gov/sites/fpr/files/Forest_and_Forestry/Forest_Health/Library/2016%20Forest%20Insect%20%26%20Disease%20Conditions%20in%20Vermont.pdf
FEMC Project Database Link
- Forest health monitoring: https://www.uvm.edu/femc/CI4/data/archive/project/forest-health-monitoring