Watershed Hydrology
The Mt. Mansfield Paired Watersheds Study
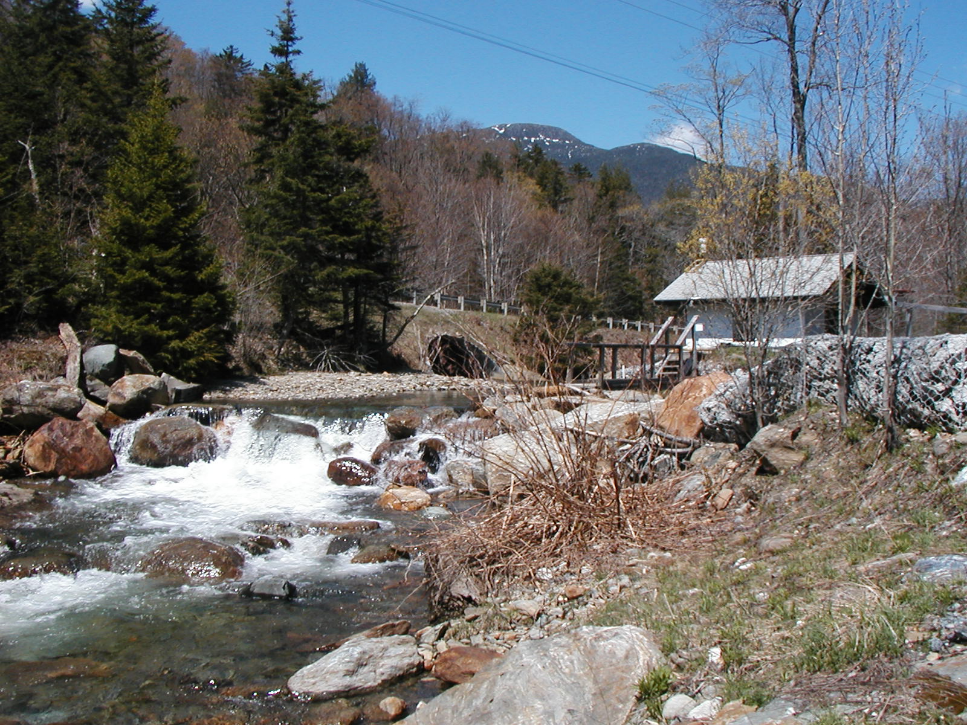
Since September 2000, the U.S. Geological Survey has been continuously operating stream gages at Ranch Brook and West Branch near Stowe, Vermont (Wemple et al., 2007). The gaging was designed as a paired watershed study, with Ranch Brook (9.6 km2) as the forested control watershed, and West Branch (11.7 km2) as the developed watershed. The West Branch watershed contains nearly the entire extent of the four-season Stowe Mountain Resort. In the classic paired watershed approach, monitoring would be conducted prior to any development, but the resort was established long before the study began.
However, the resort underwent a significant expansion during the course of the study, so the study design is appropriate to assess the effect of the expansion. This report on the Mt. Mansfield gaging is for Water Year (WY) 2015 (October 2014 through September 2015). The report interprets the WY15 streamflows in the context of the full 15-year record. Historic and near real-time flow data are available on the USGS website (addresses given at end of this report).
In WY2015, the gages were jointly funded through a cooperative agreement between the USGS and Vermont Monitoring Cooperative. The gages provide valuable information on mountain hydrology in Vermont, and how mountain landscapes respond to development and extreme events. To our knowledge these are still the only gaged watersheds at a ski resort. The gages have supported projects on snow hydrology and water quality by University of Vermont, Sterling College, Vermont ANR, and others. In particular, Beverley Wemple and students at University of Vermont have used the gages as a base for student projects and hands-on learning, and to attract additional funding for value-added research.
The Data
Supported as a collaboration between the VMC and the US Geological Survey, stream gages on Ranch Brook and West Branch provide continuous monitoring of stream water heights (stage), which are related to discharge (flow) by an empirical rating based on frequent discharge measurements. This information informs the monitoring of long-term hydrology patterns and water quality trends including: baseline conditions, trends in stream acid/base status, cations (Ca, K, Mg, Na, Si), anions (Cl, NO3, SO4) suspended sediment output, snowpack and snowmelt and extreme climate events. These gaging stations provide a watershed framework for other VMC efforts including nutrient cycling, forest health assessments, forest fragmentation and biological monitoring.
Discharge vs. runoff
Streamflow, or discharge, is commonly reported as a volume per unit time – in the U.S., typically as cubic feet per second, or cfs (Figure 1). Throughout this report we typically refer to runoff rather than flow. Runoff is discharge divided by watershed area, and allows for direct comparison of flow in basins of different size. For example, if one basin is double the size of another and has double the flow, runoff would be the same. The dimensions of runoff are depth per unit time, i.e. the same as precipitation, thus runoff can be directly compared to precipitation. For example, if a watershed receives 1500 mm/yr of precipitation and has 1000 mm/yr of runoff, that means 500 mm/yr was lost to evapotranspiration plus or minus a change in the amount of water stored in the watershed, e.g. in soils.
2015 in Summary
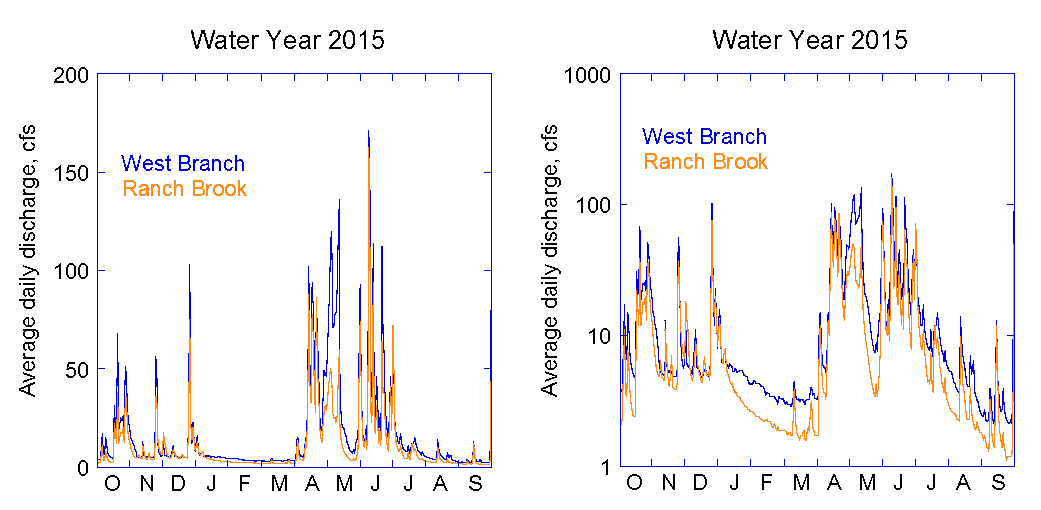
Relative to the 15-year record, WY2015 had below average runoff for the second consecutive year. WY15 was notable for a fairly dry fall, and after large late December peak, a lack of mid-winter thaw events (Figure 28). Snowmelt was about average, and after a very wet June, the summer was fairly dry. Overall, runoff was less than the long-term average (Figure 29).
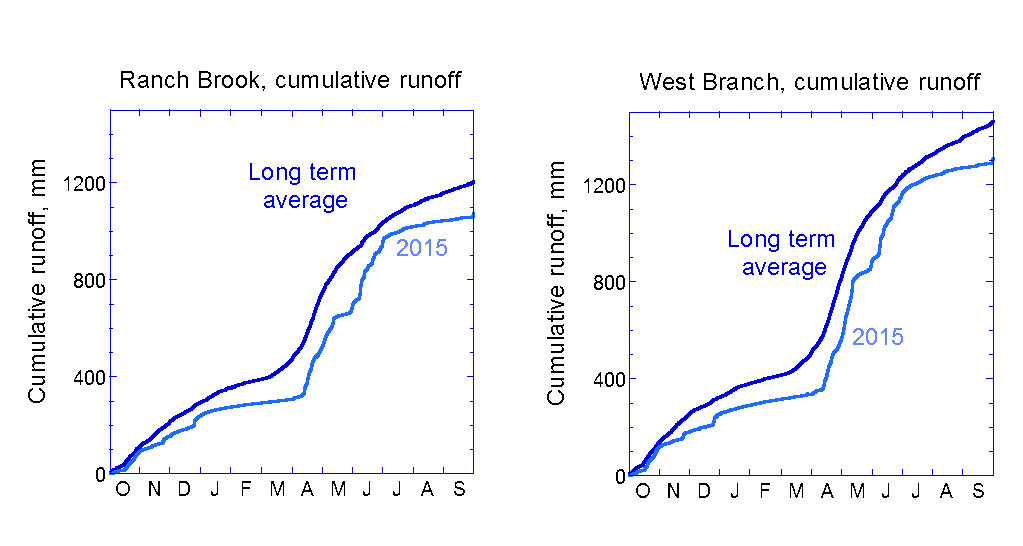
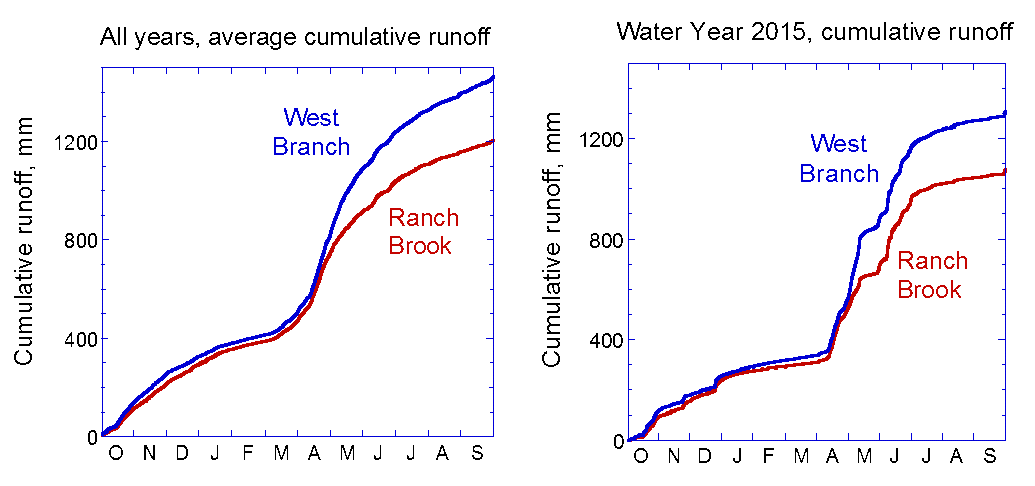
As in Water Year 2014, the cumulative runoff in Water Year 2015 ran below average for the entire year (Figure 29). The deficit began when fall rains were below average, and increased through the winter due to a lack of thaws. An unusually cold winter led to a later than average start to snowmelt (note the abrupt increase in cumulative flow at both sites in April). A very wet June brought both sites close to average cumulative runoff, but a dry summer restored much of the deficit. The relative runoff patterns at the two sites in Water Year 2015 were similar to the long-term patterns (Figure 30), with both streams generating similar runoff until part way into the spring snowmelt, when West Branch consistently generated greater runoff. Part of the greater snowmelt runoff was from melting of machine-made snow. (Water for snowmaking is withdrawn from West Branch upstream of the gage, so it is not double-counted). Runoff at West Branch continued to exceed that at Ranch Brook through the summer due to higher sustained base flow.
Long Term Trends
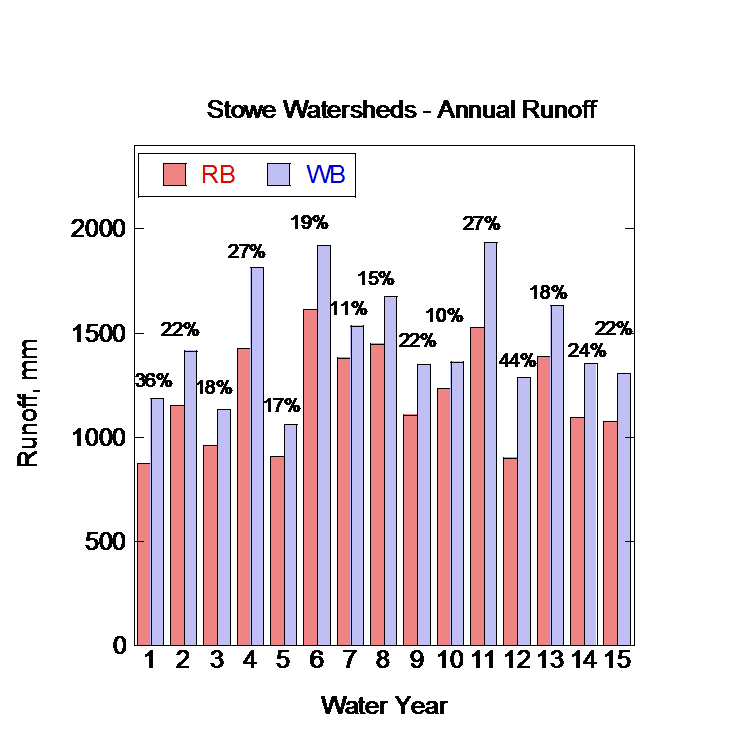
As noted in previous reports, West Branch has consistently yielded higher runoff (flow normalized to watershed area) than Ranch Brook (Wemple et al., 2007) (Figure 30 and Figure 31). Over the long-term, the average difference has been 21% greater runoff at West Branch. The Water Year 2015 differential was near average at 22% (Figure 31). We have repeatedly noted that greater runoff at West Branch is what we would expect from the creation of open land and development, but that the high magnitude of the differential suggests that some part of the difference may be natural. In last year’s report we noted the extreme heterogeneity of large summer storms; these may preferentially impact West Branch. We are currently investigating the role of local meteorology on the flow regimes.
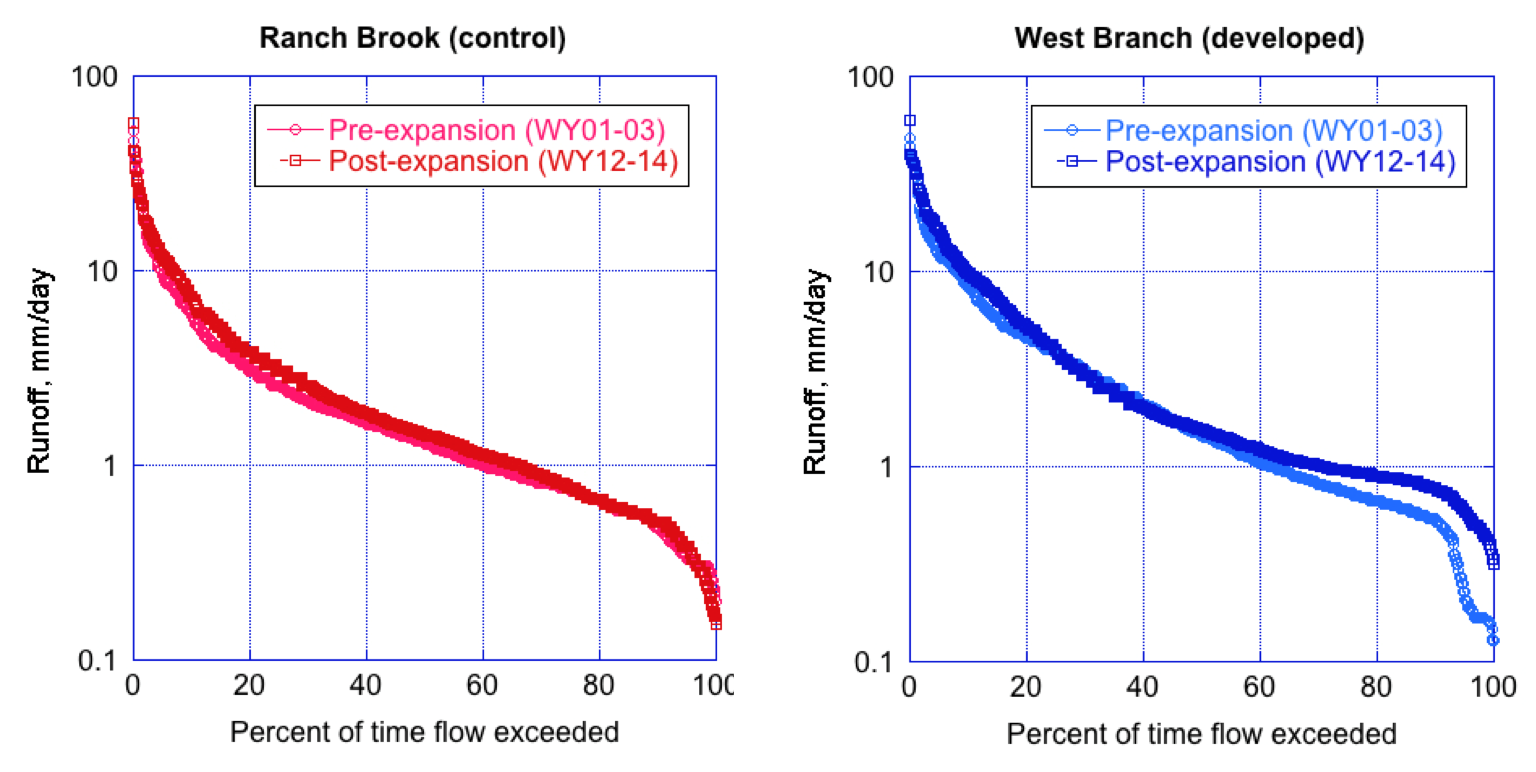
In a first step to assess the hydrologic impact of the resort expansion, we constructed flow duration curves for two three-year periods of approximately equal precipitation, from before and after the construction period (Figure 31). Preliminary analysis suggests that the resort build-out had no clear impact on the hydrology, except for the low-flow regime. Construction of a new snowmaking pond with greater storage has lessened the need to draw water directly from the stream at low flows, thus enabling a higher sustained baseflow in late fall and winter.
Implications
Mountain ecosystems worldwide are increasingly stressed by development of year-round recreational venues, tourism and other development such as communication towers and wind farms. Climate change disproportionally affects these ecosystems with warming temperatures and fewer more intense precipitation events which are increasingly in the form of rain rather than snow. Plants and animals adapted to live at high altitudes suffer. Ski areas with no snowmaking capacity are almost unheard of and certainly not viable and all areas are moving toward becoming year-round operations that rely on golf courses, waterparks, mountain bike trails and other recreational activities that don’t require snow. As these build-outs progress there are more impervious surfaces – parking lots, condominiums, and tennis courts which will alter the patterns, volume, velocity and chemical make-up of runoff.
Climate models predict more extreme precipitation events (already evident) that can potentially flood mountain streams leading to erosion, loss of stream bank cover and scouring of stream bottoms causing major disruptions to fish and macroinvertebrate habitat, increased sedimentation and water temperature (if cover is lost) and changes in essential stream nutrient and oxygen concentrations. Conversely, extended periods of low flows (droughty conditions), whether naturally-occurring or human induced (e.g. water for hotels and residences and snow making) can also adversely affect both aquatic and riparian animal and plant communities.
This study provides valuable information quantifying differences in overall streamflow volumes, peak flows, minimum flows, and timing and duration of each in both an undeveloped and a developed watershed at high elevation. This project has, and will continue, to produce real-world data needed by State regulatory agencies to make data-driven, environmentally sound decisions about development at Vermont’s high elevation sites. Without proper regulatory oversight, safeguards and controls, alterations in streamflow (quantity, velocities, timing, and water quality) can potentially have devastating impacts on aquatic and riparian communities down-stream of highly developed sites.
Vermont’s high elevation areas have the potential to be heavily impacted as the result of increased annual use and changing climatic conditions.
References
- Wemple, B., J. Shanley, J. Denner, D. Ross and K. Mills. 2007. Hydrology and water quality in two mountain basins of the northeastern US: assessing baseline conditions and effects of ski area development. Hydrological Processes 21(12): 1639-1650.
VMC Project Database Link
- Paired Watershed Study on the East Slope of Mount Mansfield: https://www.uvm.edu/femc/project/paired-watershed-study-east-slope-mount
- West Branch data are accessible at: http://waterdata.usgs.gov/vt/nwis/uv?site_no=04288225.
- Ranch Brook data are accessible at: http://waterdata.usgs.gov/vt/nwis/uv?site_no=04288230.