Forest Health
Long-Term Canopy Condition and Regeneration
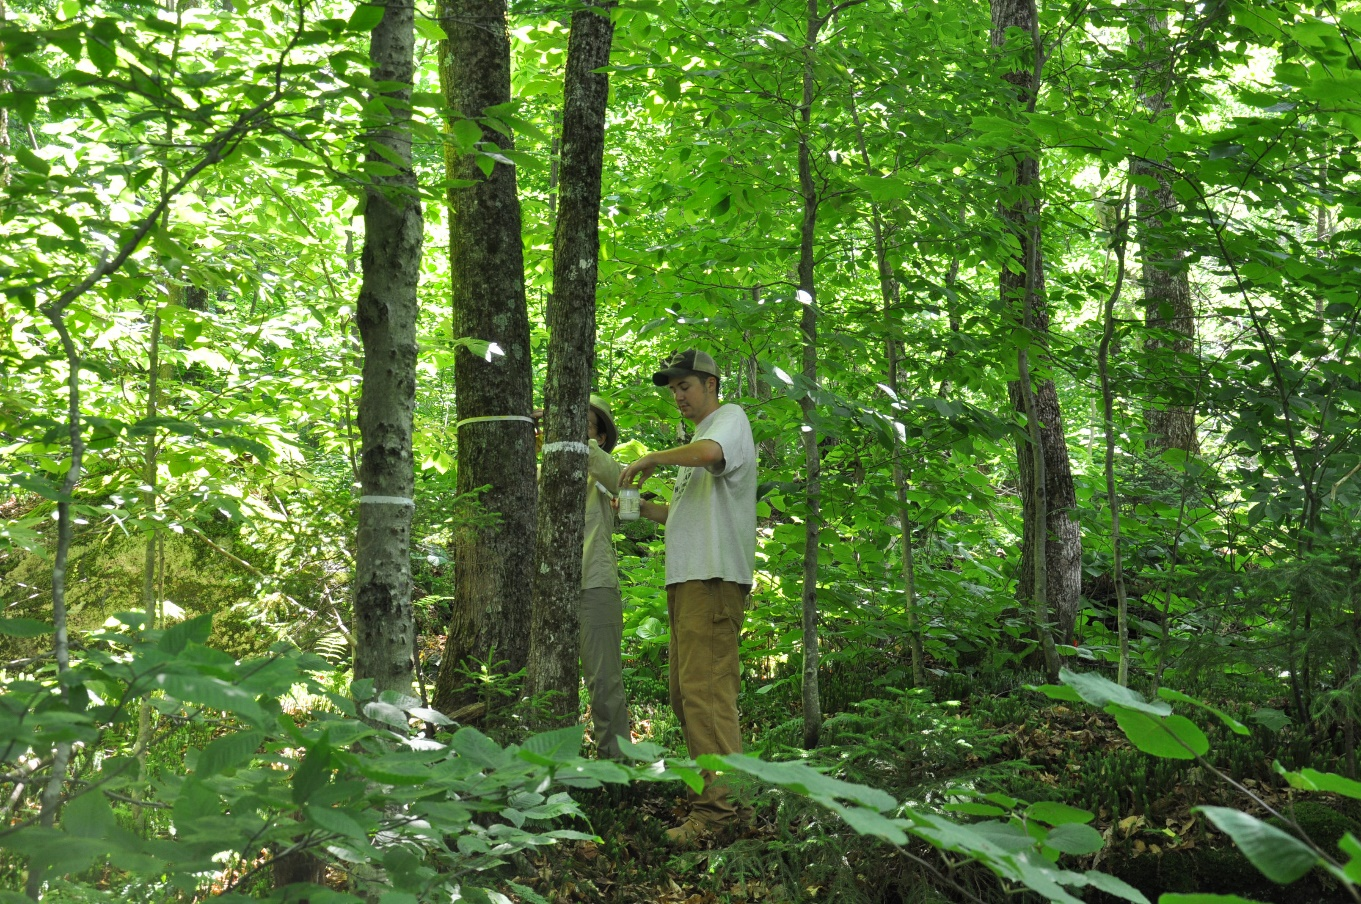
Forest monitoring plots, such as those measured across the VMC long-term forest health monitoring network, provide long-term data on forest health trends and responses to disturbance. Measurements include detailed assessments of decline symptoms, which provide information on subtle changes in forest condition that may not be apparent from broader surveys such as aerial detection surveys. Regeneration assessments provide a glimpse of the potential future composition of the region’s forests. This type of long-term, field-based monitoring is essential to understanding the current condition of the forest resource, potential drivers of forest decline, and how to sustainably manage the region’s forests.
The Data
In 1990, a systematic forest health detection program started in New England and grew to become the national Forest Health Monitoring program, aimed at detecting emerging, regionally-significant forest health problems. In 1991, the VMC started establishing a set of 19 long-term forest health monitoring plots, adopting key ecosystem measurement methods from the national FHM program. These include a full inventory of tree species, canopy characteristics, stress symptoms, damage agents, and regeneration success.
In 2015, the full network of VMC plots was measured, with an additional 22 plots established to better represent forests across the state. At the resulting 41 forest monitoring plots, field crews conducted detailed canopy assessments of 1,983 mature trees representing 16 different species, 8 different forest types, across 8 different biophysical regions. In total, the information obtained from this plot network provides a robust estimate of the current condition of the state’s forests, providing early indications of potential problems that may affect the broader region.
2015 in Summary
Forest Health: There are many metrics used to assess the condition of tree canopies. The VMC data follows FIA’s Forest Health Monitoring (P3) methods for crown health assessments including early symptoms of tree stress, such as increases in foliage transparency, as well as more chronic decline metrics like crown dieback and live crown ratio. Our assessment of 2015 (Table 1) showed that while the mean dieback (11.4 percent) across all key species in 2015 was not excessive, it does represent an increase compared to the historical average (9.5) and 2014 levels (9.6). Overall percent transparency in 2015 (22.6 percent) was also slightly higher than historical (20.6 percent) or 2014 (21 percent) levels. Neither of these represent significant deviations from the norm based on the amount of variability inherent in year-to-year measurements.
Broken down by species, measurements of percent dieback, live crown ratio, and transparency were similar or improved compared to historical measurements for most species. Exceptions include paper birch with increased dieback and transparency, and white ash with increased transparency compared to historical norms. Changes in paper birch are consistent with reports of declines across the region, and may also be indicative of our maturing forests, of which paper birch is a minor component. Increases in white ash transparency could be due to frost injury that affected 24,000 acres across the state, from moisture deficits present during critical leaf expansion in April and May, and/or resulting from the increased incidence of ash yellows witnessed across the
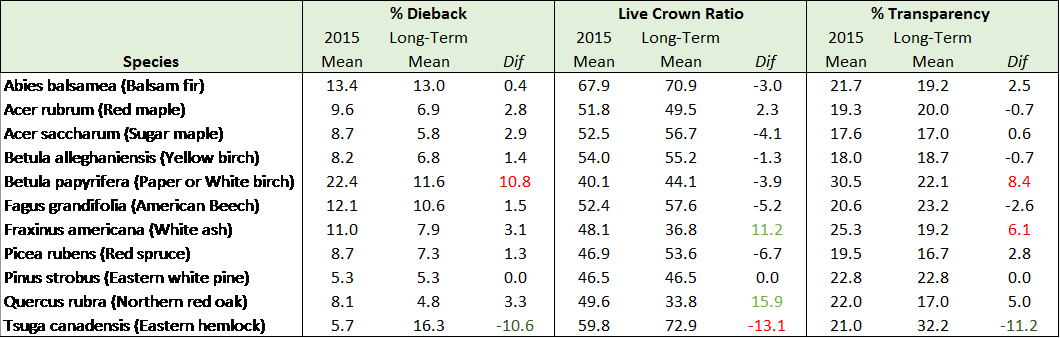
region. Eastern hemlock also reported a reduced live crown ratio, but it is likely that this reflects the expanded plot network, capturing a broader range of stands, including those with hemlock understories or locations with sub-optimal conditions.
Long Term Trends
Forest Health Trends: An examination of the full temporal dataset allows us to look past the year-to-year variability to consider species recovery rates and identify more chronic stress conditions. Figure 1 fits a simple spline to the mean transparency and dieback for each species per year. While there is clearly a large amount of annual variability, the percent canopy dieback trend exhibits a nearly uniform peak in the mid- 2000’s. The 2001-2002 drought was likely involved in these widespread declines. Since that time, percent dieback has remained relatively stable across all species.
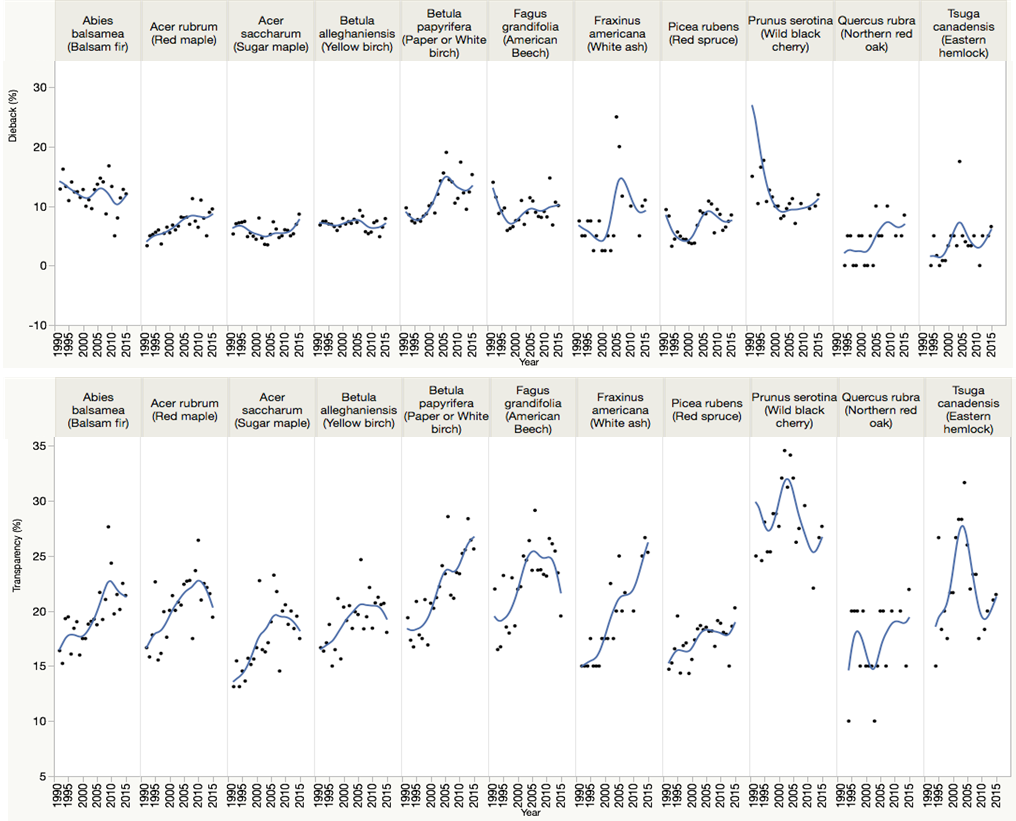
In contrast, mean transparency values over the past decade increased dramatically over those from the 1990’s for almost all species. However, since 2010, there is evidence that this trend may be reversing for most species except for white ash and paper birch. The VMC will continue to monitor these species to understand how changing environmental conditions are altering forest health or competitive relationships.
Seedling Abundance: Seedling counts provide an estimate of the relative success of germination and initial survivorship across species from year to year. In 2015, overall seedling density was similar to previous years on 19 plots with long-term records (excluding 2014, which reported particularly high seedling counts)(Figure 2). However, it is important to note that a protocol change, implemented in 2014, expanded the definition of seedlings to capture current germinants and establishment patterns as well as longer term seedling survivorship. Prior to 2014, seedlings were only counted when they exceeded a certain height (6” for conifers, 12” for hardwoods, as per FIA protocol), and from 2014 on, all seedlings with true leaves and smaller than 1” DBH were counted. Thus, one explanation for the increase in 2014 overall seedling density may stem from the inclusion of seedlings that were previously ignored in counts. Yet this does not explain the significant drop in seedling density from 2014 to 2015. While different species cycle through different low and high mast years, the decrease is consistent across species. It is possible that the unusually dry spring, an official drought statewide and a moderate drought in southern Vermont in May, impacted overall germination success and survivorship across species.
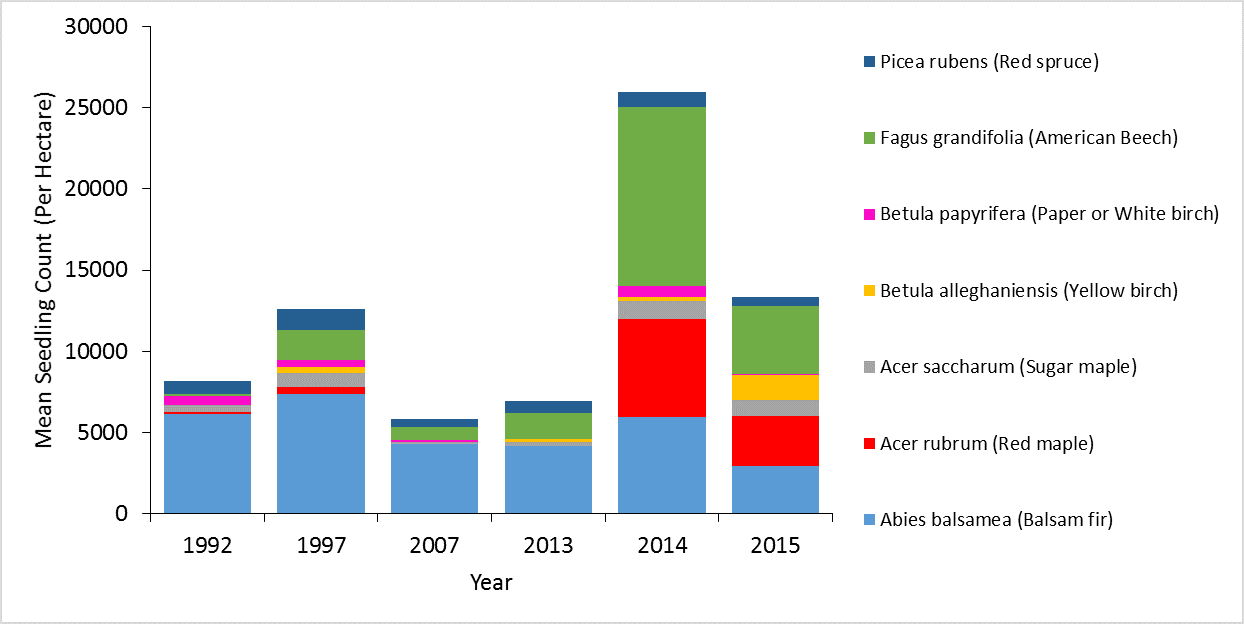
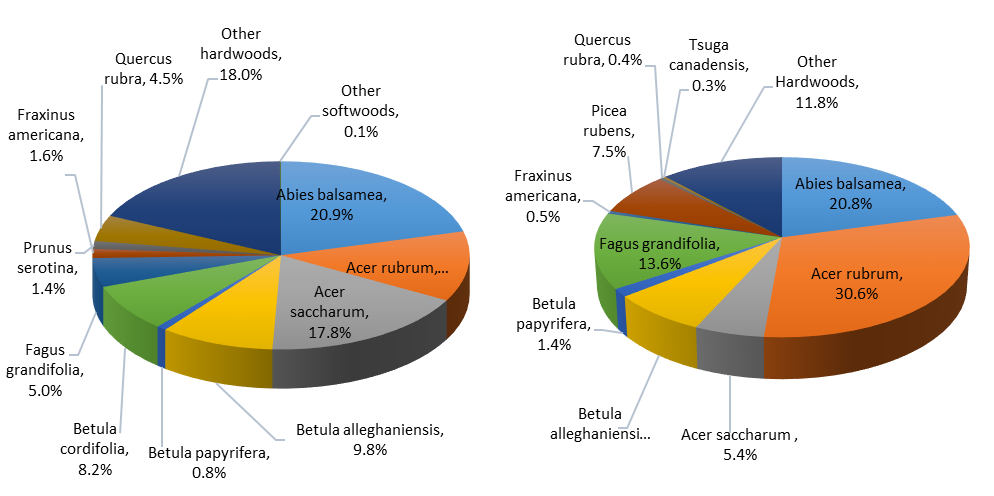
Seedling density across the 19 monitoring plots showed an increase in yellow birch seedlings in 2015 (Figure 2). Across all 41 plots, dominant species were American beech, red maple, and balsam fir (Figure 3). While these patterns vary dramatically across plots due to the broad geographic and elevational range of plots spanning many forest types, the lack of regeneration of low to mid-elevational shade tolerant species such as sugar maple and eastern hemlock is concerning. Considering that the species composition of mature trees across the VMC long-term monitoring plots (Figure 3) is dominated by balsam fir at upper elevations and northern hardwoods (sugar maple, American beech, and yellow birch) at mid-lower elevations, our data suggests that red maple regeneration is disproportionately high while sugar maple regeneration is disproportionately low. Given the regional economic and ecological importance of sugar maple, and apparent dominance of red maple regeneration in northern hardwood stands, further monitoring is warranted to understand the trends and patterns of sugar maple regeneration.
Sapling Survivorship: Saplings (stems between 1 and 5 inches DBH) have been measured yearly on the 19 original VMC sub-plots between 1997 and 2007, and then again starting in 2014. This metric estimates the relative survivorship of seedlings and serves as a proxy for the future composition of the forest canopy. Our sapling assessments over this time period show a consistent drop in paper birch, yellow birch, and sugar maple. There are several ways that sapling counts can change: by growing out of the sapling class (and henceforth included in the full plot inventories of mature trees), through mortality of existing stems, and from a lack of recruitment of smaller stems into the sapling class. Based on this data we cannot determine which mechanism is primarily driving the decline in sapling numbers across the plot network. However, informed by the regeneration data, it is possible that reduced sugar maple seedling establishment and survivorship is contributing to its subsequent decline in the sapling class. Between the 2007 and more recent 2014 and 2015 sapling inventories, there were also dramatic increases in the density of both American beech and red spruce. Both are mid-late successional species that increase in dominance as forests mature. However, this dramatic rise (up almost 50% over 2007 levels for both species) may be a result of changes in site characteristics favoring these species. Low soil moisture may favor beech seedlings that originate from root sprouts. Reduced soil calcium from years of acid deposition would be better tolerated by species like beech and red maple.
Implications
VMC forest health monitoring has been instrumental in determining how trees respond to, and recover from, stress events. Our monitoring is able to detect subtle but steady changes that may not be captured by VT FPR aerial surveys or be highly visible to the public. Long-term trends indicate that some species continue to fare better than others (e.g. increased dominance of American beech and red maple over sugar maple and birch species). Examination of metrics for other species indicates long-term trends that warrant ongoing monitoring of declining condition, particularly for paper birch and white ash. Regeneration data continues to indicate that the species currently dominating seedling classes may signal a shift in the composition of future forests in Vermont.
Forested ecosystems provide immeasurable benefits to society; from their aesthetic beauty and recreational opportunities to biomass energy and carbon sequestration. While the composition of forests may change, this ongoing work will inform forest management decisions to maximize forest resiliency, productivity and health of the forested landscape into the future.
The regions’ forests are diverse and resilient, but shifting competitive relationships and regeneration patterns may lead to changes in forest composition over the coming decades.
Additional Resources
- VT Forests, Parks and Recreation Vermont Forest Health Highlights 2015. Online at http://fpr.vermont.gov/sites/fpr/files/Forest_and_Forestry/Forest_Health/Library/2015%20VT%20Forest%20Health%20Highlights.pdf
- VT Forest Insects and Disease Conditions 2015. Online at http://fpr.vermont.gov/sites/fpr/files/Forest_and_Forestry/Forest_Health/Library/2015%20I%26D%20Conditions%20Report%20final.pdf
VMC Project Database Link
- Forest health monitoring: https://www.uvm.edu/femc/project/forest-health-monitoring