Trout
Wild Brook Trout Monitoring in the West Branch of the Little River and Ranch Brook
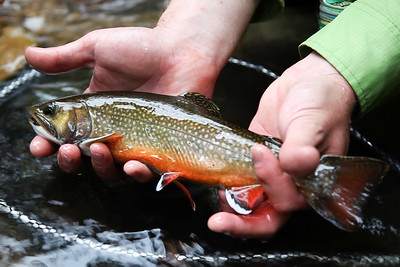
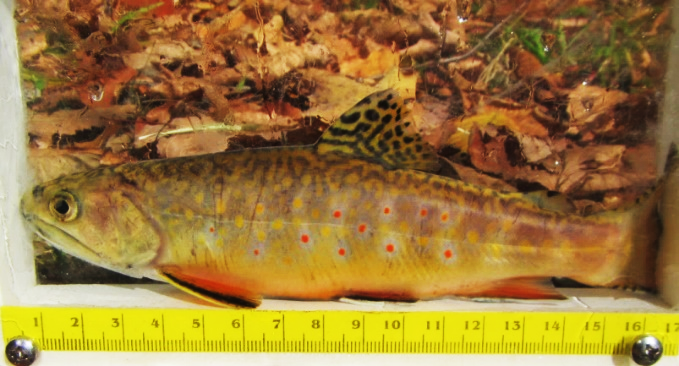
The brook trout Salvelinus fontinalis is native to Vermont and widely distributed in cold-water streams throughout the state. These populations are often considered an indication of healthy ecosystems due to their stringent water quality and habitat requirements. In addition to their ecological value, brook trout are a favorite among Vermont anglers.
The Vermont Fish and Wildlife Department has monitored wild brook trout populations in the West Branch of the Little River and Ranch Brook since 1997. While this evaluation initially focused on the potential effects of ski area development and snowmaking water withdrawals on brook trout populations, these data also provide valuable insights into the effects of broader environmental variables over the long term.
The Data
Trout population surveys were conducted annually from 1997 through 2018 at two stations on the West Branch and two stations on Ranch Brook. In 2018 trout population surveys were not conducted at the 1,440’ elevation station on the West Branch of the Little River. Trout population surveys consisted of multiple run sampling with a 500-volt DC streamside electrofisher. Survey sections were generally 250 ft. in length and were done July when stream flow had subsided and brook trout young-of-year (yoy) became large enough to effectively sample.
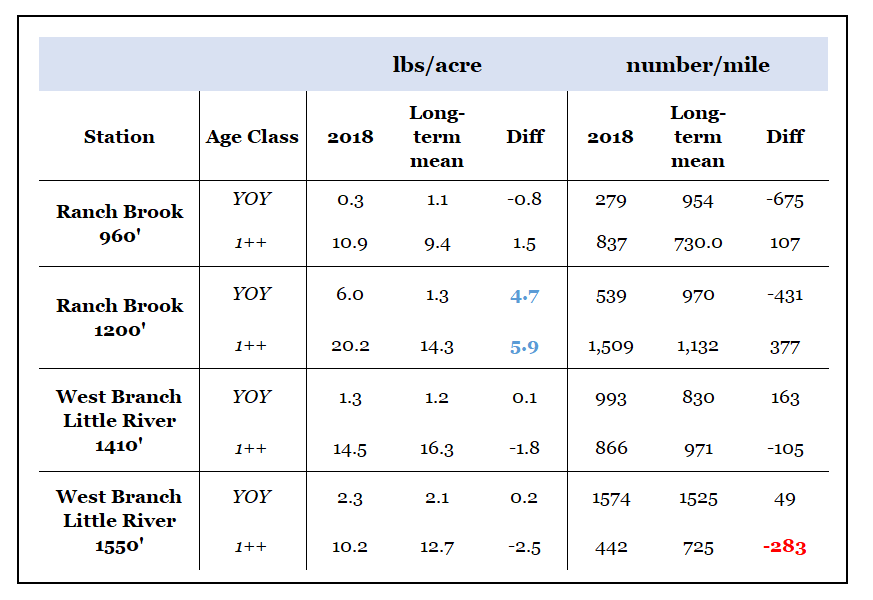
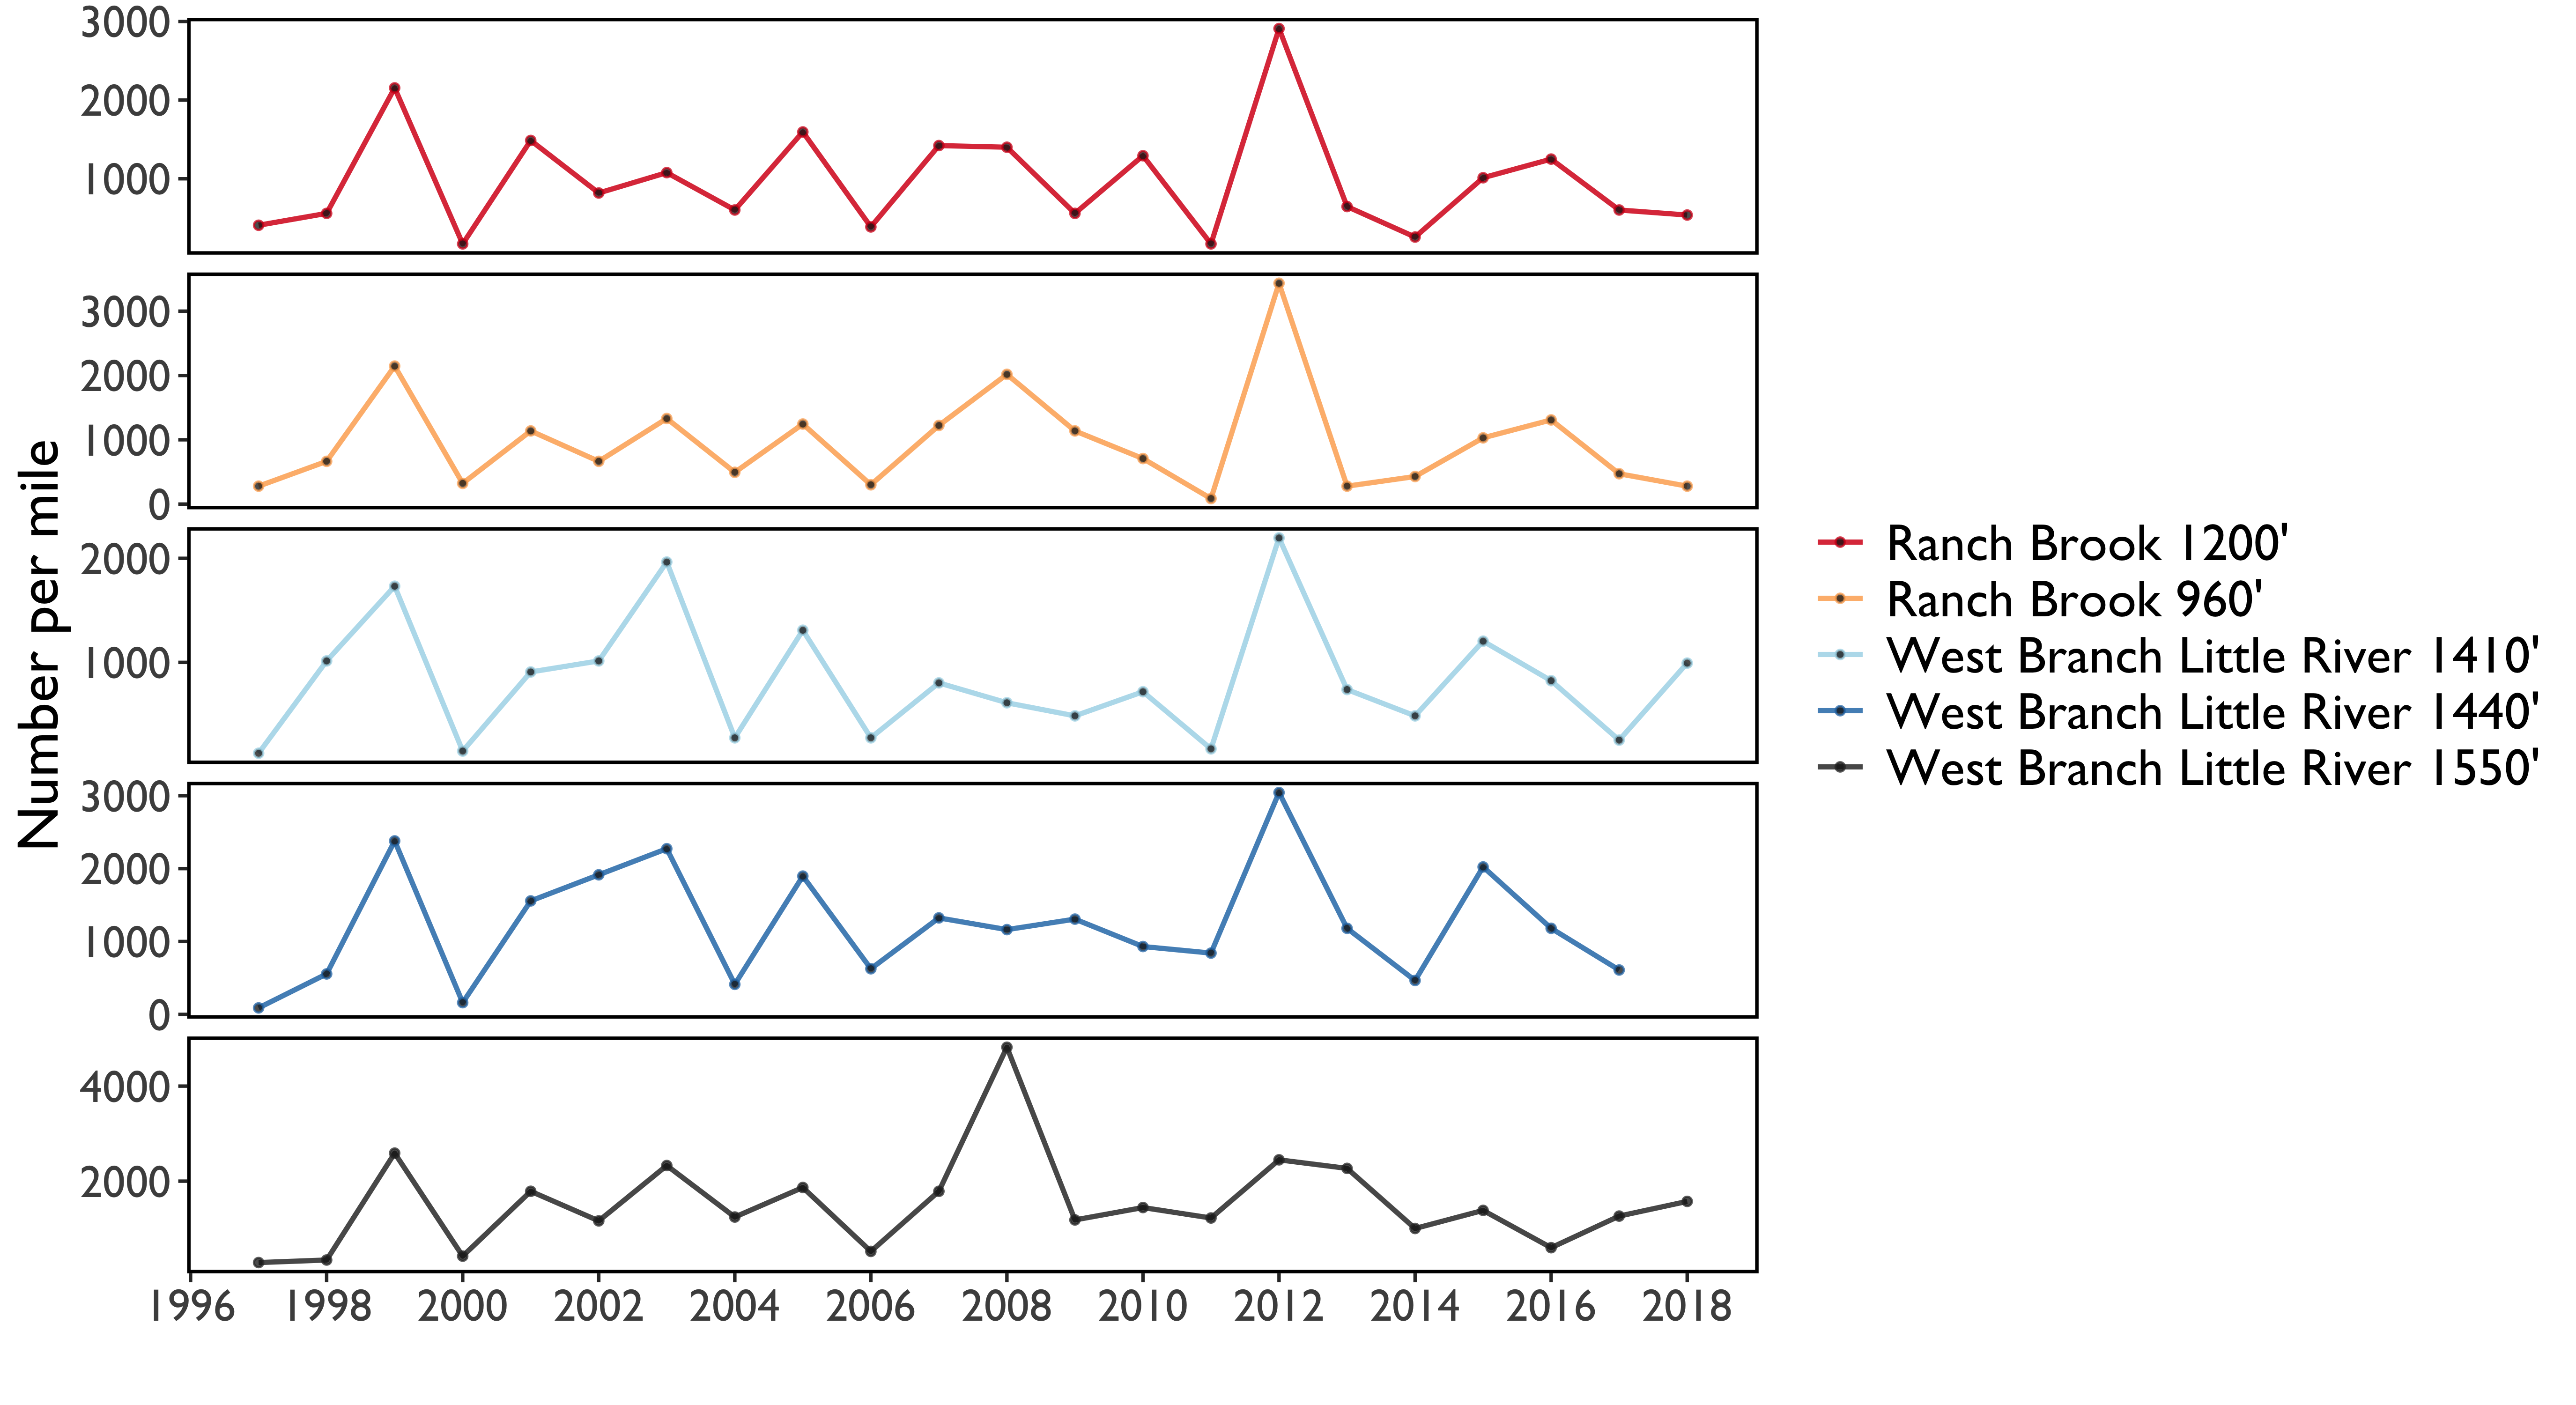
Trout captured during stream surveys were measured to the nearest millimeter and weighed to the nearest gram. Population estimates within each sampling station were based upon the removal method and determined by the maximum weighted likelihood method developed by Carle and Strub (1978). Population estimates were calculated for each of two age classes, (1) yoy and yearlings and (2) older fish greater than 1 year in age (1++) distinguished by length distribution. The population estimates were standardized to represent number per mile (#/mi) for each age class and summed for the total brook trout population within each station (Table 6). Live brook trout biomass (lbs/acre) was also calculated at each station (Table 6).
2018 in Summary
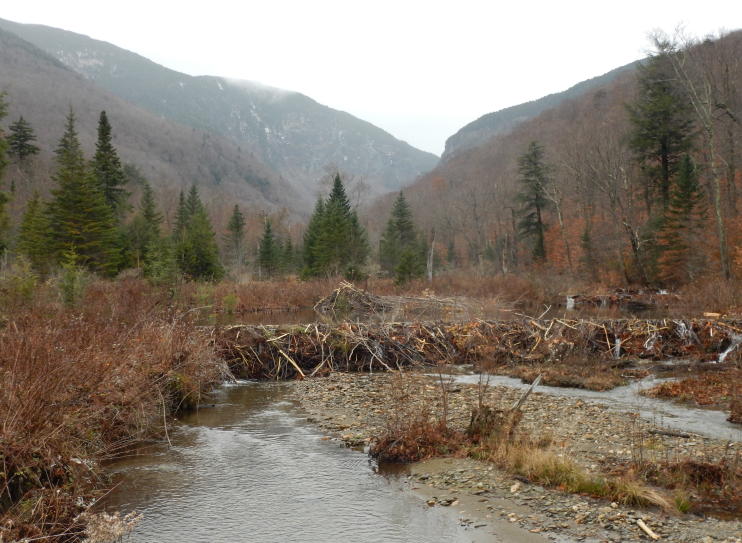
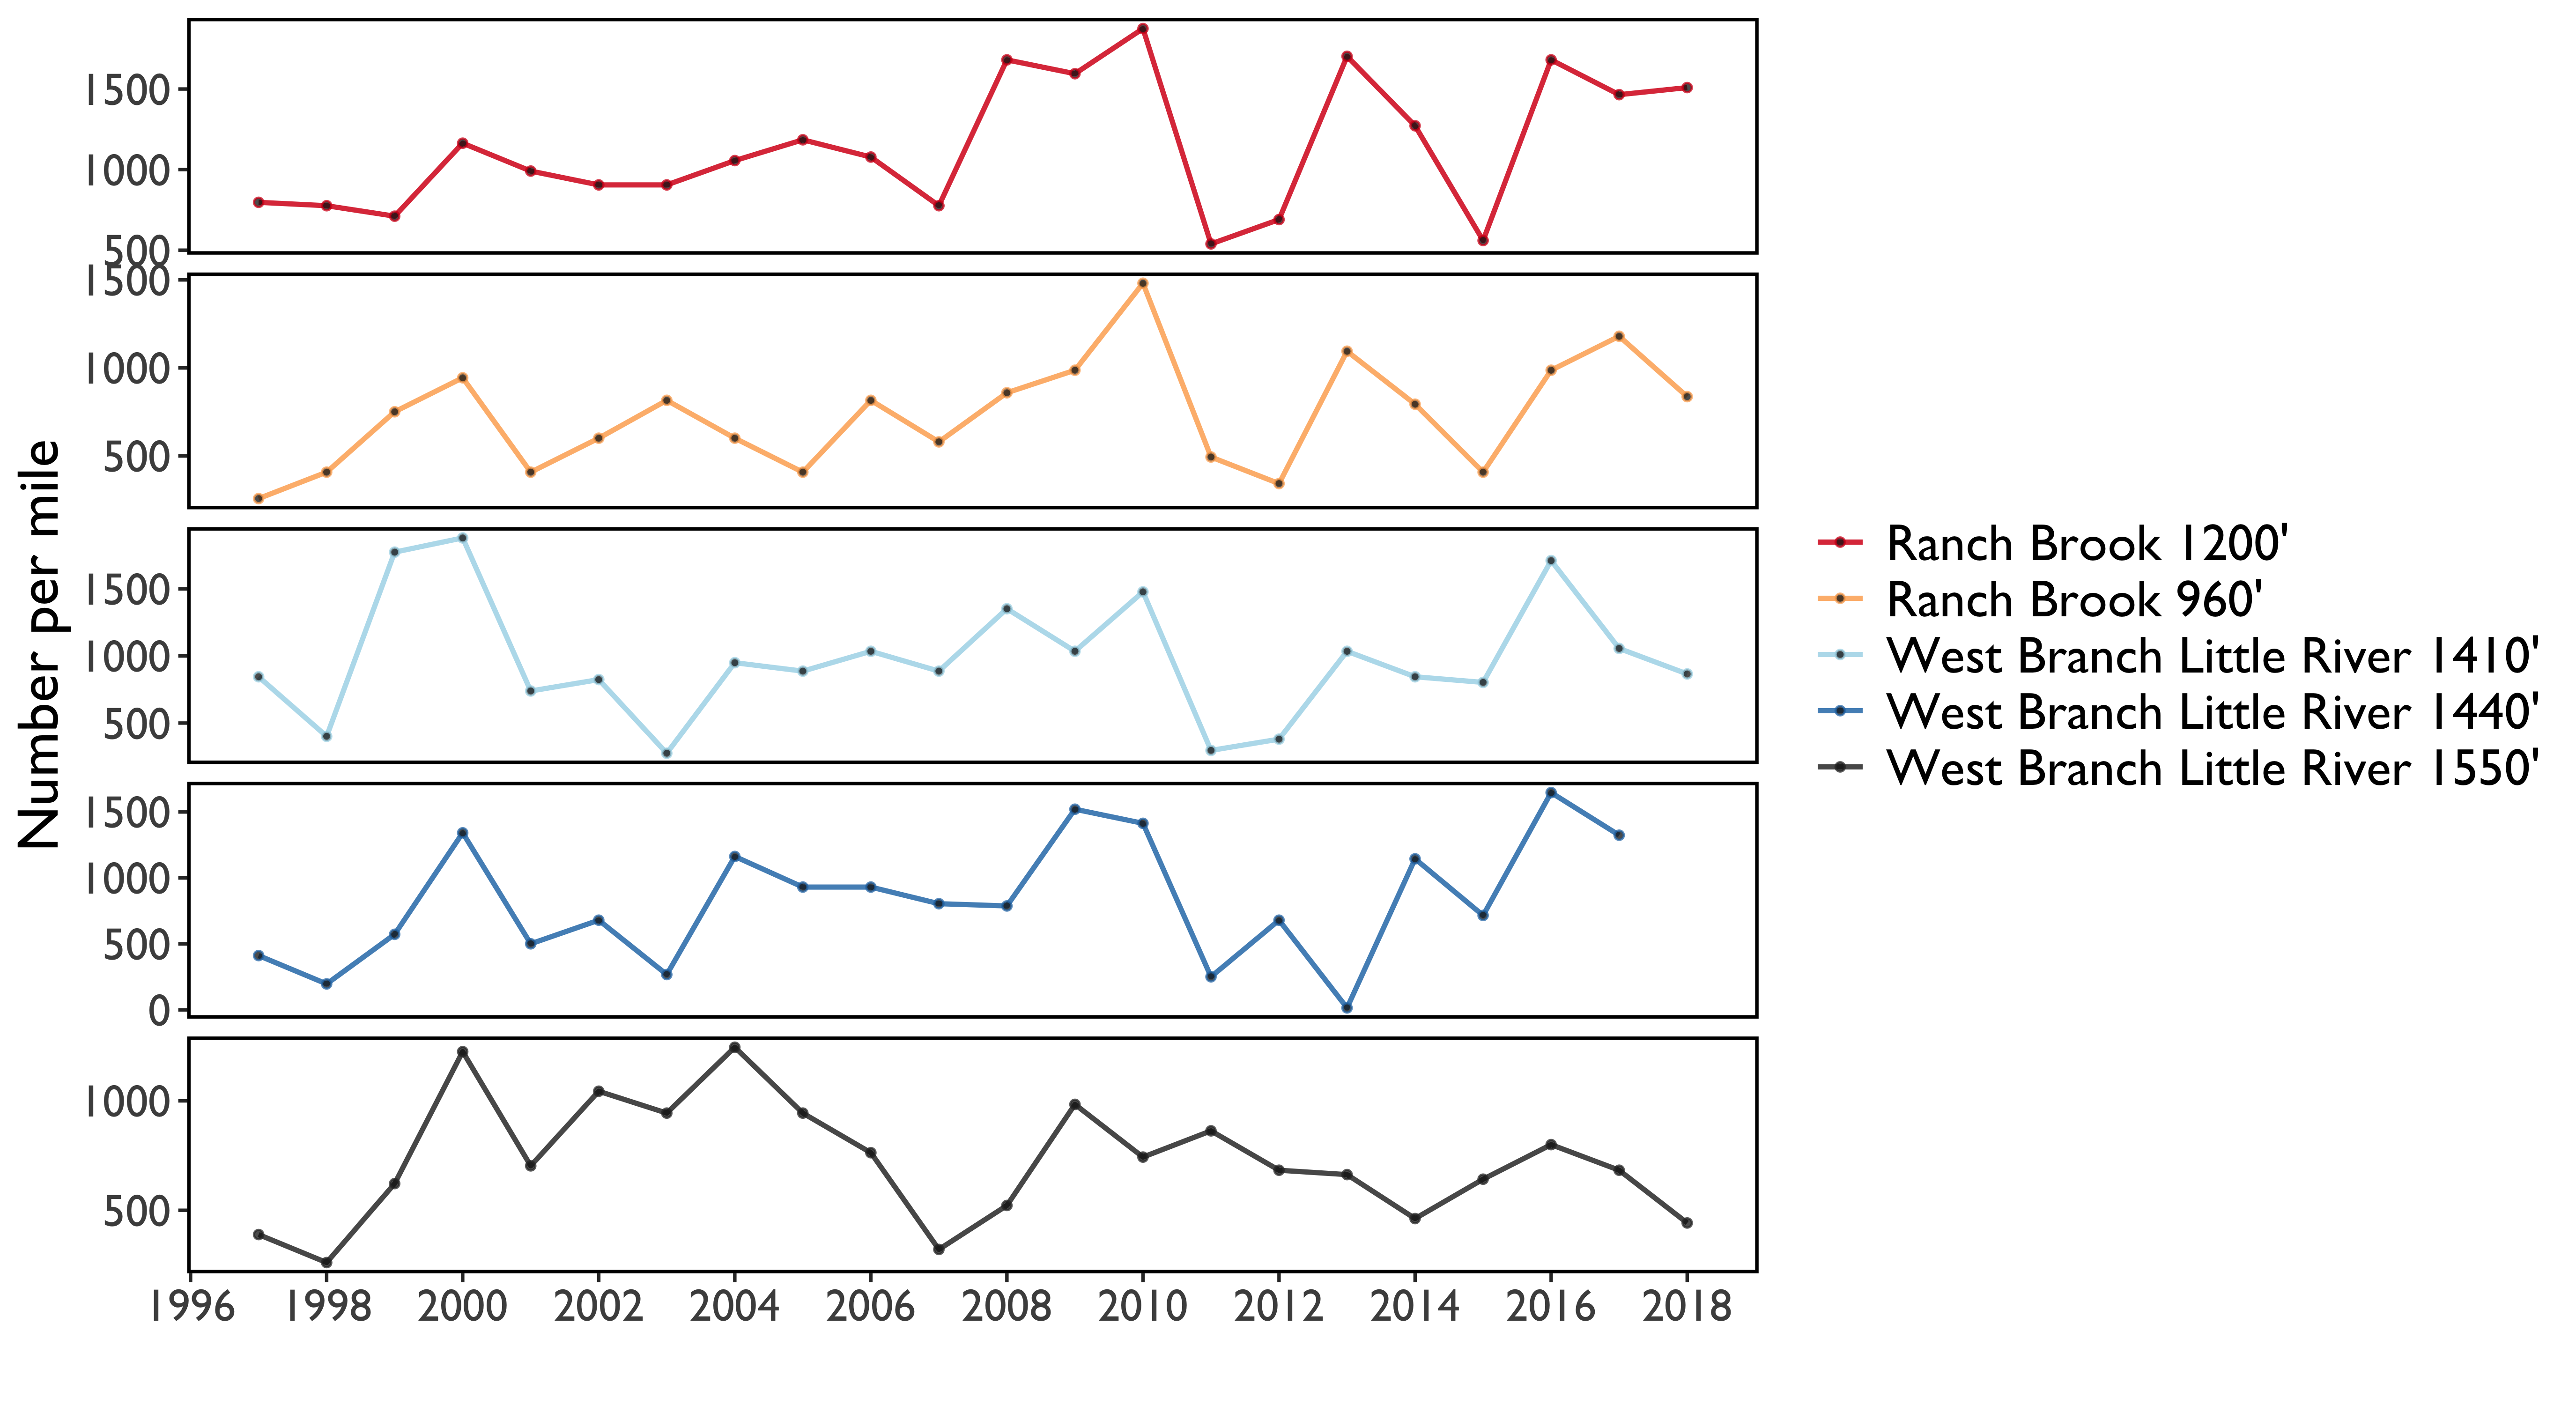
In 2018, natural reproduction of brook trout (yoy) decreased at both Ranch Brook stations when compared to 2017 and the long-term mean (Table 6). Natural reproduction at the two West Branch stations increased relative to 2017 and the long-term mean (Table 6). Population estimates for fish older than one year declined at all stations except the 1200’ Ranch Brook Station when compared to 2017 estimates. Population estimates varied across stations when compared to the mean population estimates for the entire sampling period (Table 6). The West Branch 1550’ station recorded population estimates much lower than the long-term mean, which may be partly due to a change in suitable fish habitat throughout the sampling reach as a beaver pond complex above the station forced a new channel to form within the station. The 1200’ Ranch Brook station had modest increases compared to the long-term mean (Table 6). Biomass (lbs/acre) estimates were relatively stable across all stations (Table 6). However, the 1200’ elevation Ranch Brook station estimates in 2018 were much higher than the long-term mean at this location (Table 6).
Long Term Trends
West Branch and Ranch Brook supported high quality brook trout populations maintained through natural reproduction. These populations consist of multiple age classes and average over 1760 trout per mile over the 22-year study. Wild brook trout populations vary considerably among and within streams due to differences in habitat conditions and localized land use effects while broad environmental variables may have significant temporal effects. While large fluctuations were observed for each age class, both within and among the two study streams, no clear trends were evident.
Annual brook trout yoy production showed clear highs and lows, often consistent across the 4 stations and two study streams, suggesting the effect of broad environmental influences. Successful recruitment of yoy requires suitable habitat conditions over an extended period of time including fall spawning, overwinter incubation and spring emergence. In some years peak yoy production was followed by commensurate increases in the yearling and older population, such as those observed in 1999-2000 and 2012-2013. Yearling and older brook trout populations tend to be more stable and are able to quickly recover following extreme events. For example, very high flow events in the summer of 2010 and spring 2011 may have contributed to the yearling and older brook trout declines observed in some stations but these populations rebounded to above average levels by 2013.
Implications
Global climate change predictions suggest a continued loss of brook trout populations throughout their range due to increases in stream temperature and flood frequency. Forested watersheds and riparian areas will be critical for the long-term persistence of Vermont’s wild brook trout populations, as they serve to moderate water temperatures and streamflow, filter and retain sediments and nutrients, contribute and retain large wood and organic matter, stabilize streambanks and floodplains and provide for complex and diverse aquatic habitats. Improving aquatic passage through the elimination of constructed barriers (e.g. culverts, weirs and dams) will also help ensure brook trout are able to access critical habitats and recover from extreme natural events which reduce population levels.
The predicted climate change has induced an increase in flood frequency and stream temperatures which does do not bode well for brook trout populations.
References
Carle, F.L. and Strub, M.R., 1978. A new method for estimating population size from removal data. Biometrics, pp.621-630.
Additional Resources
FEMC Project Database Links
Wild Brook Trout Monitoring in the West Branch of the Little River and Ranch Brook https://www.uvm.edu/femc/data/archive/project/Wild-Brook-Trout-Monitoring-in-the-west-Branch-of-the-little-river-and-ranch-brook