Water Quality
Water Quality from the Acid Lakes Monitoring Program
Acid rain was first detected as a serious environmental problem in the late 1960s. Emissions of sulfur dioxide (SO2) and nitrogen oxides (NOx) react with water, oxygen, and other chemicals in the atmosphere to form sulfuric and nitric acids. Resulting hydrogen ions in acid rain leach plant-necessary cations (e.g., calcium, magnesium, potassium, phosphorus) from the soil and into water bodies, and make toxic cations, like aluminum, more available. Such changes have been shown to negatively affect all levels of ecosystem health, from trees to soil microorganisms.
The Data
When high-elevation lakes in geologically sensitive areas were becoming acidified, the Environmental Protection Agency (EPA) enacted the Acid Lakes Monitoring Program, under the Long-Term Monitoring Program (LTM). In Vermont, monitoring, analysis and reporting is conducted by the Department of Environmental Conservation (DEC), in partnership with FEMC
Water quality samples are collected three times a year (spring, summer, and fall). Measurements include pH, transparency, temperature, color, and concentrations of calcium, magnesium, sodium, potassium, aluminum, nitrate, sulfate, chloride, silica, total phosphorus and dissolved organic carbon (DOC). For most measurements, the methods of collection, processing, and analysis have remained consistent for nearly 30 years, providing long-term records of water quality in VT.
2017 in Summary
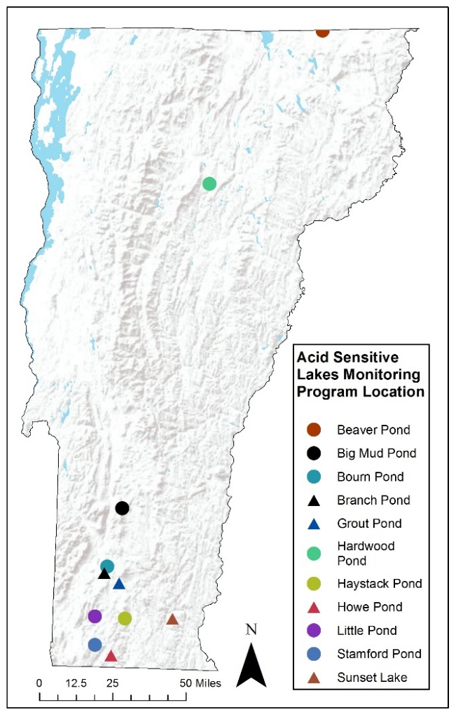
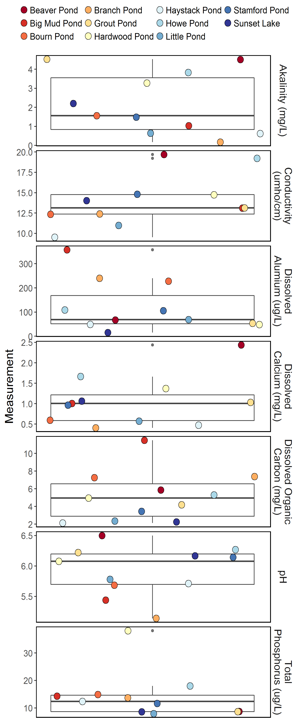
In 2017, we saw a range of values for water quality measurements in the 11 lakes and ponds in the Acid Lakes Monitoring Program (Figure 35) which reflects the variability in the different water bodies and in the parameters measured. For some, but not all, of the measured water quality parameters, average values among the 11 acid lakes degraded slightly from 2016. This is most likely due to the increase in sulfur emissions and deposition in the northeast.
Average pH was 5.92, which is slightly lower than the average value in 2016 (5.94), a reversal of the trend from the year before. Reductions in aluminum are a good indicator of improving water quality, but mean dissolved aluminum across all sites increased from 93.5 ug/L in 2016 to 122.1 ug/L in 2017 after a decrease the year prior (data not shown). Note that in 2017 there was high variability in mean dissolved aluminum measured in the 11 acid lakes, ranging from a high of 357.8 µg/L at Big Mud Pond to a low of 15.3 µg/L at Sunset Lake. This variation is likely due to a number of factors, including location, deposition received, water depth, bedrock, and surrounding conditions.
Similarly, alkalinity did not improve, decreasing from 2.29 mg/L in 2016 to 2.17 mg/L in 2017. Conductivity increased slightly from 2016 (14.0 µmho/cm in 2017; 13.7 µmho/cm in 2016). Dissolved calcium decreased from 1.13 mg/L in 2016 to 1.05 mg/L in 2017.
Phosphorus concentration was 14.0 µg/L, slightly higher than it was in 2016 (12.1 µg/L). Dissolved organic carbon is a broad grouping of organic molecules resulting from decomposing organic matter. It is not only a food source for aquatic microorganisms, but is an indicator of terrestrial health. In 2017, the mean value (5.14 mg/L) increased from 2016 (4.35 mg/L).
Long-Term Trends
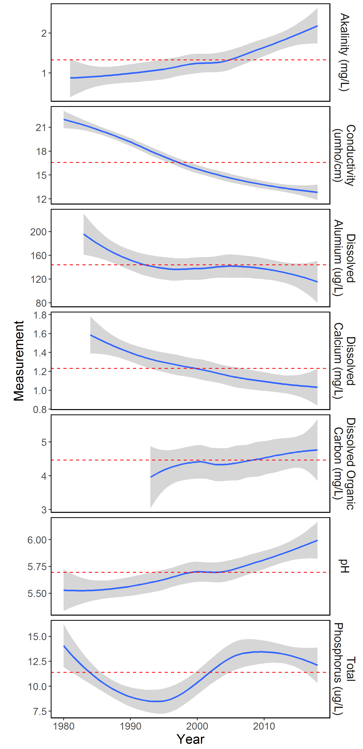
The data from the 11 acid lakes demonstrate that acid accumulation and cation leaching has declined over the long-term record (1980-2016). Despite reductions in 2017, alkalinity and pH are both increasing over time (Figure 36). Concurrently, conductivity (a measure of the electrolyte concentration), dissolved aluminum, and dissolved calcium are still showing a decreasing trend despite increases in 2017.
Dissolved organic carbon (DOC) has been increasing since it was first measured in the early 1990s, although there is more variability among the 11 acid lakes for DOC compared to other measured variables, as indicated by the size of the confidence intervals around the average (Figure 36).
Phosphorus, which is easily transported in water, is an essential nutrient for all life, however, excessive concentrations can lead to algal blooms, as has been observed in Lake Champlain. Historical patterns in total phosphorus show considerable variability, but concentrations have decreased from a peak in 2008 (Figure 36). Overall, the phosphorous values measured in the acid lakes are below the threshold for negative impacts.
Globally, northern hemisphere, lakes have been undergoing a “browning” effect due to increases in DOC. At the same time, the most pristine oligotrophic (e.g., relatively low in plant nutrients) lakes have been seeing an increase in phosphorus, or a “greening” effect. Overall, Vermont’s acid lakes are following this same trend.
Regional Context & Implications
Similar trends in pH and dissolved cations are evident across the region. These long-term data are evidence that ecosystem recovery has begun following the Clean Air Act and subsequent amendments, which have substantially reduced deposition of sulfur and nitrate – two components that react in the atmosphere to produce acid rain.
As acid rain was first discovered in the mid-1960s, we lack records of water quality prior to acidification. As a result, it is uncertain what parameter values designate full ecosystem recovery. Further, acid rain has not completely vanished, as we are still seeing deposition of sulfur and nitrogen on the landscape. Despite this uncertainty, the recovery of our lakes and ponds compared to values in the 1980s supports the effectiveness of regulation to combat acidic pollutants and continued monitoring to help protect our valuable resources. Moving forward, as the threat of acid rain declines, other types of pollutants are becoming more problematic, such as phosphorus loading in our large water bodies.
Acknowledgements
Special thanks to Heather Pembrook from the Vermont Department of Environmental Conservation for reviewing and editing the Water Quality Section of the 2017 FEMC Long-Term Monitoring Update.

Overall, the long-term data (1980-2017), provide support that vulnerable lakes and ponds in Vermont are chemically recovering from decades of acid rain. Moving forward, phosphorus may become more problematic as acidic inputs decline and DOC increases.
References
- SanClements, M.D., G.P. Oelsner, D.M. McKnight, J.L. Stoddard and S.J. Nelson. 2012. New Insights into the Source of Decadal Increases of Dissolved Organic Matter in Acid Sensitive Lakes of the Northeastern United States. Environmental Science & Technology 46(6):3212-3219.
- Williamson, C.E., Overholt, E.P., Pilla, R.M., Leach, T.H., Brentrup, J.A., Knoll, L.B, Mette, E.M and Moeller, R.E. 2015. Ecological consequences of longterm browning in lakes. Scientific Reports 5. 186666.
- Monteith, D.T., J.L. Stoddard, C.D. Evans, H.A. de Wit, M. Forsius, T. Hogasen, A. Wilander, B. Skjelkvale, D.S. Jeffries, J. Vuorenmaa, B. Keller, J. Kopacek, and J. Vesely. 2007. Dissolved organic carbon trends resulting from changes in atmospheric deposition chemistry. Nature 450(7169): 537-540.
- Lawrence, G.B, J.E. Dukett, N. Houck, P. Snyder, and S. Capone. 2013. Increases in Dissolved Organic Carbon Accelerate Loss of Toxic Al in Adirondack Lakes Recovering from Acidification. Environmental Science and Technolology. 47 (13): 7095–7100
Additional Resources
- Vermont Monitoring Programs for Acid Rain: http://www.watershedmanagement.vt.gov/bass/htm/bs_acidrain-mon.htm
- US Environmental Protection Agency Long Term Monitoring Program: http://www2.epa.gov/airmarkets/monitoring-surface-water-chemistry
FEMC Project Database Link
- Long Term Monitoring of Acid Sensitive Lakes https://www.uvm.edu/femc/data/archive/project/long-term-monitoring-acid-sensitive-lakes