Water Quality in Acid-Sensitive Lakes
The Acid Lakes Long Term Monitoring Program
Acid rain was first detected as a serious environmental problem in the late 1960s. Emissions of sulfur dioxide (SO2) and nitrogen oxides (NOx) react with water, oxygen, and other chemicals in the atmosphere to form sulfuric and nitric acids. Resulting hydrogen ions in acid rain leach plant-necessary cations (e.g., calcium, magnesium, potassium, phosphorus) from the soil and into water bodies, and make toxic cations, like aluminum, more available. Such changes have been shown to negatively affect all levels of ecosystem health, from trees to soil microorganism.
The Data
When high-elevation lakes in geologically sensitive areas were becoming acidified, the Environmental Protection Agency (EPA) enacted the Acid Lakes Monitoring Program in Vermont, New York, and Maine under the Long-Term Monitoring Program (LTM). Note that data from Maine only extends up to 2016 and not all yearly parameter values were available from each state.
Water quality samples are collected three times a year (spring, summer, and fall). Measurements include pH, transparency, temperature, color, and concentrations of calcium, magnesium, sodium, potassium, aluminum, nitrate, sulfate, chloride and dissolved organic carbon (DOC). For most measurements, the methods of collection, processing, and analysis have remained consistent for nearly 30 years, providing us long-term records of water quality in the region and throughout the US.
2017 in Summary
In 2017, we saw a range of values for water quality measurements in the lakes and ponds in the regional Acid Lakes Monitoring Program. This reflects the variability in the different water bodies in the region, as well natural variability in the parameters measured. For some, but not all, of the measured water quality parameters, average values among the regional acid lakes improved from 2016.
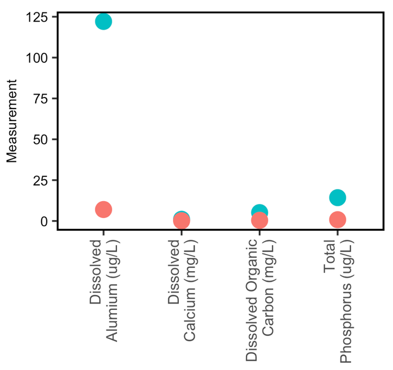
A good indicator of improving water quality, dissolved aluminum has continued to decrease precipitously, although we see a large range in values depending on location (Figure 5). Vermont acid lakes contain a great deal more dissolved aluminum compared to acid lakes in New York. As we do not have access to 2017 data in other states, we cannot assess if there are similarities with other states. Yet, in 2016, Maine acid lakes showed a range of dissolved aluminum values that are similar to Vermont’s mean concentration, which may indicate that New York concentrations are on the low end regionally.
For both New York and Vermont, dissolved calcium concentrations are similar in 2017 (Figure 5), and show a slight reduction from the previous year. This is a positive sign of decreasing acid deposition.
Dissolved organic carbon is a broad grouping of organic molecules resulting from decomposing organic matter. It is not only a food source for aquatic microorganisms, but is an indicator of terrestrial health. In 2017, Vermont had much a higher mean concentration of DOC compared to New York (5.15 and 0.39 mg/L, respectively) (Figure 5), with both states showing an increase from the previous year. For context, mean DOC concentration in Maine in the most recent year of data (2016) was 4.8 mg/L, which is comparable to Vermont. Why New York acid lakes contain much less DOC is unclear.
Vermont also had higher concentrations of phosphorus compared to New York (14.3 and 0.8 ug/L, respectively; Figure 5). Vermont and New York values were slightly higher than in 2016.
Long-Term Trends
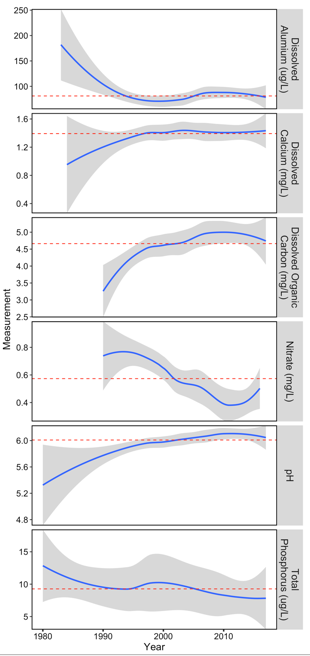
The data from the regional acid lakes show evidence that acid accumulation and cation leaching have declined over the long-term record (1980-2017). Water pH has been increasing over time and has surpassed the regional mean of 6.0 in recent years (Figure 6). Concurrently, dissolved aluminum has been decreasing precipitously since it was first measured in the mid 1980s. Surprisingly, we are not seeing a similar regional reduction in dissolved calcium, although concentrations have plateaued and are declining in the last few years. This may reflect the spatial variability among the states, including different bedrock materials and soil types.
Another good indicator of ecosystem health, dissolved organic carbon has been increasing since it was first measured in the early 1990s; however, in recent years there is a slight decline in this trend (Figure 6). Mean nitrate concentration has been showing a declining trend, which is a good indication of less acid loading.
Total phosphorus shows a varied pattern, but overall there is a decrease in concentration from a peak in 2003 (Figure 6). The concentrations detected in the regional acid lakes are below the threshold for ecosystem issues. Phosphorus, which is easily transported in water, is an essential nutrient for all life, however, excessive concentrations can lead to algal blooms.
Implications
Trends in increasing pH and declining dissolved cations are evident across the region. These long-term data are proof of ecosystem recovery following the Clean Air Act and subsequent amendments, which have substantially reduced deposition of sulfur and nitrate – two components that react in the atmosphere to produce acid rain.
As acid rain was first discovered in the mid-1960s, we lack records of water quality prior to acidification. As a result, it is uncertain what measurement values designate full ecosystem recovery. Further, acid rain has not completely vanished, as we are still seeing deposition of sulfur and nitrogen on the landscape. Despite this uncertainty, the relatively quick recovery of our lakes and ponds compared to values in the 1980s supports regulation to combat acidic pollutants and continued monitoring to help protect our valuable resources. Moving forward, as the threat of acid rain declines, other types of pollutants are becoming more problematic, such as phosphorus loading in our large water bodies.

In 2017, most water quality indices have improved. However, limited datasets among the states mean that results should be taken lightly. Overall, the long-term data (1980-2017), provide support that vulnerable lakes and ponds in the region are recovering from decades of acid rain. Moving forward, phosphorus may become more problematic as acidic inputs decline.
In 2017, most water quality indices have improved. However, limited datasets among the states mean that results should be taken lightly. Overall, the long-term data (1980-2017), provide support that vulnerable lakes and ponds in the region are recovering from decades of acid rain. Moving forward, phosphorus may become more problematic as acidic inputs decline.
Additional Resources
- Vermont Department of Environmental Conservation. Vermont Integrated Watershed Information System. Accessible at https://anrweb.vt.gov/DEC/IWIS/
- Adirondack Lakes Survey Corporation website, http://www.adirondacklakessurvey.org/
- EPA Clean Air Markets – Monitoring Surface Water Chemistry: https://www.epa.gov/airmarkets/clean-air-markets-monitoring-surface-water-chemistry
FEMC Project Database Link
- Long Term Monitoring of Acid Sensitive Lakes https://www.uvm.edu/femc/data/archive/project/long-term-monitoring-acid-sensitive-lakes