Precipitation Chemistry and Acid Deposition
National Atmospheric Deposition Program/National Trends Network

The ecological consequences of atmospheric acid deposition have been well studied in the Northeastern US. Through these investigations, acid rain has led to the decline of red spruce in the 1970s and 80s, the leaching loss of calcium and other cations from soil, and the acidification of lakes and streams. Two measures of acid deposition are sulfate (SO4) and nitrate (NO3); when emitted as air pollutants, these molecules can form acids through reactions with water in the atmosphere, creating what we know as ‘acid rain’. Recognizing this serious environmental threat, regulations were enacted to control emissions of sulfur and nitrogen oxides, which react in the atmosphere to produce acidic compounds; as a result, acidic deposition has declined and ecosystem recovery is underway.
The Data
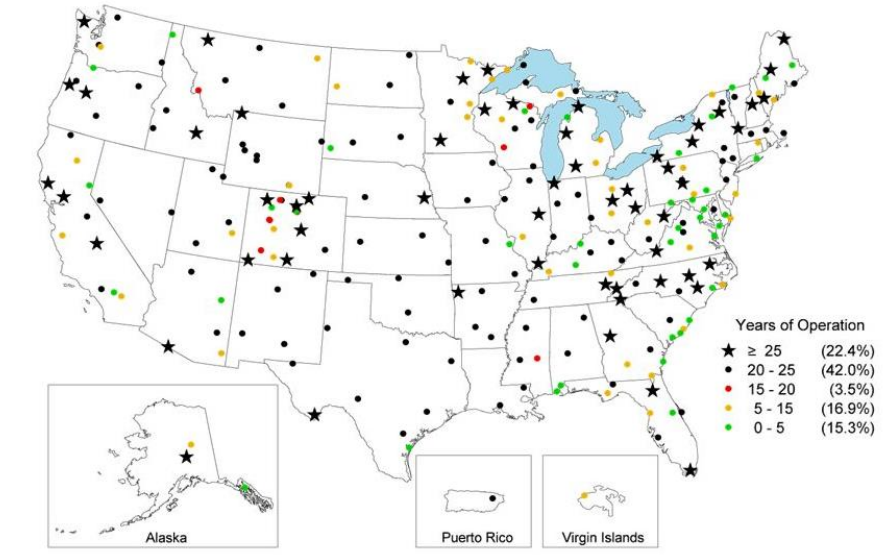
NTN sites are predominantly located away from urban areas and point sources of pollution. Each site is equipped with a precipitation chemistry collector and gage. The automated collector ensures that the sample is exposed only during precipitation (wet-only-sampling). Site operators follow standard operational procedures to help ensure NTN data is comparable. All samples are analyzed and verified by the Central Analytical Laboratory (CAL) at the Illinois State Water Survey (ISWS). Measurements include acidity (H+ as pH), conductance, calcium (Ca2+), magnesium (Mg2+), sodium (Na+), potassium (K+), sulfate (SO42-), nitrate (NO3-), chloride (Cl-), and ammonium (NH4+). Deposition is expressed as a concentration of the pollutant, which reflects the amount of water in which it is transported. The continental scale of NTN sites reveals spatial and temporal trends in acid deposition in Vermont and the Northeast and allows comparison with other regions of the U.S. Today, this information is necessary to understand how air quality policies have ameliorated acid deposition across the region, and to inform future policy and management decisions to sustain the health of the region’s forested ecosystems.
2016 in Summary
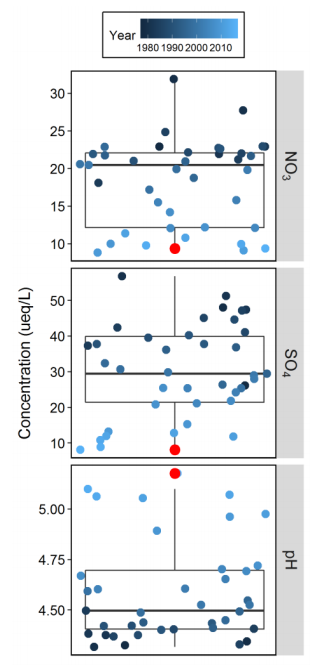
For all three metrics of acid deposition (NO3, SO4, pH), 2016 continued the trend of reduced pollution concentrations over historical measurements in the region (Figure 2).
While mean deposition of NO3 in 2016 was not the lowest value observed in the record (Figure 2), it was the third lowest at 9.3 ueq/L, and was a considerable decline from the Figure 2. Mean annual deposition of nitrate (NO3), sulfate (SO4), and pH for the region, displayed with quantile box plots. The most recent year’s measurements (2016) are indicated in red, and shades of blue correspond to the year, with lighter values corresponding to more recent data. Solid horizontal line indicates the long-term mean; any points outside vertical bars at top and bottom of boxes show values that are statistically outside of the range for that parameter. Further, for every year in the most recent decade (2006 on), precipitation contained the lowest measured concentrations of NO3.
In 2016, we saw the lowest concentration of SO4 in the record (8.1 ueq/L). This is a dramatic decline from the historical high of 56.8 ueq/L in 1980. Unlike the historical record, in 2016 deposition of SO4 was lower than that of NO3.
The average pH was the highest on record at 5.2, which indicates that precipitation in the form of rain, snow, or ice is less acidic than in 2015. While the pH has increased considerably from the record’s low of 4.3 in 1980, “unpolluted” rain typically has a pH of 5.6. Therefore, there is still room for continued improvement in lowering the acidic of precipitation. As pH is a logarithmic scale, this increase represents a roughly fivefold improvement in precipitation acidity.
In the early years of acid rain monitoring, sulfates accounted for about 66% of the acidity in precipitation, while nitrates contribute the other 33%. While upwind emissions of both sulfur oxides (SOx) and nitrogen oxides (NOx) have declined over time, reductions in SOx have been greater than NOX. While the stress imposed by SOx deposition has been greatly reduced, it is unclear how the continued deposition of NOx will impact forested ecosystems.
Long-term Trends
Since precipitation chemistry was first measured in the region, rain has become less acidified (Figure 3). These changes reflect declines in sulfur- and nitrogenbased emissions due to the Clean Air Act (1977) and subsequent amendments (1990). The most significant reductions have occurred for sulfate deposition, which has fallen from nearly 56.8 ueq/L in 1980 to less than 10 ueq/L currently. Note that for certain years, there is higher variability, which shows the variation in the region from west to east (Figure 4) and that the number of stations has increased recently (Figure 1).
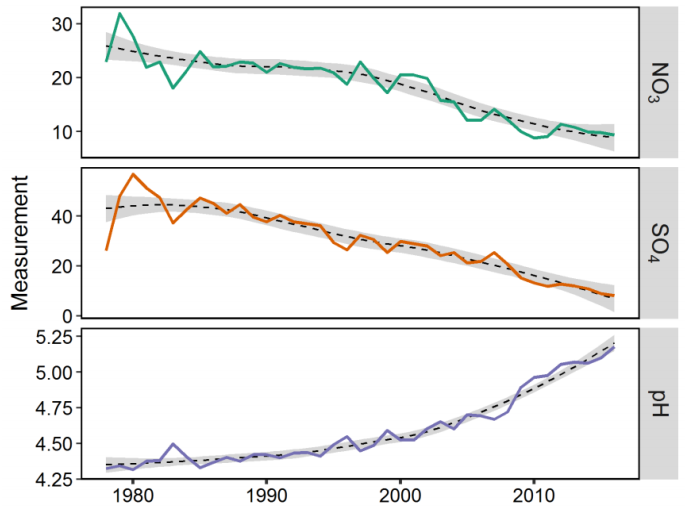
More modest changes have been measured for nitrate deposition. This is primarily due to the relative difficulty of removing nitrogen compounds from flue gases and their diffuse pollution sources such as motor vehicle exhaust and agricultural activities. Sulfuric emissions have been easier to control through regulation of emissions from the burning of coal, natural gas, and other fossil fuels.
Concurrently, there has been a dramatic increase in precipitation pH (Figure 3). Since pH is on a logarithmic scale, increasing pH by a value of 1 signifies a substantial change in precipitation acidity.
Looking forward, it is likely that reductions in SO4 may continue (Figure 3), along with resultant decreases in precipitation acidity. However, it appears that reductions in NO3 concentrations may have plateaued. Because nitrogenous pollution primarily comes from diffuse sources such as automobile exhaust, fertilizer use, and confinement farming such as feedlots and poultry operations in agricultural regions, continued reductions may require additional legislative or regulatory action.
Regional Context & Implications
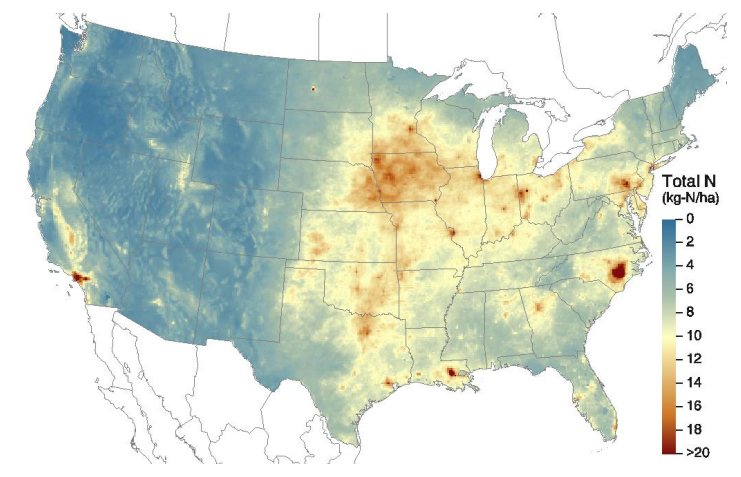
The region is in relatively good shape compared to nitrogen pollution loads nationwide (Figure 4). However, high elevation forests are still at risk from additional acidic inputs due to more frequent exposure to acid mist in clouds, higher amounts of precipitation, Figure 4. Spatial distribution of total nitrogen deposition (kg/ha) across the continental US in 2015. Source: US EPA. and relatively shallow acidic soils. Further, there are some areas of the region, particularly western and southern portions of New York, that have continued to receive elevated nitrogen deposition (Figure 4).
As nitrogen becomes a more important constituent of acid deposition, monitoring networks and modelers are combining resources to better understand the spatial and temporal patterns of nitrogen deposition and its impacts on terrestrial and aquatic ecosystems. Continued reductions in nitrogen deposition may require additional regulation to control point sources.
- Acid deposition continued to decline in 2016.
- The average pH of precipitation was 5.2, well above the historical low.
- Nitrate deposition reductions may have plateaued and should continue to be monitored.
- Acid deposition continued to decline in 2016.
- The average pH of precipitation was 5.2, well above the historical low.
- Nitrate deposition reductions may have plateaued and should continue to be monitored.
Additional Resources
- National Atmpospheric Deposition Program. http://nadp.sws.uiuc.edu/NTN/
- EARTH: The Science Behind the Headlines. American Geosciences Institute. http://www.earthmagazine.org/
FEMC Project Database Link
- National Atmospheric Deposition Program/National Trends Network (NADP/NTN) https://www.uvm.edu/femc/data/archive/project/national-atmospheric-deposition-programnational-trends-network