On the right is my lesson plan for the equity lesson. I had the
students do an introduction to data collection and analysis for my lesson.
This was a fun lesson to do and I hope to use it again someday. In
the student assessment I talk about how I need to be more clear in my directions
so that it will be easy for the students to do what I intend for them to
do. (PC 2d)
|
TEACHER: Sarah DesLauriers
CONTEXT: Math
TOPIC: How many Pockets?
TIME: 20 minutes
DATE: March 31, 2003
OBJECTIVES:
Students will collect data
Students will organize data
Students will analyze data
RELATED STANDARDS:
NCTM Standards: K-2 Data Analysis (Pose Questions, gather
data, represent data, describe data)
VT Standard 7.9: Students use statistics and probability
concepts. This is evident when students collect, order, display and
analyze data in order to answer a question.
MATERIALS:
Marker
Easel and paper
TEACHING-LEARNING PROCEDURE:
Teacher will tell students that she has a question
for them. The teacher wants to know How Many Pockets do you all
have?
Teacher will ask students to count their pockets
Question that may come up
Is this a pocket?, What
constitutes a pocket? Go to class for answers
Create a chart together (have students come up and
put Xs on the chart) of how many kids have a certain number of pockets.
Count together and then put appropriate number of Xs on the paper.
Ask students what they see. Listen for clear
thinking and using correct terms. (eg. There are 3 kids with 4 pockets,
not There are 3 with 4)
STUDENT ASSESSMENT:
The students collected data, organized the data, and
started to analyze the data. The students did not go in the direction
that I wanted them to go. They insisted on counting the number of
pockets total, and that isnt what I wanted them to do. However,
it was a good natural direction for them to take. I wanted them to
talk about the data and not counting, but I seem to have led them there
by labeling the graph, How Many Pockets? In the future I will have
to watch myself better and think harder about what I decide to name the
graph. The children did seem to understand how we got the information
and then put it on the graph. I dont think it will stick, because
I didnt really give them any practice time. If I had more time I
would have had the children do their own data collection in groups and
make sure that they understand what they are doing. I do wish that
I had time for a better closing as well. That is an area that I need to
work on. |
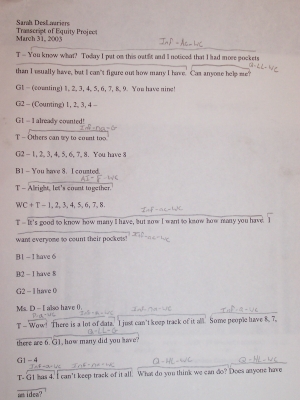 |
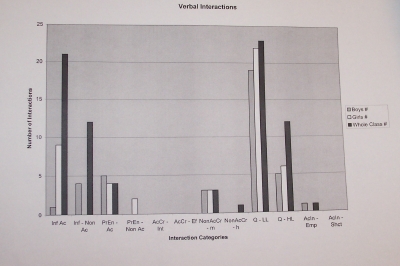
This is a picture of a transcript that I transcribed. It
is the first page of 9. This transcript has everything that was said
during the first part of the lesson and it is marked up to show what I
said, whether it be high level questions or low level questions.
It is important to ask a variety of question both high level and low level,
as well as address both genders equally. as early as second grade
girls and boys tend to see math as a boys domain and by the sixth grade
girls see mathematics as less important and useful to career goals than
boys do. In the third grade girls will often rate themselves below
boys, whether or not they are better in math at them or not. This
kind of issue can be traced to many different groups and not just boys
and girls. The NCTM standards says that its not just gender, but
also race, other cultures, those who speak different languages, and those
with disabilities. A teachers role in all of this is to make
sure that everyone gets and equal opportunity to learn and to make sure
that the math is structured so every can understand it to the best of their
ability (PC 4b, 2c)
|