Matplotlib Basics

We’re just going to cover the basics here. Why? Because Matplotlib has thousands of features and it has excellent documentation. So we’re just going to dip a toe in the waters.
For more, see:
The most basic basics
We’ll start with perhaps the simplest interface provided by Matplotlib, called pyplot. To use pyplot we usually import and abbreviate:
import matplotlib.pyplot as pltRenaming isn’t required, but it is commonplace (and this is how it’s done in the Matplotlib documentation).
Let’s generate some data to plot.
import random

data = [0]
for _ in range(100):
    data.append(data[-1]
                + random.random()
                * random.choice([-1, 1]))
So now we’ve got some random data to plot. Let’s plot it.
plt.plot(data)That’s pretty straightforward, right?
Now let’s label our y axis.
plt.ylabel('Random numbers (cumulative)')Let’s put it all together and display our plot.
import random
import matplotlib.pyplot as plt

data = [0]
for _ in range(100):
    data.append(data[-1]
                + random.random()
                * random.choice([-1, 1]))

plt.plot(data)
plt.ylabel('Random numbers (cumulative)')
plt.show()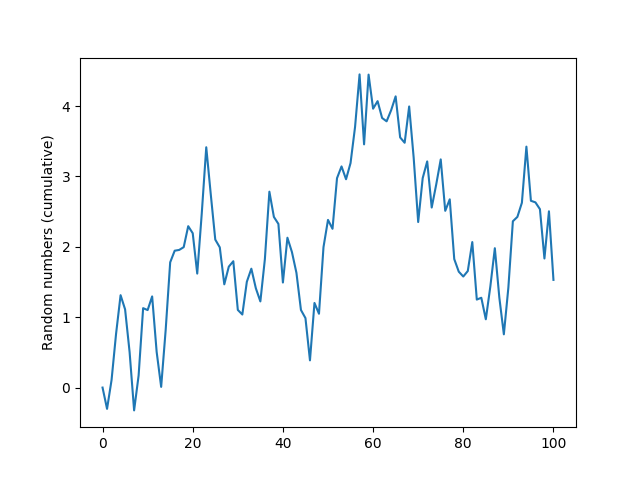
It takes only one more line to save our plot as an image file.
import random
import matplotlib.pyplot as plt

data = [0]
for _ in range(100):
    data.append(data[-1]
                + random.random()
                * random.choice([-1, 1]))

plt.plot(data)
plt.ylabel('Random numbers (cumulative)')
plt.savefig('my_plot.png')
plt.show()
That’s it. Our first plot—presented and saved to file.
Copyright © 2023–2026 Clayton Cafiero
No generative AI was used in producing this material. This was written the old-fashioned way.