Shannon entropy and information gain

Shannon entropy
In order to measure gain in information, we’ll need a way of measuring—quantifying—information.
To borrow an example from statistics, imagine we have a large urn containing 100 ping-pong balls. The ping-pong balls are colored either red or blue, and there are 50 of each: 50 red ping-pong balls, and 50 blue ping-pong balls. If we were to predict the color of a ping-pong ball drawn from this urn at random, we’d do no better than a coin-toss—we could do no better than chance, because the urn contains equal numbers of each. Draw a ball. Maybe it’s red; maybe it’s blue; 50/50.
Now imagine we had the same urn, but instead of 50 balls of each color, we were told that the urn contained 70 red balls and 30 blue balls. Now if we were to predict the color of a ping-pong ball drawn from this urn at random, we’d predict red, and if we were to perform this experiment many times, we’d be right 70% of the time. Going from 50% correct to 70% correct is a big improvement. We’re still drawing from an urn containing 100 ping-pong balls, they’re still blue and red. What changed? What changed is the information we have about the ping-pong balls. Somehow, an urn containing 70 red balls and 30 blue balls has more information than one containing 50 of each.
Now imagine we had the same urn filled with 100 balls of the same color, say red. Now when asked to predict the color of a ball drawn at random, we’d say red, and we’d be right 100% of the time. Clearly, an urn containing balls of a single color has more information than one containing a 70/30 mix or a 50/50 mix.
With respect to this scenario, this is the most information we can have—when the set of all elements is entirely pure—all of a single color. So purity and information are correlated. But how do we quantify this measure?
You might say, OK, given 100 balls of two colors 50/50 (red/blue) is the most impure situation we could have, 70/30 is more pure, 100/0 is the purest we can get. So why not simply use the proportion of one color with respect to the total collection of colored balls? Because 30/70 is just as “pure” and 70/30, and 0/100 is just as pure as 100/0. There’s a symmetry here.
What we do instead is use a measure called Shannon entropy. Shannon entropy is named after Claude Shannon, widely considered to be the founder of modern information theory, and one of the participants in the 1956 Dartmouth workshop during which the term “artificial intelligence” originated. (Anthropic’s Claude is his namesake, BTW.)
So what is Shannon entropy? It’s a measure of the number of bits of information we’d need for complete information about some phenomenon under investigation.
You may have seen entropy in other contexts: thermodynamics, physics, chemistry, statistical mechanics, etc.. You may also have learned that entropy measures uncertainty. But what is uncertainty if not a lack of information?
One way is we can think of it as the number of additional bits of information we’d need to make a determination about the classification of some element. If we were drawing ping-pong balls from some mixed bucket, we’d need one bit of information to determine if the number was red or blue. If we were drawing from pure buckets, we’d need no additional information at all! Zero!
Here’s how we compute Shannon entropy:
H(S) \equiv \displaystyle\sum^c_{i=1} -P_i \log_2 P_i.
where P_i is the probability of the membership in class i.
If we have a c-wise classification we compute the sum of entropy for each of c classes. In the case of binary classification this becomes:
H(S)=-P_{pos}\log_2P_{pos}-P_{neg}\log_2P_{neg}.
In the case of the mixed bucket of ping-pong balls, say we have 50 red balls and 50 blue balls. Plug-and-chug:
\begin{align*} H(S) &= -\frac{50}{100}\log_2\frac{50}{100} - \frac{50}{100}\log_2\frac{50}{100} \\[1em] &= -\frac{1}{2}\log_2\frac{1}{2} - \frac{1}{2}\log_2\frac{1}{2} = 0.5 + 0.5 = 1.0 \end{align*}
Now say we have 70 red balls and 30 blue balls. Again purity is higher, so entropy should be lower.
\begin{align*} H(S) &= -\frac{70}{100}\log_2\frac{70}{100} - \frac{30}{100}\log_2\frac{30}{100} \\[1em] &= -\frac{7}{10}\log_2\frac{7}{10} - \frac{3}{10}\log_2\frac{3}{10} \approx 0.881 \end{align*}
So that works out, higher purity and a lower entropy.
Now let’s see what happens if we have perfect purity.
\begin{align*} H(S) &= -\frac{100}{100}\log_2\frac{100}{100} - \frac{0}{100}\log_2\frac{0}{100} \\[1em] &= -\frac{1}{1}\log_2\frac{1}{1} - \frac{0}{1}\log_2\frac{0}{1} = 0.0 + 0.0 = 0.0 \end{align*}
Now, of course, \log_2 0 is undefined, but that doesn’t matter. The leading coefficient is zero, so that term falls out anyway. The important thing is that we see with perfect purity we have zero entropy—zero uncertainty; complete information!
In our case of urns and balls, entropy can be used as a measure of uncertainty. Entropy is high is we have mixed colors and low if we have pure colors. So purity is high when entropy is low and purity is low when entropy is high. Most importantly, information is high when entropy is low, and vice versa.
Recall what we’ve said so far:
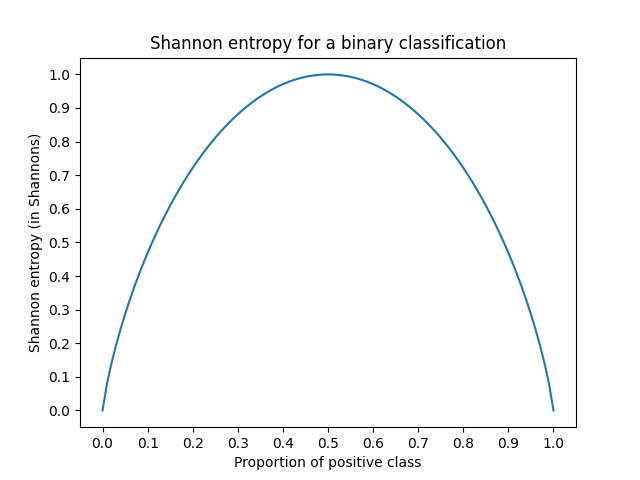
- our measure of entropy should be symmetric,
- entropy should be high when uncertainty is high and purity is low,
- entropy should be low when uncertainty is low and purity is high.
That’s exactly what we see in this plot.
Now that we have a good measure of entropy, we can use it to compute information gain.
Information gain
Information gain is a measure of how much information we gain by partitioning some parent set into subsets, by some attribute.
Information gain is given by
\text{Gain}(S, A) \equiv H(S) - \sum\limits_{v\in \text{Values}(A)} \frac{\lvert S_v \rvert}{\lvert S \rvert} H(S_v)
Let’s unpack this.
- \text{Gain}(S, A) is the information gain we get by partitioning set S on attribute A
- H(S) is the entropy of the parent set S.
- v\in \text{Values}(A) is each of the values that an attribute can have. For example, if the attribute is color, values might be red and blue. If the attribute is number of legs, the values might be 0, 2, 4, 6, and 8 (leaving out the super-creepy bugs that have more than eight).
- \lvert S_v \rvert is the cardinality of the subset we get when partitioning on value v of the given attribute.
- \lvert S \rvert is the cardinality of the parent set.
So the term,
\sum\limits_{v\in \text{Values}(A)} \frac{\lvert S_v \rvert}{\lvert S \rvert} H(S_v)
is a weighted average of the entropies of child sets, and the whole thing
H(S) - \sum\limits_{v\in \text{Values}(A)} \frac{\lvert S_v \rvert}{\lvert S \rvert} H(S_v)
is subtracting the weighted average entropy of the children (all the S_v) from the parent set S. If entropy goes down, we’ve gained information.
(The author tips his hat to TA Layla Musallam for assistance in typing up hen-scratched notes.)
Copyright © 2023–2026 Clayton Cafiero
No generative AI was used in producing drafts of this material. This was written the old-fashioned way. AI was used to rewrite existing pseudocode in LaTeX to produce standalone *.tex files for rendering, and for revisions toward satisfying WCAG 2.1 AA-level accessibility standards as required by UVM policy. AI may also have been used to proofread selected human-written prose. Claude 2.1 with model Sonnet 4.6. Revisions, if any, were performed by the author. AI was not used in generating any code whatsoever. All code samples and starter code are by the author only.