Precision, recall, F1

Understanding decision boundaries, precision, recall, and F1 scores
Most machine learning toolkits will provide some sort of classification report to help you evaluate model performance. These reports often include precision, recall, and F1 metrics.
Consider this diagram in which solid pips represent positive samples (for some property under investigation) and hollow pips represent negative samples.
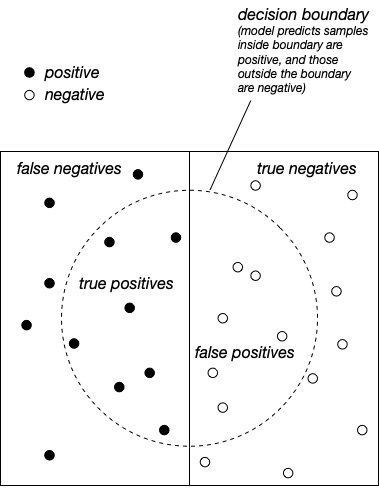
When a model is trained, it forms a decision boundary which (ideally) separates samples belonging to the positive class and those belonging to the negative class. (If it helps, imagine we’re trying to classify tissue samples as malignant (positive) or benign (negative).)
The positive samples that are inside the decision boundary have been classified as positive, and thus are true positives.
The positive samples that are outside the decision boundary have been classified as negative, and thus are false negatives (like Type II error).
The negative samples that are inside the decision boundary have been classified as positive, and thus are false positives (like Type I error).
The negative samples that are outside the decision boundary have been classified as negative and are thus true negatives.
We refer to the samples within the decision boundary collectively as retrieved values. We refer to all actual positive samples as relevant values.
Two important measures of model performance are precision and recall.
Precision tells us how many retrieved values are relevant, that is:
\begin{align*} \text{precision} &= \frac{\text{\# of relevant retrieved values}}{\text{\# of retrieved values}} \\[1.5em] &= \frac{\text{\# of true positives}}{\text{\# of true positives + \# of false positives}} \end{align*}
All other things being equal, the higher this score the better.
Recall tells us how many relevant values were retrieved, that is:
\begin{align*} \text{recall} &= \frac{\text{\# of relevant retrieved values}}{\text{\# of relevant values}} \\[1.5em] &= \frac{\text{\# of true positives}}{\text{\# of true positives + \# of false negatives}} \end{align*}
Again, all other things being equal, the higher this score the better.
The F1 score gives us a measure which balances precision and recall.
\text{F1} = 2 \times \frac{\text{precision} \times \text{recall}}{\text{precision} + \text{recall}}
An F1 score of 1.0 indicates perfect precision and recall. An F1 score of 0.0 indicates no true positives identified.
Another term that you may see in classification reports is support. Support is the number of true instances in each class.
Copyright © 2023–2026 Clayton Cafiero
No generative AI was used in producing drafts of this material. This was written the old-fashioned way. AI was used to rewrite existing pseudocode in LaTeX to produce standalone *.tex files for rendering, and for revisions toward satisfying WCAG 2.1 AA-level accessibility standards as required by UVM policy. AI may also have been used to proofread selected human-written prose. Claude 2.1 with model Sonnet 4.6. Revisions, if any, were performed by the author. AI was not used in generating any code whatsoever. All code samples and starter code are by the author only.