Mercury Deposition
Mercury Deposition Network Monitoring at VT99
Mercury is a persistent pollutant that can accumulate in organisms as it moves up the food chain, leading to neurological damage, lowered reproductive success, motor skill impairment and hormonal changes in humans and animals (Driscoll et al. 2007, Evers et al. 2004). Human activities such as fossil fuel burning and waste incineration elevate levels of atmospheric mercury, which is later transferred to forests and waterbodies through both dry and wet (in precipitation) deposition. Since 1992, VMC has been collecting data on both wet and dry mercury deposition and the mechanisms of mercury cycling, making it one of the longest records in the U.S. In 2004, the VMC joined the Mercury Deposition Network (MDN, part of the National Atmospheric Deposition Program) as one of over 120 sites in the US and Canada. The VMC air quality site serves as a sentinel site for the northeast coast of the continent – it is high enough in elevation to detect regional mercury transport events that are not detected by other stations. This very long record has provided context to many shorter-duration studies, including the way mercury cycles through the forest canopy, how mercury bio accumulates in birds and amphibians, how mercury levels are influenced by elevation, and how falling leaves contribute to deposition. VMC and its partners have committed to this long-term monitoring in order to document and better understand the input of mercury into Vermont's forested ecosystems and the inhabitants of those ecosystems, including birds, fish, bobcats and human beings.
The Data
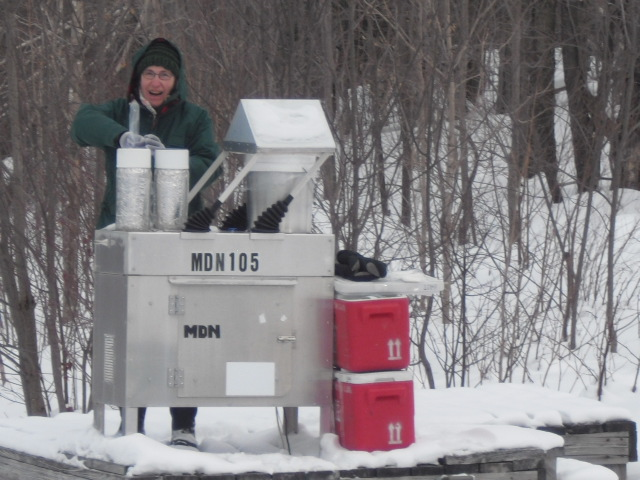
VMC conducts year-round sampling of precipitation chemistry at the air quality monitoring site at the Proctor Maple Research Center in Underhill, Vermont. Weekly composites of precipitation are gathered in an automated wet-only precipitation collector at the site. The collector opens automatically when rain or snow is detected, capturing precipitation through a funnel and tube sampling train into a bottle charged with hydrochloric acid (to better preserve the sample). The collector is heated in the winter and vented in the summer as needed. Samples are collected every Tuesday and shipped to the Mercury Analytical Laboratory at Eurofins Frontier Global Science, Inc. in Bothell, WA for analysis of mercury content and cleaning of the sampling train. Data are submitted to NADP for quality control and posted on the NADP/MDN website (http://nadp.isws.illinois.edu/data/MDN/).
2014 in Summary
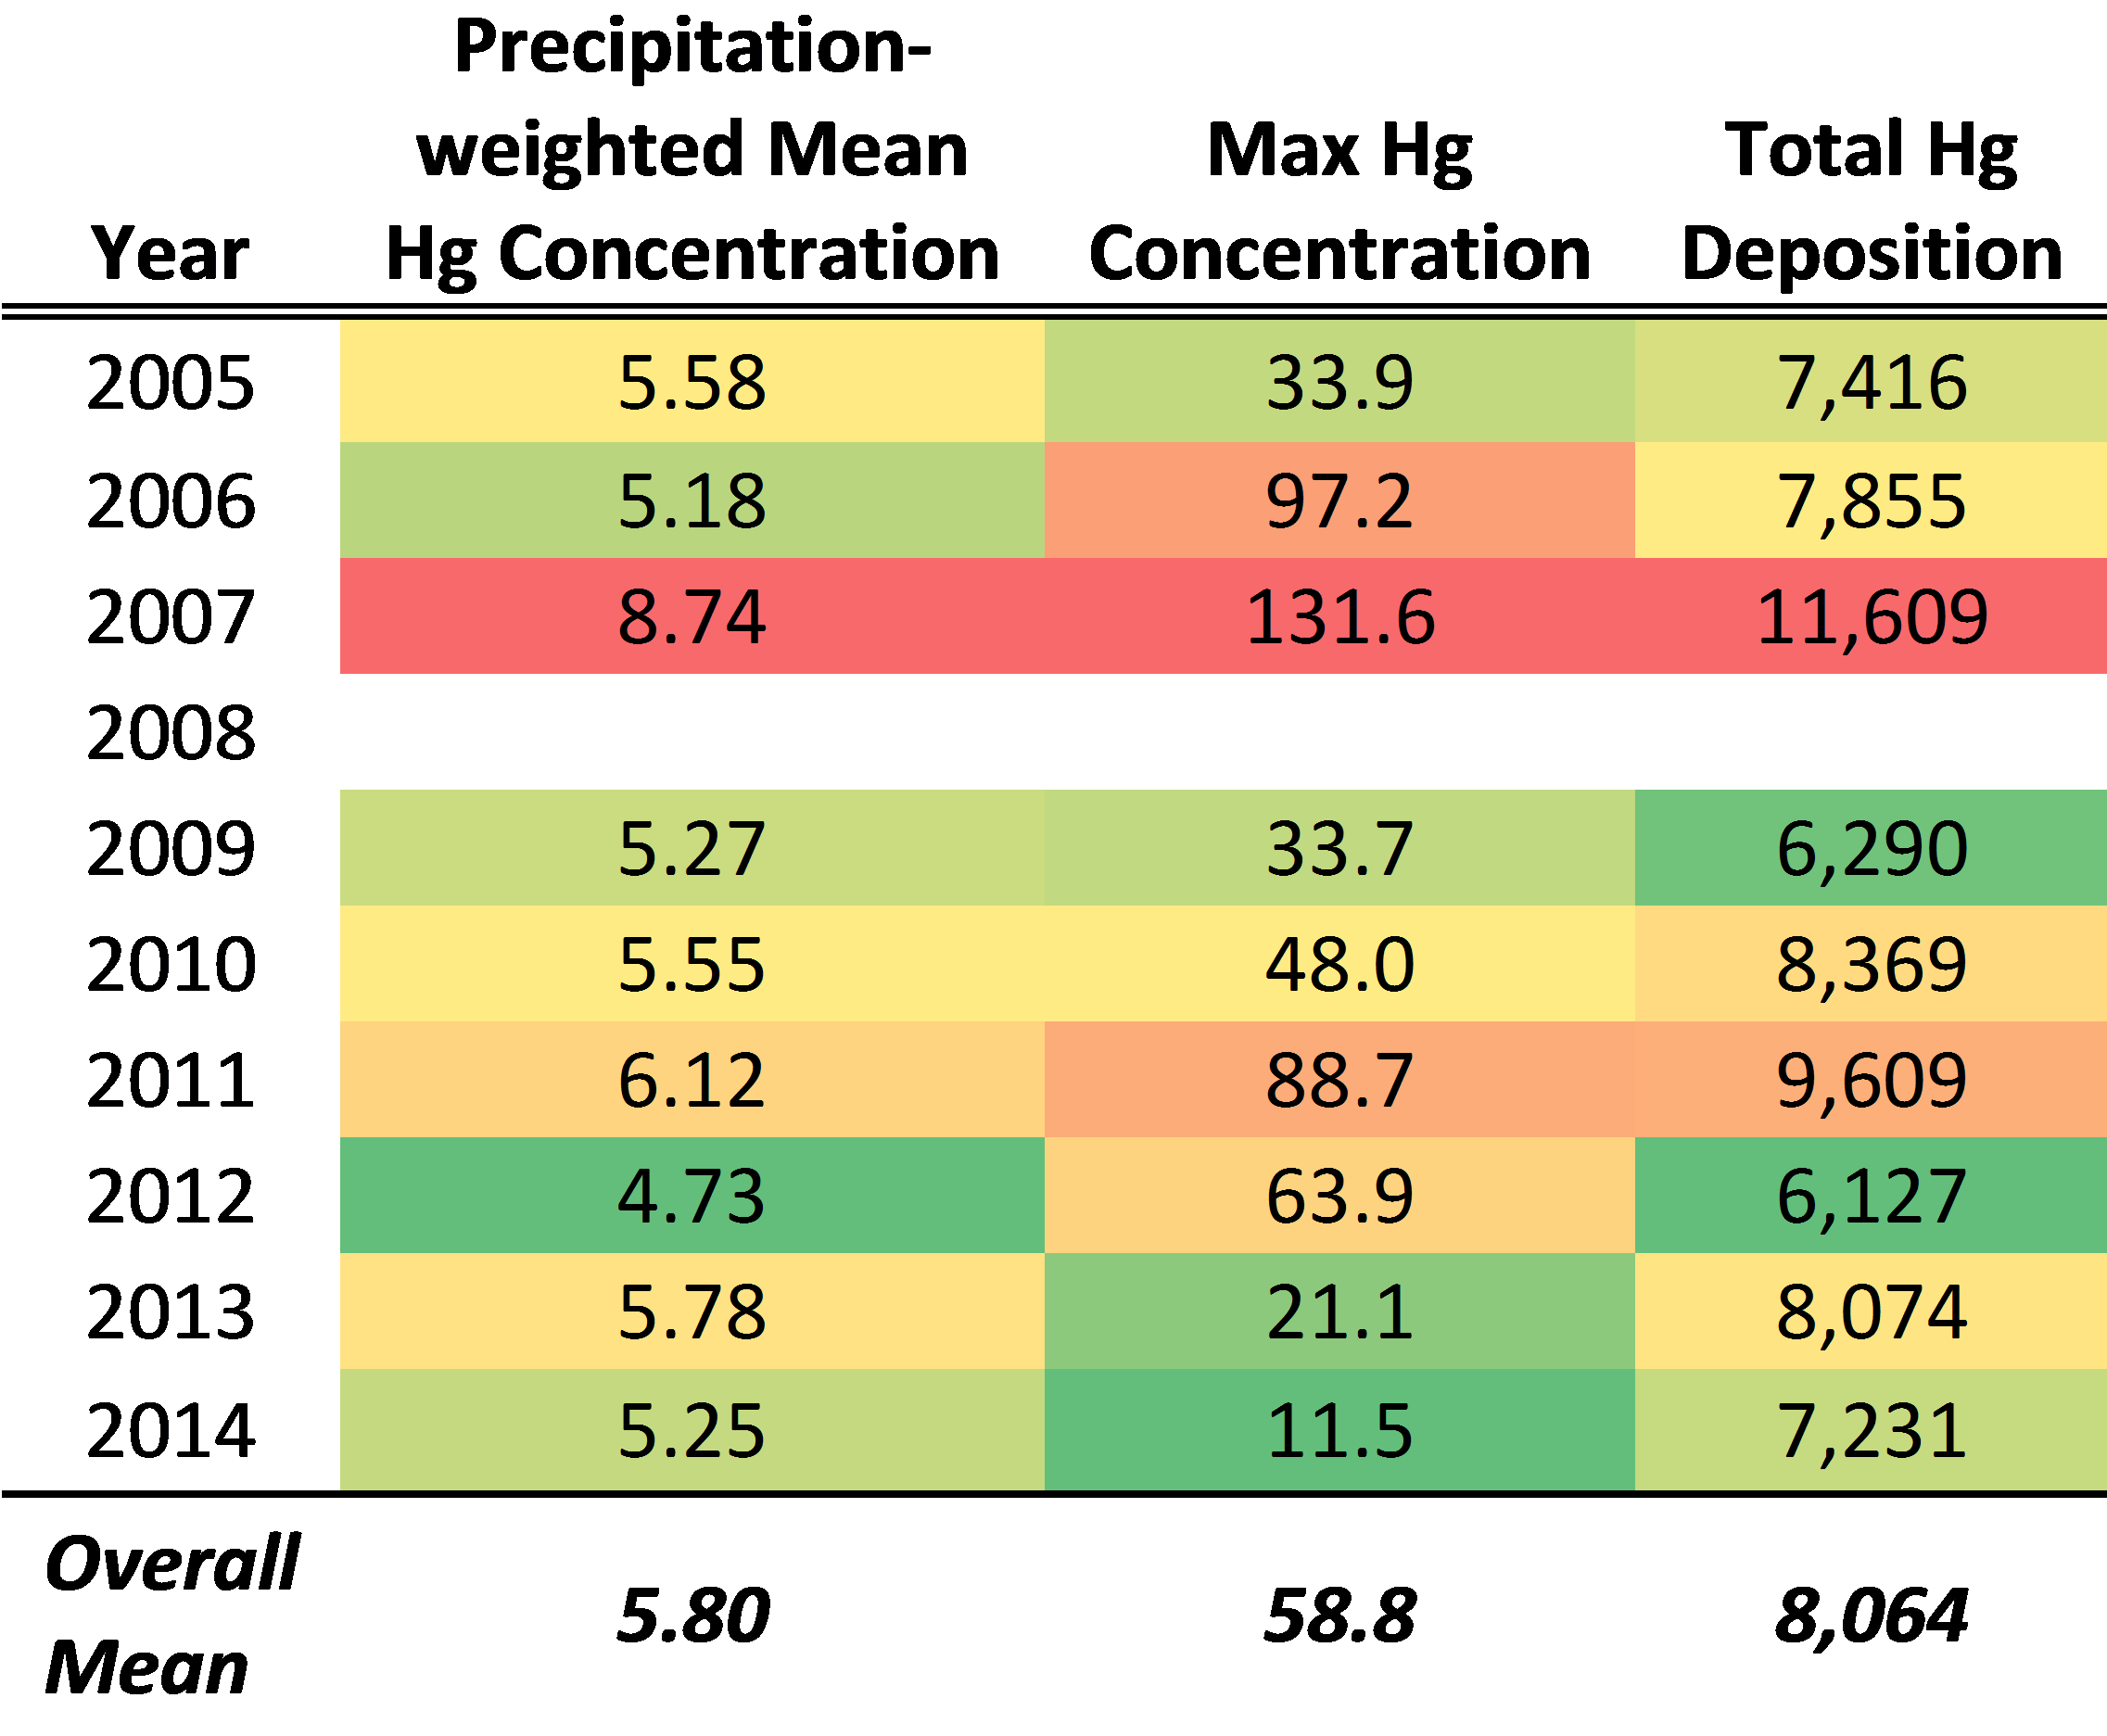
Mercury monitoring at VMC's air quality site (VT99) for 2014 shows lower deposition than on average for the 10 year record (Table 4). However, 2014 was still well above the lowest years on record (2009 and 2012). Over the entire record for VT99 total mercury deposition fluctuated from a high of 11,609 ng/m2 in 2007 to a low of 6,127 ng/m2 in 2012. Similarly, the precipitation-weighted mean mercury concentration and the maximum mercury concentrations measured at VT99 do not exhibit any clear trend, although for 2014, both were below the mean for the entire record. It is unlikely that a downward trend will appear until the hotly contested EPA rules concerning mercury are put in place.
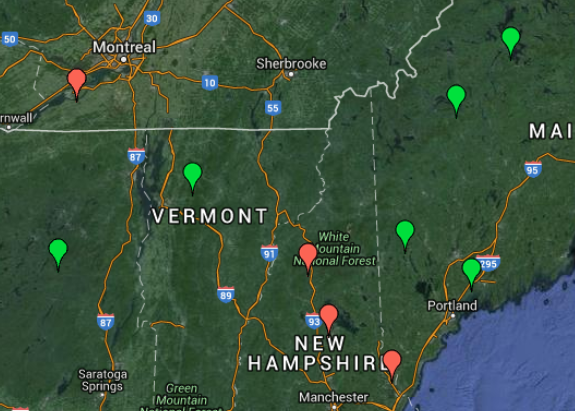
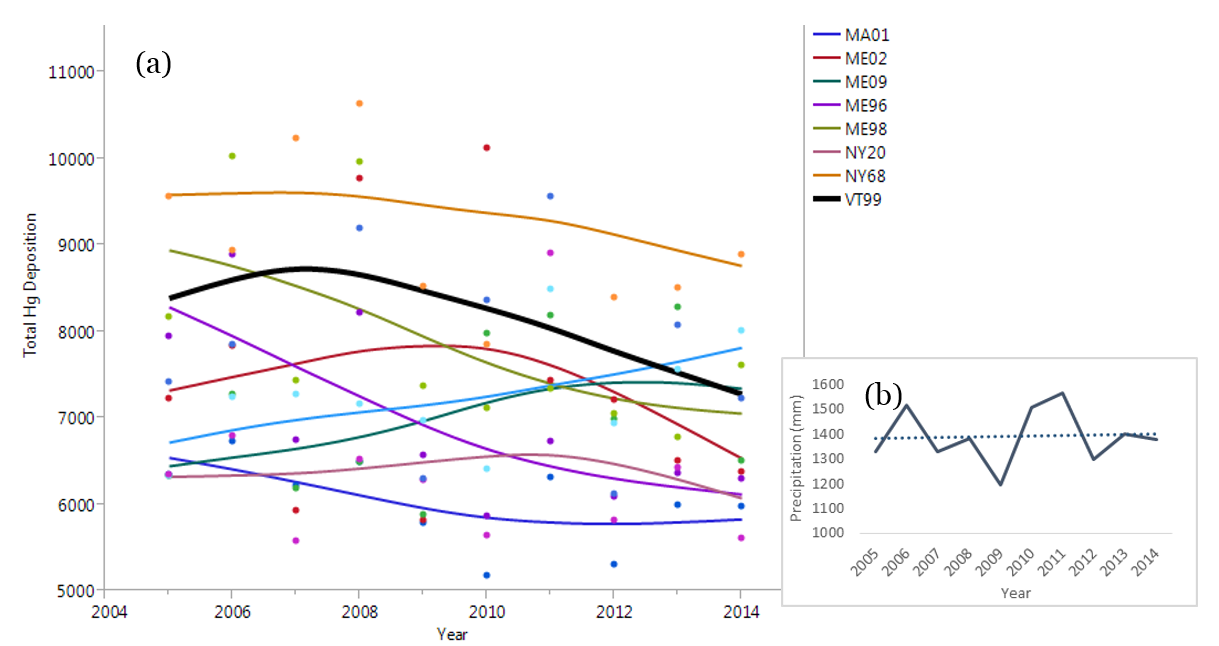
Comparison to the Regional MDN Network: Examining the total Hg deposition across the region (depicted in Figure 14), the VT99 site has reported some of the highest and lowest total deposition across the time series. This highlights the variable nature of Hg deposition and the need for continued monitoring. Perhaps more concerning is the reduction in the number of reporting sites as time has progressed. Because of funding shortfalls, four of the nine MDN sites across our region are no longer collecting data. This places additional emphasis on the remaining six sites to measure the trends in Hg deposition for our region. Also of concern is the lack of significant reductions in Hg deposition across the region.
Long Term Trends
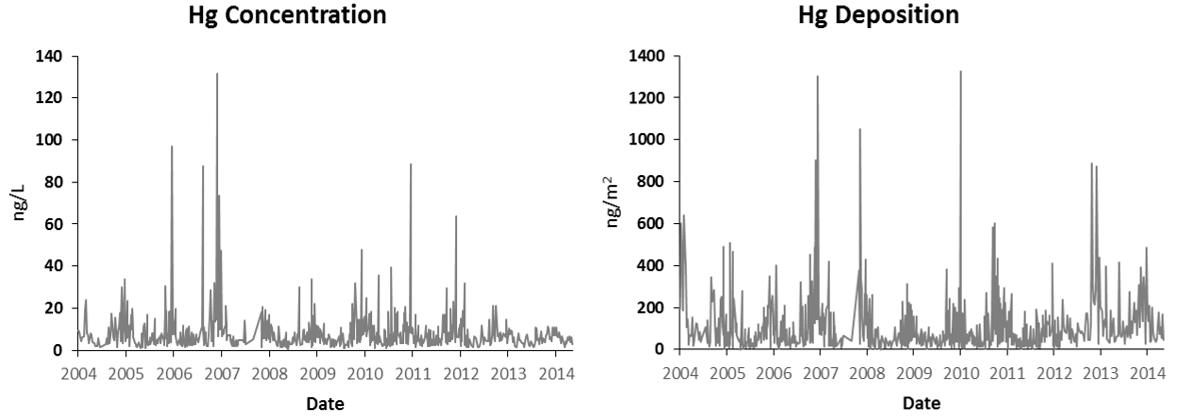
Examination of the full data record at VT99 suggests that Hg deposition has decreased from the peak deposition in the mid- 2000's, though variability remains quite high. Since Hg deposition and concentration measurements began at VT99 in 2004, there has been no statistically significant trend, either increasing or decreasing (Figure 15). While the severity of spikes in both Hg concentration and total Hg deposition are lower than measured in previous years, a higher baseline average for most precipitation events has the tendency of slightly (although not significantly) increasing deposition rates in recent years.The higher elevation of the VT99 site makes it more sensitive to regional transport events, which may partially explain why the data is so highly variable – one week receiving a regional pulse, the next week not.
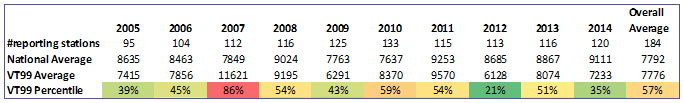
For a larger perspective, compared to the national network of MDN sites (Figure 16, Table 5), the VT99 monitoring station has fallen from the high end of measured values (2007, with higher total Hg deposition than 86% of other MDN sites) and away from low end of measured values (2012, with higher total Hg deposition than only 21% of other MDN sites). Over all the years of measurements, the VT99 site typically falls in the middle of reported Hg deposition values across the Mercury Deposition Network.
Implications
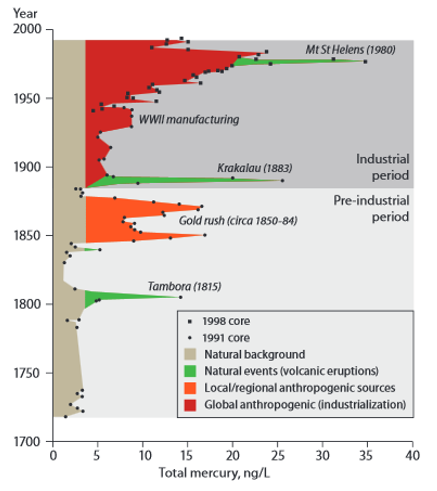
In the long term, mercury deposition levels decreased dramatically with the enactment of clean air legislation in the late 20th century (Kamman and Engstrom 2002). However, the lack of reduction policies specifically targeting mercury has led to the leveling off of deposition rates in recent years. The absence of a trend in either direction is a good sign for the health of Vermont's forested ecosystems in that there is not an increasing rate of deposition. But because mercury persists in the environment and continues to be cycled through the various storage pools (soils, air, biota) until it is essentially buried under soil, the continued low-level input and occasional spikes will likely drive cumulative increases in mercury in Vermont's forests, which are particularly sensitive to these inputs (Driscoll et al. 2007).
Planetary warming caused by climate change can lead to further complications, among them increasing temperatures that may lead to higher rates of organic productivity in aquatic ecosystems, as well as higher rates of bacterial action which can increase methylmercury production. These events, combined with the thawing of huge areas of previously frozen northern peatlands, may move previously unavailable pools of mercury into global ecosystems, highlighting the pressing need for further limits on and monitoring of mercury emissions from anthropogenic sources (Figure 17) (AMAP/UNEP 2015). The persistence of mercury in the ecosystem and the global nature of mercury pollution make eliminating anthropogenic contributions crucial to lowering concentrations in Vermont and worldwide.
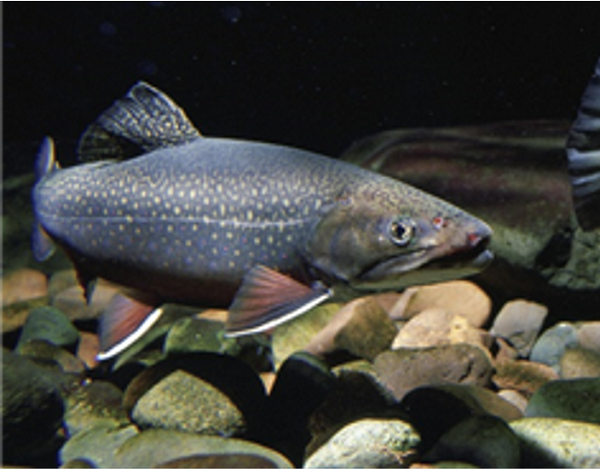
Mercury continues to arrive and build up in Vermont's forests. Several sport fish species accumulate mercury, and many states, including Vermont, have issued guidelines on the number of fish that may be safely eaten to limit mercury exposure in people.
References
- AMAP/UNEP, 2015. Global Mercury Modelling: Update of Modelling Results in the Global Mercury Assessment 2013. Arctic Monitoring and Assessment Programme, Oslo, Norway/UNEP Chemicals Branch, Geneva, Switzerland. iv + 32 pp. Available online at http://www.unep.org/chemicalsandwaste/Portals/9/Mercury/GMA%20Report/Report%20-%20Modelling%20update%20of%20the%20GMA2013.pdf.pdf
- Driscoll, C. T., Han, Y. J., Chen, C. Y., Evers, D. C., Lambert, K. F., Holsen, T. M., Munson, R. K. (2007). Mercury contamination in forest and freshwater ecosystems in the Northeastern United States. Bioscience, 57(1), 17-28. doi: 10.1641/b570106.
- Evers DC, Lane OP, Savoy L, Goodale W. 2004. Assessing the Impacts of Methylmercury on Piscivorous Wildlife Using a Wildlife Criterion Value Based on the Common Loon, 1998–2003. Gorham (ME): Maine Department of Environmental Protection, BioDiversity Research Institute. Report no. BRI 2004-05.
- Kamman NC, Engstrom DR. 2002.Historical and present fluxes of mercury to Vermont and New Hampshire lakes inferred from 210Pb dated sediment cores. Atmospheric Environment 36: 1599–1609.
- Mahaffey KR. 2005.Update on recent epidemiologic mercury studies. Pages 31–33 in Proceedings of the 2004 National Forum on Contaminants in Fish; 25–28 January 2004, San Diego, California. Report no. EPA-823-R-05-006.
- National Atmospheric Deposition Program (NADP). 2014. National Atmospheric Deposition Program 2013 Annual Summary. NADP Data Report 2014-01. Illinois State Water Survey, University of Illinois at Urbana-Champaign, IL.
- Rimmer, C.C., E.K. Miller, K.P. McFarland, R.J. Taylor, S.D. Faccio. 2010. Mercury bioaccumulation and trophic transfer in the terrestrial food web of a montane forest. Ecotoxicology 19(4):697-709. doi: 10.1007/s10646-009-0443-x.
Additional Resources
- Vermont Health Department Fish Consumption Recommendations: http://healthvermont.gov/enviro/fish_alert/documents/fish_alert.pdf
VMC Project Database Link
- Wet Deposition of Mercury at Proctor Maple Research Center (Mercury Deposition Network-MDN) https://www.uvm.edu/femc/project/wet-deposition-mercury-proctor-maple-research