Climate
The VMC Meteorological Monitoring Network
The Vermont Monitoring Cooperative (VMC) has been monitoring weather conditions in Vermont for over 20 years. VMC currently operates seven meteorological stations across a range of elevations and cover types, maintaining real-time data streams and archiving of long-term data. Weather and climate are related but very different phenomena, weather being the condition of the atmosphere (precipitation, temperature, cloud cover or humidity for example) over the short term, while climate refers to longer-term averages and expected seasonal patterns. Without long-term weather records it would be impossible to tease out yearly fluctuations from bigger climate trends, which makes this information critical to scientists and planners of all kinds. One of the complexities of climate analyses is the high degree of spatial variability. Multiple VMC stations allow for the assessment of climate trends and patterns across a broader region of VT than any single station could provide.
The Data
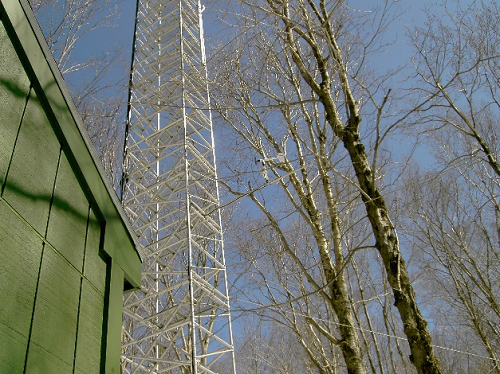
Meteorological observations are taken at seven VMC sites from Lake Champlain to Mt. Mansfield. Although the stations are not identical, variables collected include wind speed and direction, air temperature, relative humidity, barometric pressure, solar irradiance, precipitation, and at Lake Champlain stations, water temperature. These variables are logged as 15 minute data at most stations. The longest record comes from the Mt. Mansfield summit station operated by the WCAX transmitter crew and supervised by the National Weather Service, going back to 1954, predating the VMC! Other stations operated by the VMC began operation in the early to mid- 1990s, with the newest station added in 2010.
2014 in Summary
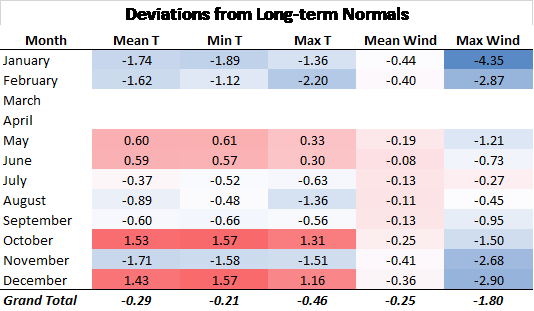
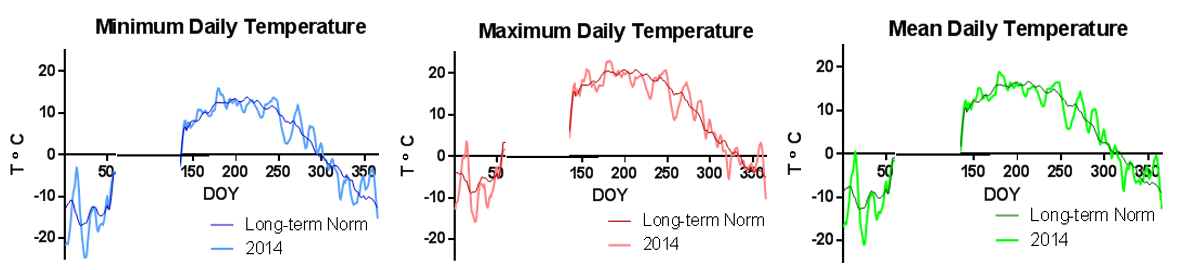
While the Mt. Mansfield West meteorological station was not operational during March and April, overall the remaining months in 2014 were only slightly above the average for temperature, compared to the long-term trends. This was primarily driven by warmer than normal temperatures in May, June, October and December, coupled with cooler than normal temperatures in February, August and November (Table 7). January temperatures were unusually dynamic with the largest daily deviations in both above and below average temperatures (Figure 19).
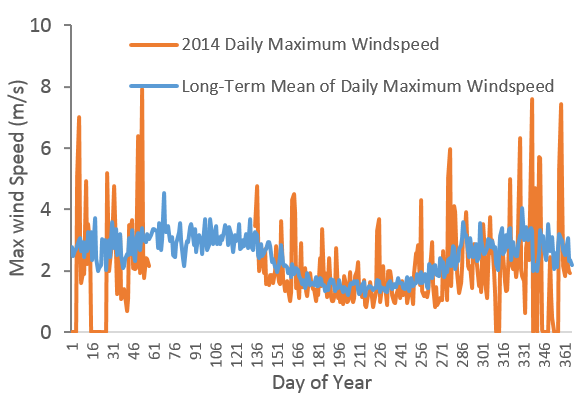
Perhaps more interesting was the increased variability in maximum wind speed over the winter and fall months of 2014. While the long-term average of maximum wind speeds is muted because not all high wind events occur on the same day each year, the increased variability and frequency of high wind events in 2014 is apparent (Figure 20).
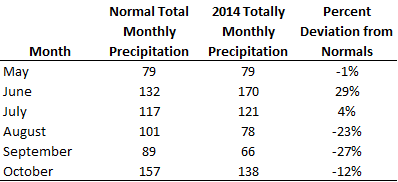
While June was a relatively wet month in 2014, it was followed by consecutive months of below average precipitation (Table 8). However, none of these deviations are significant enough for widespread forest health impacts.
Long-term Trends
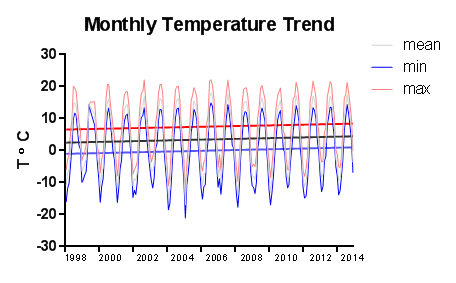
Based on the daily data between 1997 and 2014, we have seen a consistent (although not significant) rise in mean, max and min daily temperatures (Figure 21). Despite the caveat that short term datasets may not reflect long term trends, this rise is congruent with regional and national trends (IPCC, 2014; EPA 2014). The most extreme change is in daily minimum temperatures, up 3 degrees on average over this data record. Most of this increase occurs in the spring and summer on Mansfield, with July reporting the strongest (and only significant monthly) long-term increase in mean temperature (p = 0.03). The addition of 2014 data did not alter these trends, although temperatures were closer to the long term average than in 2013.
Implications
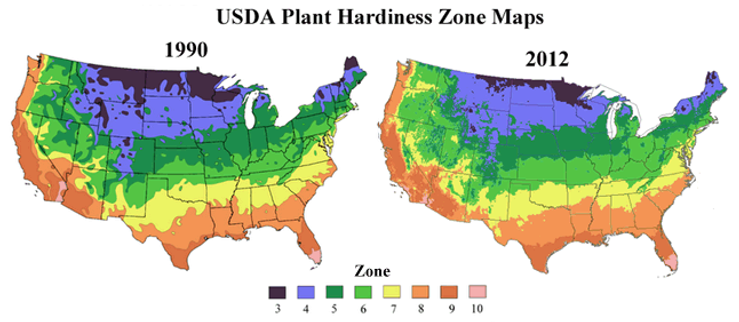
Because climate variability is high, both temporally and spatially, conditions witnessed in 2014 and the longer term trend are not necessarily indicative of a new climate regime. However, the widespread warming witnessed across the VMC meteorological network are in agreement with regional and national assessments indicating that temperatures have increased over the past several decades (Betts, 2011; EPA, 2014; IPCC, 2014). Further, the dramatic variability in winter temperatures witnessed in 2014 could represent an additional stress for species adapted to cold weather dormancy. The variable spring temperatures may eventually affect phenological adaptations, potentially increasing vulnerability to insects, diseases and spring frost injury, and may have an adverse impact on major agricultural crops in Vermont such as apples and sugar maples (Figure 22; Grubinger, 2011; Rustad, 2012).
If this trend continues, for species at either the far northern or southernmost portion of their range, climate instability could make survival challenging. Even when climate conditions remain within a species' natural tolerance, differences in competitive advantages among species due to phenological changes or erratic and unseasonable temperature fluctuations could alter ecosystem structure and function (Pucko, 2014).

While warming trends continue it is perhaps the increase in variability that may stress forested ecosystems the most.
References
- Betts, A. K. 2011. Climate Change in Vermont (unpublished report). Available online: http://www.anr.state.vt.us/anr/climatechange/Pubs/VTCCAdaptClimateChangeVTBetts.pdf
- EPA Climate Leaders Summit Report. Summit Date: Friday, November 8, 2013 Johnson & Wales University, Harborside Campus, Providence RI. Report Date: March 2014. Available online: http://www3.epa.gov/region1/climateleaderscollaboration/pdfs/ClimateLeadersSummitReport.pdf
- Grubinger, V. 2011. Climate Change and Vermont Agriculture. University of Vermont Extension. Available online: http://www.uvm.edu/vtvegandberry/factsheets/climatechange.html
- Intergovernmental Panel on Climate Change (IPCC) Climate Change 2014 Synthesis report Summary for Policymakers. IPCC, 2014: Climate Change 2014: Synthesis Report. Contribution of Working Groups I, II and III to the Fifth Assessment Report of the Intergovernmental Panel on Climate Change [Core Writing Team, R.K. Pachauri and L.A. Meyer (eds.)]. IPCC, Geneva, Switzerland, 151 pp. Available online: http://www.ipcc.ch/pdf/assessment-report/ar5/syr/AR5_SYR_FINAL_SPM.pdf
- Pucko, C. 2014. The Impacts of Multiple Anthropogenic Disturbances on the Montane Forests of the Green Mountains, Vermont, USA. University of Vermont, Department of Biology Ph.D. Thesis.
- Rustad, L. et al. 2012. Changing Climate, Changing Forests: The Impacts of Climate Change on Forests of the Northeastern United States and Eastern Canada. Gen. Tech. Rep. NRS-99. Newtown Square, PA: U.S. Department of Agriculture, Forest Service, Northern Research Station. 48 p. Available online: http://www.fs.fed.us/nrs/pubs/gtr/gtr_nrs99.pdf
Additional Resources
- Vermont State Climatologist: http://www.uvm.edu/~vtstclim/
VMC Project Database Link
- Burton Island meteorological monitoring https://www.uvm.edu/femc/CI4/data/archive/project/burton-island-meteorological-monitoring
- Colchester Reef meteorological monitoring https://www.uvm.edu/femc/CI4/data/archive/project/colchester-reef-meteorological-monitoring-38-m
- Diamond Island meteorological monitoring https://www.uvm.edu/femc/CI4/data/archive/project/diamond-island-meteorological-monitoring
- Mount Mansfield east slope mid elevation forest meteorological monitoring https://www.uvm.edu/femc/CI4/data/archive/project/mt-mansfield-east-slope-mid-elevation
- Mount Mansfield summit meteorology https://www.uvm.edu/femc/CI4/data/archive/project/mount-mansfield-summit-meteorology
- Mount Mansfield west slope mid elevation forest meteorological monitoring https://www.uvm.edu/femc/CI4/data/archive/project/mt-mansfield-west-slope-mid-elevation
- Proctor Maple Research Center meteorological monitoring https://www.uvm.edu/femc/CI4/data/archive/project/proctor-maple-research-center-meteorological-monitoring