Aerial Detection Surveys
Landscape Scale Forest Injury Assessments
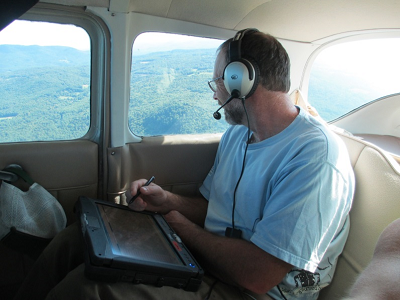
The Vermont Department of Forests, Parks, and Recreation (VT FPR) and the US Forest Service conduct aerial surveys annually to map the extent and severity of current year forest injury. This type of landscape scale assessment compliments plot-level field assessments of forest condition and has proven useful in detecting new health issues.
While more complete results of the 2014 Vermont sketch mapping effort can be found in the 2014 report on Forest Insect and Disease Conditions in Vermont (VT FPR 2014), here we provide the long-term context for understanding the severity of forest injury in 2014 and trends worth watching.
The Data
Forest health aerial surveys have been a part of Vermont's overall forest health monitoring program for about fifty years. Statewide data is collected by the VT Department of Forests, Parks, and Recreation, while the US Forest Service collects data over the Green Mountain National Forest and other federal lands.
Surveys are aligned with US Forest Service Forest Health Monitoring Program survey methods and reporting standards. In addition to maps of forest damage, polygonal delineations include information on the cause, extent, severity and type of forest damages. In most years, this includes assessments covering the entire state (over 2.5 million hectares). While aerial detection surveys have been conducted for over 50 years, for this report, we limit the long-term analyses to the period from 1995 to 2014 due to inconsistencies in earlier digital survey data.
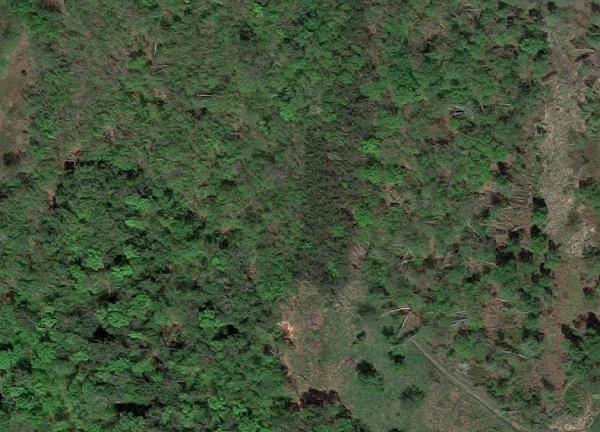
Aerial surveys provide the benefit of long-term statewide coverage. However, the user must recognize there are also limitations to the method. All data is acquired at speeds of over 100 mph and sketched onto maps. It is subject to variations due to weather, observers, and program priorities. Because subtle canopy damage is not visible from an airborne platform, it does not capture small scale disturbance or light decline from incipient stress agents.
2014 in Summary
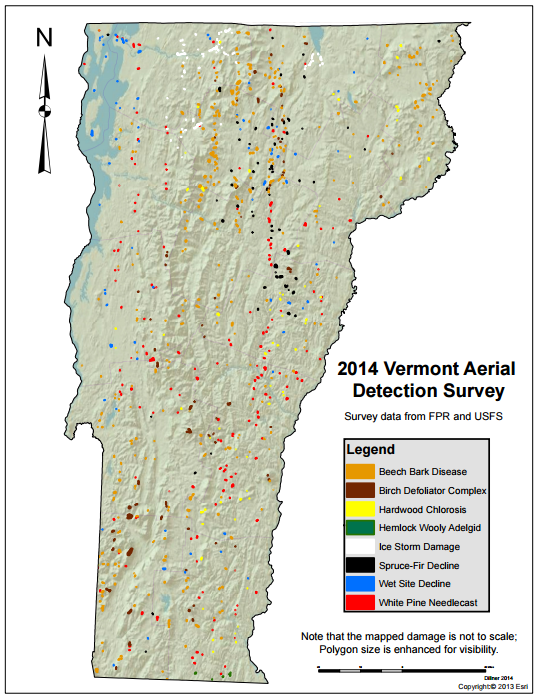
In 2014, 15,463 hectares (38,235 acres) of forest damage were mapped statewide (Figure 6, VT FPR 2014). This represents less than 1% of Vermont's forestland, and an 80% decrease from 2013.
The non-native pest complex, beech bark disease, accounted for the most area with 36% of the total area mapped. Major defoliating insects did not reach outbreak levels. Anthracnose on maple, ash, and oak and Septoria on birch plummeted from recent years, with 2,489 hectares (6,150 acres) of these diseases mapped, compared to 51,649 hectares (127,628 acres) in 2013. White pine needle diseases did remain widespread in 2014, and the extent of damage was likely much larger than the 2,012 hectares (4,972 acres) that were mapped.
Long Term Trends
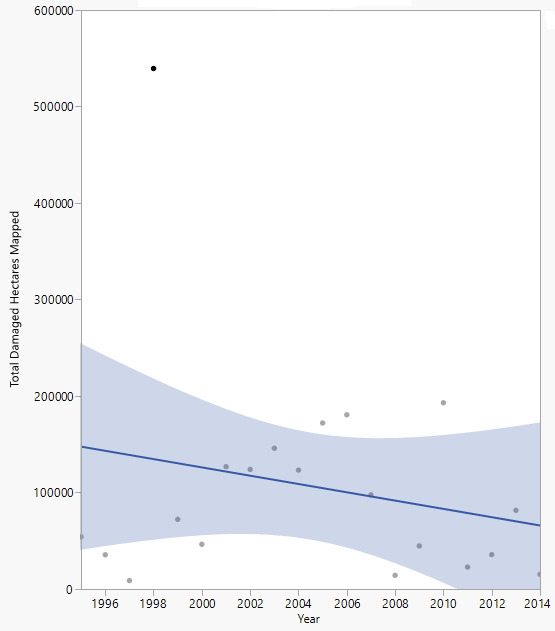
While 2014 was a relatively healthy year for most species, the temporal data set allows us to look at long-term trends and to identify the most chronic stress conditions. Summing all damage types shows substantial year to year variability (Figure 7). Since 2005, total mapped damage area has generally declined, with 2014 reporting the smallest area mapped over the 20 year period. One factor this may reflect is ample growing season precipitation over most of the past ten years. However, if the extremely high 1998 ice storm damage year is excluded the yearly surveys show a more consistent trend over time.
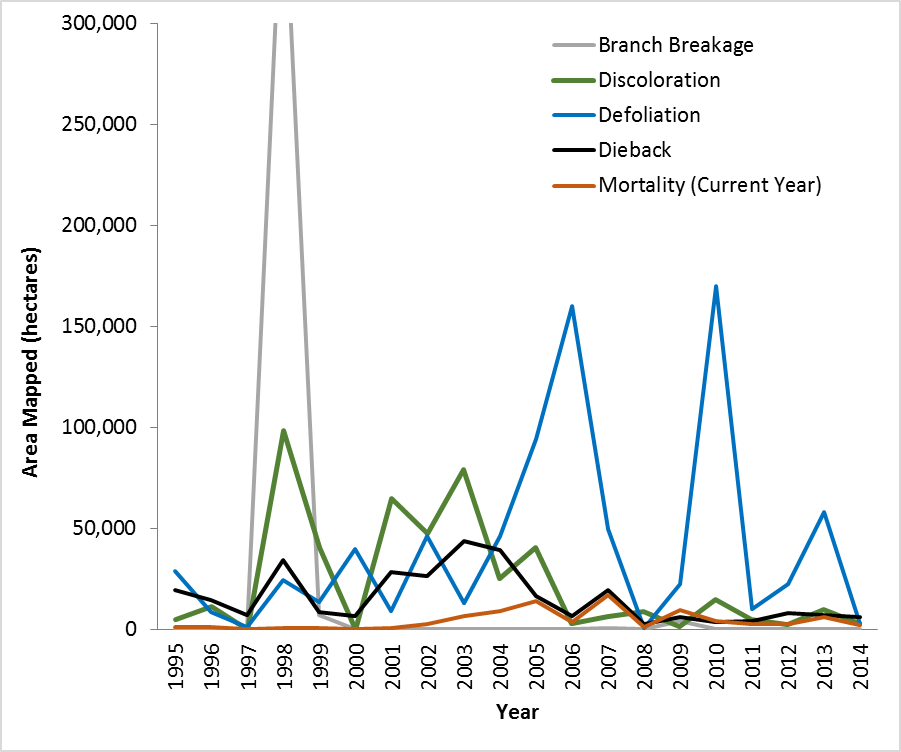
Long-term analyses of the five primary damage types recorded in the aerial survey data show that high year to year variability dominates (Figure 8). Branch breakage caused by the 1998 ice storm, was the most extensive damage type. In most other years, defoliation and discoloration were most widespread, but the agents that cause leaf damage have varied, including drought (2001), leaf fungi (2003 and 2013), forest tent caterpillar (2004-2006), and frost (2010). Dieback and mortality, the most severe damage types in terms of tree health, have been at low levels, particularly in the past five years, with dieback alone demonstrating a marginally significant decreasing trend in mapped area over the 20 year record (p = 0.07).
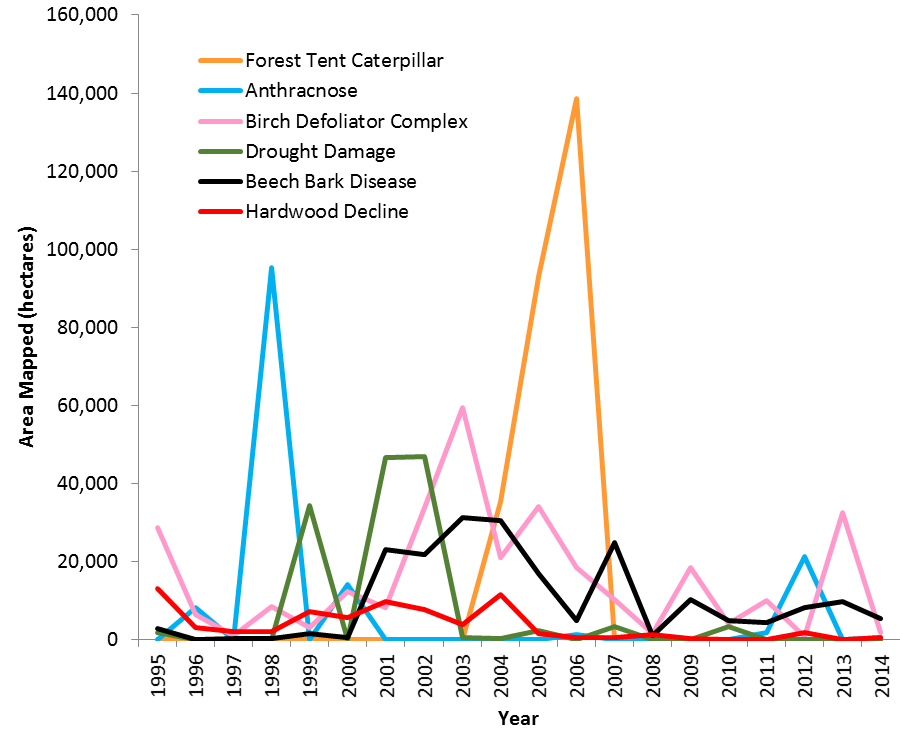
Annual fluctuations of select damage agents are shown in Figure 9. The decrease in dieback after the early 2000's when there had been a period of dry years, coincides with a decrease in drought damage, hardwood decline and beech bark disease. The incidence of beech bark disease has dropped to almost a third of its peak levels. Anthracnose and forest tent caterpillar had peak years when they caused substantial damage, while birch defoliation has continued to fluctuate.
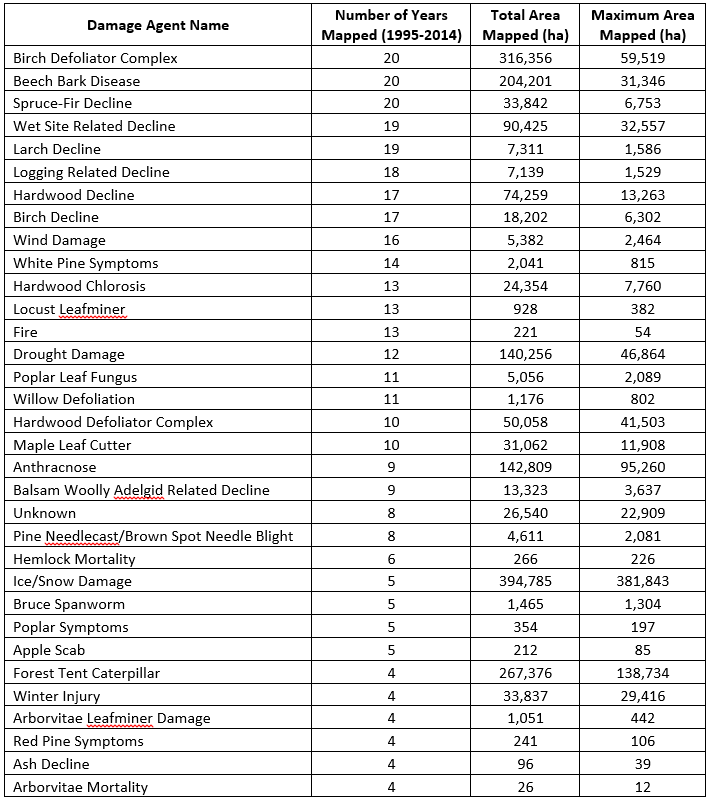
Fifty-eight different damage agents have been mapped since 1995. Table 2 shows only the 33 agents that were mapped in at least four different years during the 20 year study period. Birch defoliators, beech bark disease, and spruce-fir decline were mapped every year. Other commonly mapped damage agents include wet-site related decline, larch decline, logging-related decline, hardwood decline, and birch decline.
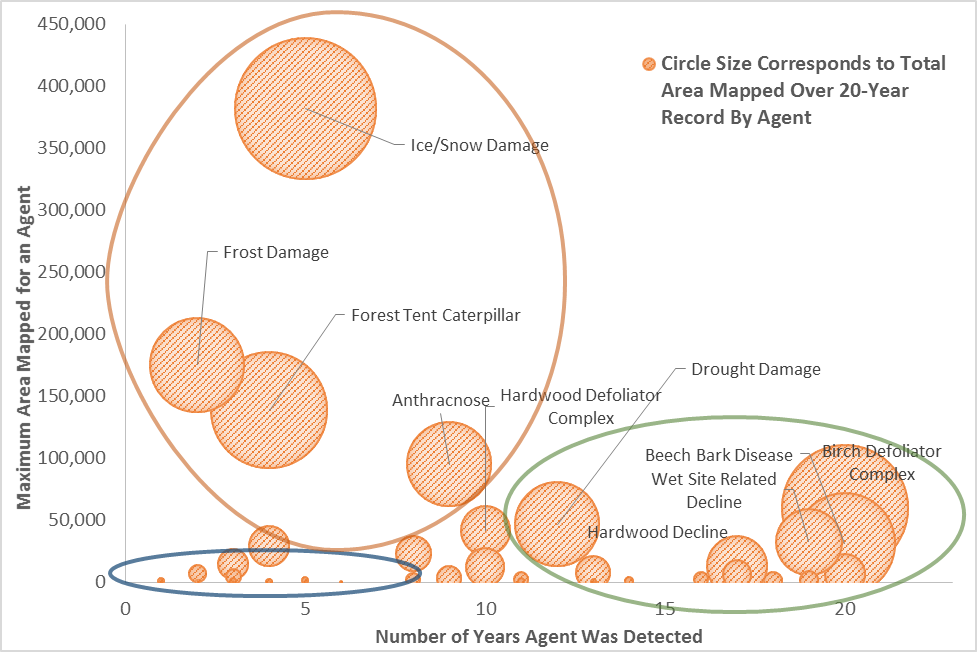
When the maximum extent of damage caused by specific damage agents is compared to number of years they were mapped, damage agents fall into three categories (Figure 10). Many cause only limited impacts; they occur infrequently and cause little damage (MINOR). Some have a locally important impact, occurring in many or most years, but rarely causing damage over a wide area (CHRONIC). Many chronic damages are related to site, as in drought, wet site, or many of the declines. Others are endemic pests, like birch defoliators and beech bark disease, that are host-specific, and cause repeated impacts only where their hosts are present and susceptible. The final group is infrequent but significant in extent of damage (EPISODIC). Some of these are directly related to weather events, like ice or frost damage. Others are biotic: insects with irruptive population cycles or fungal diseases that build up after repeated wet weather. These should be considered conceptual groups, as specific damage causing agents would be classified differently if another time period was examined.
No agents caused extensive damage on an annual basis. Several episodic stress events covering a broad area were mapped, affecting up to 20% of Vermont's forestland. Of the agents that were mapped frequently, none exceeded 3% of the state's forest in a single year. However, some of the damages may be having a significant impact on individual hosts. For example birch defoliation was mapped during each of the twenty years, affecting nearly half the birch forest type in Vermont when at its peak.
Implications
Aerial surveys provide the longest statewide annual record of stressors faced by Vermont's forests. Over the past twenty years, only limited areas of dieback and mortality and relatively low levels of total damage have been mapped. This reflects a low occurrence of moderate or severe forest decline.
Agents that repeatedly cause extensive damage would be more likely to have significant impacts on ecosystem health, as has occurred recently in the western US, where an increase in bark beetles has caused substantial conifer mortality. In Vermont, several insect, disease, or weather-caused damages were mapped over a large area, but none were widespread for more than three years. However, annual damage to individual species, such as birch and beech, are cause for concern.
Fifty-eight different causes of damage were mapped, reflecting the complexity of Vermont's forests. Many pests and abiotic events are episodic, so a number of stressors which have historically occurred in Vermont were uncommon or not detected in this twenty year period. Many have the potential to cause widespread damage and leave the state's forests vulnerable to decline and mortality should they reemerge.
Moving forward, maintenance of long-term metrics will be essential. Several invasive insects and diseases have been detected close to Vermont's borders. Under a warming climate, increases are expected in extreme weather events, such as ice storms, wind, drought, and flooding, and in defoliator outbreaks. Annual aerial surveys will provide critical information about the impact of these stressors on the forest and help inform resource management.
Visible damage symptoms are mapped on approximately five percent of Vermont's forests each year. Mapped damage area in 2014 was relatively low, but the episodic nature of the most severe damage agents and increased intensity and frequency of disturbance predicted with climate change highlight the importance of ongoing monitoring.
References
- Vermont Forest Parks and Recreation (VT FPR). 2014. Forest Insect and Disease Conditions in Vermont: 2014. Report. Available online at: http://fpr.vermont.gov/sites/fpr/files/Forest_and_Forestry/Forest_Health/Library/2014conditions.pdf.
- Dukes, J., Pontius, J., Orwig, D., Garnas, J., Rodgers, V., Brazee, N., Cooke, B., Theoharides, K., Stange, E., Harrington, R., Ehrenfeld, J., Gurevitch, J., Lerdau, M., Stinson, K., Wick, R., and M. Ayres. 2009. Responses of pests, pathogens and invasive species to climate change in the forests of Northeastern North America: What can we predict? Canadian Journal of Forest Research. 39(2): 231-248.
VMC Project Database Link
- Aerial Sketchmapping: https://www.uvm.edu/femc/project/statewide-aerial-sketchmapping-tree-defoliation-mortality
- Forest Health Monitoring: https://www.uvm.edu/femc/project/forest-health-monitoring