

trend is
up
over time
Acid rain harms forests and other ecosystems by damaging leaves and leaching nutrients.

trend is
flat
over time
The length of the growing season varies from year to year, but large or persistent changes can be problematic to forests.
trend is
up
over time
Ozone can cause many negative impacts to forests by reducing regeneration, productivity, and species diversity.

trend is
down
over time
Mercury is a toxin that persists in the environment for long periods by cycling back and forth between the air, water, soil and organisms - resulting in long-term, negative effects to forest ecosystems.
trend is
down
over time
Warmer winter minimum temperatures can allow for non-native species to proliferate, while at the same time stressing native forest trees.
trend is
down
over time
Higher maximum summer temperatures can stress forests, reducing productivity and health.
trend is
flat
over time
Changes to precipitation can alter the water balance in Vermont’s forests, causing either drought or deluge.
trend is
flat
over time
Snow insulates the soil and tree roots from cold temperatures and provides water when it melts.
trend is
flat
over time
Climate change will continue to result in more extreme weather events, which can stress forests beyond what they are accustomed.
trend is
flat
over time
Lack of sufficient precipitation can cause both immediate and long-term stress to trees.
trend is
flat
over time
As native trees are not adapted to defending themselves from non-native, invasive insects and diseases, widespread damage and mortality can result.
Latest Score:
3.6/5
in 2025
score trend is down over time
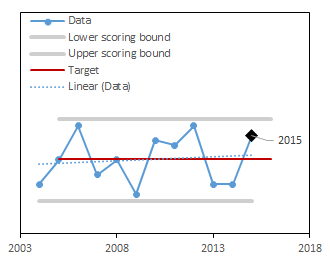
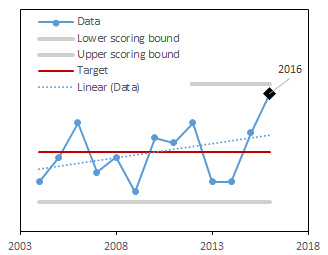
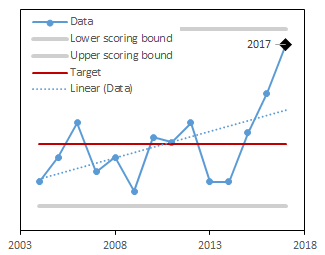
With climate change, minimum winter temperatures are projected to increase. These higher minimum temperatures stress the native forest species by moving conditions away from what they are adapted to handle. Failure to reach typical low winter temperatures can allow for non-native pests, pathogens, and plants to proliferate while stressing the native forest species by moving conditions away from what they are adapted to handle1. More frequent freeze-thaw cycles can damage tree roots and can mobilize nutrients away from forests where they are needed. Here, we assess the change in annual minimum temperature in Vermont. A high score means that the minimum temperature is close to the long-term mean.
Minimum temperatures, which generally occur overnight into early morning, are increasing more than maximum temperatures. This trend is consistent with the Northeast region and is expected to continue. Rising temperatures can alter migration of some tree species.
Additional Resources
National Climate Assessment 2014
National Climate Assessment 2018
NOAA, Northeast Regional Climate Center at Cornell University (2020)
The score is calculated using a target value and the historical range of the the entire long-term dataset. The higher the score, the closer this year's value is to the target.
Once the score is computed for each year, the trend in scores over time is calculated. If the trend is significantly positive or negative, the long-term trend is marked as increasing or decreasing respectively.
| Component | Description |
|---|---|
| Scored as | Distance away from long-term mean (scaled 1-5) |
| Target value | Long-term mean |
| Directionality of scores | No change from the long-term mean is better. |
| Minimum value used in scoring | Data minimum - 10% of range |
| Maximum value used in scoring | Data maximum + 10% of range |
The Annual Variability badge shows whether this indicator's measured values move smoothly or jump from year to year. It compares the typical squared change between consecutive years (the mean successive squared difference, MSSD) against the variation of the whole record, computed from the raw data, not the score.
Low, Medium, and High are fixed thresholds shared by every indicator. A ratio below 1 reads Low: changes between years are small relative to the record's overall variation, the signature of a smooth or steadily trending series. A ratio near 2 is what random year-to-year scatter produces. Above 2 reads High: the series see-saws, reversing direction faster than chance would. Because the ratio is unit-free, the badge is comparable across indicators with very different units. It describes year-to-year behavior and does not affect the score; indicators with short records show no badge.
Data of mean minimum annual temperature for Vermont were gathered from NOAA National Centers for Environmental Information1. We set the target for the dataset as the mean minimum temperature from1961-1990 which is used as the baseline normal for climate comparisons by the Intergovernmental Panel on Climate Change (IPCC). The current year is scored for where it falls between the target and the upper scoring bounds (maximum value in the dataset) or the lower scoring bounds (minimum value in the dataset), scaled to be between 1 and 5.
Dataset: Minimum Temperature