14 Slideshows
Packages needed:
 * devtools
 * roxygen2
By now you have seen that R Markdown is a simple step in the quest for reproducible research and literate programming; so in the words of Ron Popeil: but wait, there’s more! You can also use R Markdown to create HTML5 slide shows analogous to those created in Microsoft Powerpoint or LibreOffice Impress (don’t tell me this is the first time you’ve heard of it?). You probably won’t actually do your data analysis inside a presentation Rmd file, but once you are comfortable with the process you will be able to convert csv files to charts and tables much faster and more flexibly than with a Powerpoint presentation. Take note that much of what will occur in this chapter focuses on how to make a slideshow from R Markdown, and the implication is that you will use this process to insert plots, figures, and tables into a slideshow as well as occasionally using R Markdown to make references to values as inline code.
A slide show created with R Markdown results from the integration of multiple programming and markup languages, and the introduction of several new terms can be confusing at first. There’s a lot more to a slideshow than people think. In this way, slideshows in R are like Ogres; they have layers. Onions have layers, ogres have layers, and now slideshows in R have layers. For example, the “content layer” is specified in R Markdown, which is then automatically converted to HTML, which can be considered the “display layer”. There are a couple of parameters that the user specifies to control the overall look of the presentation, and the look of each slide; these parameters are specified using YAML (YAML Aint Markup Language; yes, the Y in YAML stands for YAML), which is a human-readable way to pass data from a human to a computer. The YAML is written at the front (top) of the document in a special metadata section, and it is also sprinkled between slides. YAML can be considered an “intermediary layer” between the content and the display. One of the parameters specified by the user via YAML is the framework, which is a “structure layer” that dictates display (specifically, it guides the interpretation of R Markdown into HTML). The framework controls things like the slide size and shape, the text size on the slide, and the transitions between slides. Most of the design formatting within the framework is done with Cascading Style Sheets (CSS); CSS is yet another metadata language that provides instruction to the web browser about how to visually render HTML, and it can control everything from text color to image animations. Aspects such as slide transitions are controlled via pre-written javascript functions. The beauty of Slidify and RStudio Presentations are that you can concentrate on the content, and for the most part all of the other layers take care of themselves.
If you plan to take the slide show to a conference, you might want to double check the conference guidelines. Many conferences only officially support Powerpoint, and in the event of a technical issue you may find yourself all alone. Luckily, the only thing you need to present an HTML5 slide show is a web browser, which every computer at the conference probably has. There are a number of pros and cons here, so lets list them:Pros
- Figures are created and displayed in a single place: no more taking and retaking screenshots!
- You want a slideshow that looks unique, but Prezi gives you vertigo.
- HTML5 is much easier to use than you probably think, and web help abounds.
- Slideshows are easily added to an existing web page.
- Native mobile browser support too.
- Displayed in browser, easy to transport
- Transitions, layouts, animations, and text formats are limitless. Kind of.
- Videos and images are easy to embed with HTML5.
- People who like data will be blown away by your multi-format integrative powers.
Cons
- Requires willingness to explore HTML and CSS.
- Some layouts are such a pain you will probably stick to simple slides (wait, maybe this is a “pro”)
- The final slideshow may depend on maintenance of directory structure to preserve images, videos, etc.
- Possibly unsupported at larger conferences.
(If you have been here before, press the back button in your browser to skip ahead)
If you fist-pumped the pros and said “baa” to the cons above, then your first decision is whether to install the development package “Slidify” from github or to use the presentation option built into RStudio. There is plenty of overlap between the two options (e.g. both allow MathJax to typeset formulas) and plenty to like about each. They are structured slightly different though, and each has strengths and weaknesses. To assist with this decision it might be helpful to see some examples of each, linked in the next paragraphs.
14.1 Slidify
Most of the examples of Slidify available on the web are created by Ramnath Vaidyanathan, professor at McGill University and creator of Slidify. Many are not just examples, but tutorials as well. Here is one on how to install Slidify, and here are samples of available frameworks (think “themes”, or powerpoint Templates). The first thing you’ll notice based on the installation slide show is that Slidify uses the Google io-2012 framework by default, which looks really slick with the black border around it, and it offers others as secondary selections. The bad news is that Slidify is a development package and is not on CRAN, and as a result it is not required to be as well documented as packages accepted by CRAN. In fact it is very well documented, but because most of the creative design takes place outside of R you will be sure to push the boundaries of what is documented as you design your slides. In the package itself there are only two commands to learn: the first is author, which creates the directories and an Rmd file for a new deck, and the second is slidify, which parses the Rmd document to markdown and then to HTML. After your slide show is made, you will notice with the io2012 framework that only the arrow keys can control the previous/next slide action–the mouse click does not. This makes a generic clicker useless to control the slideshow, and you will find yourself diving into javascript looking for tools like controldeck.js to help you (and probably failing, unless you either know a little javascript or learn really quickly).
An alternative to the io-2012 framework is Slidy. Slidy is a tool developed by Dave Raggett of W3C. Here is the example the W3C provides to demonstrate its capabilities. You’ll notice each slide looks pretty much like a web page with custom content. It can be hard to imagine your data in place of these images, so press F11 on your keyboard to go full screen when you view it so it will feel more like a slideshow. The great thing about Slidy is that it allows a variety of keyboard commands to control the slideshow, plus you can click the mouse to advance, just like with powerpoint. This will allow you to use a generic clicker to control your presentation, or a simple mobile phone app that offers mouse buttons.
You can specify extra features explicitly in the YAML metadata; such features include MathJax, which typesets math formulas in your browser.
14.2 RStudio
To begin a slide show in RStudio (don’t do this just yet):
1. select File | New File | R Presentation from the menu.
2. Navigate to a suitable location to store all content, name your slide show, and click Save. An RPres file, md file, and a directory for figures will be created.
3. The RPres file will open in the scripts window, and you can begin adding content to slides, where the slides are separated by multiple equal signs. In the Environment/History pane, a new tab will appear named Presentation, and a preview of the slide show will appear in this tab. Each time you save your slide show the presentation preview will be updated.
The default slideshow framework will be Slidy, but you can also specify the Google io-2012 framework in RStudio by setting your output in the YAML metadata section properly. Slidy is chosen as the default primarily because it renders well in the preview pane.
Many add-on features that are offered in Slidify by default must be explicitly specified in the metadata. This is also where you would specify any linked documents such as CSS style files or additional javascript files to call. RStudio’s presentation format is reasonably well described on their webpage for ioslides, Slidy, and Beamer frameworks. To avoid reiterating the RStudio website, the remainder of this chapter will focus on Slidify even though it is also documented on the web. One of the reasons we do this is because Slidify uses Rmd files rather than Rpres files, and since we are just becoming proficient in R Markdown this continuity will make our job easier.
14.3 Making slides with Slidify
The first step you need to take is to install Slidify from the Git repository, which you should do now. Either follow the instructions within this video, or use the code below (the extra libraries are a big 10MB download, so be patient).
install.packages("devtools")
library(devtools)
install_github('ramnathv/slidify',ref="dev")
install_github('ramnathv/slidifyLibraries',ref="dev")
library(slidify)
Set your working directory to a location you want your slide deck to be stored, then start your deck with the author command, which will:
* establish a directory with the name you specify and set it as your working directory
* create an index.Rmd file along with a sub-directory named “assets” which you should use to organize your slide data and store your custom layouts.
Slidify will not overwrite anything in the “assets” directory; it will instead create a different directory named “libraries” when you slidify your slideshow for the first time. You can (and should) explore the libraries directory, but you should never save files so it so that it can be automatically regenerated if necessary.
# This tilde will set your working directory to your Documents folder in Windows
setwd('~/')
# Not using RStudio:
author('testSlides',open_rmd=FALSE)
# Using RStudio: this will open the Rmd file automatically
author('testSlides')
All of your writing and design will take place in the single index.Rmd document, which you can rename to anything you would like. Open this document. At the top of the document will be the YAML metadata section familiar from standard R Markdown V2, and below that will be the slides–each separated from the last by a completely blank line (no spaces on this line!) and a line with three dashes. You write the slides with R Markdown, although the single # heading 1 class is reserved for the title slide; therefore, the largest heading you should use on your slides is the ## heading 2 class. The default Rmd document will have this already written:
---
title       :
subtitle    :
author      :
job         :
framework   : io2012        # {io2012, html5slides, shower, dzslides, ...}
highlighter : highlight.js  # {highlight.js, prettify, highlight}
hitheme     : tomorrow      #
widgets     : []            # {mathjax, quiz, bootstrap}
mode        : selfcontained # {standalone, draft}
---

## Read-And-Delete

1. Edit YAML front matter
2. Write using R Markdown
3. Use an empty line followed by three dashes to separate slides!

--- .class #id

## Slide 2
You will fill in your slide show information after the colon on each line. The top 4 lines will be automatically placed on your title slide, and the remaining lines will dictate the form and function of the slide show.
This example will walk through the Google io-2012 framework, so if it is not the default choose it as the selected framework by typing it after framework:. Note that other options are offered after a standard R comment character to the right of the colons. If you will display R code, the Google “prettify” highlighter will do a better job of displaying the R code with proper syntax highlighting than the default “highlight.js”, so replace the value after highlighter: with the word prettify. If you will display any mathematical formulas on your slides, choose the MathJax javascript “widget” by typing it inside the square braces. A widget is just a javascript applet that has been written to work perfectly within the Slidify framework. You can use multiple widgets at once by typing them all inside the square braces, separated by commas. For example, if you want some image carousels (if you want to see what this is, here is an example) in your slideshow, you can use the bootstrap widget too. You do not need to specify any widgets now, but we will work with these two later. The “mode” is how autonomous you want the final HTML to be; “selfcontained” will eliminate the dependency on the CSS files by moving the CSS into the final HTML file (as an “internal” style sheet), while “standalone” will go one step further and will embed images and will serve resources normally contained in the libraries folder (e.g. the “external” CSS style sheet as well as the javascripts) from the Google CDN of slidifyLibraries (whatever that means). Without choosing any widgets yet, your final YAML metadata will look something like this–you can just replace the default heading between the first two horizontal separators (---) with this block:
---
title       : Tauntauns
subtitle    : Imagery and Utility In Popular Culture
author      : Jonathan Katz, Therese Donovan, and Michelle Brown
job         : Information Dissemination and Outreach
framework   : io2012        # {io2012, html5slides, shower, dzslides, ...}
highlighter : prettify      # {highlight.js, prettify, highlight}
hitheme     : tomorrow      #
widgets     : []            # {mathjax, quiz, bootstrap}
mode        : selfcontained # {standalone, draft}
knit        : slidify::knit2slides
---
Now, to be sure everything is working, lets see what the slideshow looks like. The Knit HTML button in RStudio may or may not work (mine doesn’t), so move to your console and type:
After you slidify your “index.Rmd” file, an “index.md” file and an “index.html” file will be created in your “testSlides” directory. You should double click on “index.html” to open it in your default browser. From now on, the sequence of events you will use will be:
- Edit your “index.Rmd” file.
- Save your changes.
- Slidify the slide deck:
slidify('index.Rmd'). - Refresh the window in your browser containing your slideshow (or close it and reopen it).
Your best opportunity for success will be to make a slide, then slidify the deck and check to be sure it works. This will avoid the scenario in which you have made several slides but the slidify function returns an error, and you can’t identify exactly where the error is. If you think error messages in R are cryptic, you will find error messages in slidify to be useless. Using this workflow, the error will be isolated to the last slide edited, which should cut your troubleshooting to a manageable level.
In light of the many directions a presentation could go, this chapter will focus on just a few common tasks:
- Review HTML syntax rules
- Change the format of title slide
- Specify a slide layout
- Apply a background image to one or all slides
- Use MathJax
- Use and customize Bootstrap “carousels”
- Specify absolute placement of objects on the slide
- Insert a plot onto a slide
14.3.1 A quick overview of HTML syntax, and where to store your customizations
Many aspects of your slideshow - such as making lists, including images, creating links, specifying headers, and emphasizing text - can be done using standard R Markdown V2. Within R Markdown, as with standard Markdown, you have the option to include inline HTML, which you may find necessary if you want to do something Markdown doesn’t provide syntax for, such as making a two-column pros and cons list. To simply display something in a browser you don’t need to know everything about how HTML works or is written, or the difference between inline elements vs. block elements; you only need to know the bare minimum, which is how to allow the browser to interpret your text. The one rule to follow is that all HTML elements must have be both opened and closed. For example, paragraph text is opened with the tag <p>, then the text follows the opening tag, and after the text is in place the element is closed by writing the tag </p>, which you will notice is the same tag but now the element class is preceded by a slash. So a generic paragraph in an HTML file would read like this:
<p>
This text would be displayed in your browser, while the tags that open
and close it would be invisible and are strictly for the browser to know
how to display the text. They are the hyper-text marking up the text with
formatting instructions, and they form the conceptual core of "Hyper-Text
Markup Language".
</p>
If you remember this one rule, then you will be successful looking up which elements and which styles to assign each part of your inline HTML.
Now, because the slideshow is an HTML5 presentation, your only option to control fonts, font colors, tables, placement of text, and other “style” aspects is through a combination of HTML and CSS. Both Slidify and RStudio presentations come with plenty of CSS to start with, but you will undoubtedly want the ability to customize your slides. All customization you do should be saved to the proper folder within the “assets” directory. For example, any CSS files placed in “assets/css” will automatically be used, and any user-defined style classes will mask default styles with the same class name. If that made no sense to you, then let’s take a quick lesson on what a style class is by observing how to customize the title slide:

14.3.2 The title slide
The title, subtitle, author, and job field values from the YAML metadata are parsed directly onto the title slide, and there is nothing further you need to do. Unless you don’t like mint green backgrounds or you would like to include a special thank-you on the title slide. There are some easy additions you can make within the existing format, such as add a single logo slide that will precede the title slide or add a small logo above the title of the title slide. To use either of these, add the logo and/or biglogo fields to the YAML metadata, place the logo images in the “assets/img” directory, and write their names in the correct fields. You don’t need to do this now, but here is how it would look if you did:
---
title       : Tauntauns
subtitle    : Imagery and Utility In Popular Culture
author      : Jonathan Katz, Therese Donovan, and Michelle Brown
job         : Information Dissemination and Outreach
logo        : mylogo.png
biglogo     : myBigLogo.png
framework   : io2012        # {io2012, html5slides, shower, dzslides, ...}
highlighter : prettify      # {highlight.js, prettify, highlight}
hitheme     : tomorrow      #
widgets     : []            # {mathjax, quiz, bootstrap}
mode        : selfcontained # {selfcontained, standalone, draft}
knit        : slidify::knit2slides
---
If you want to actually customize the color of the title slide, you will need to learn just a little bit of CSS! Don’t start sweating yet, because believe it or not CSS is designed to make life easier than when all formatting was done with HTML. Even so, changing the title slide is not the easiest item on the list above; we are jumping in head-first with this one. Let’s take a quick look at what you may already know about css, even if you don’t know you know it.
14.3.2.1 Cascading Stlye Sheets (CSS)
In many ways, the transition across the web from HTML formatting to CSS is one that brings the principles of HTML closer to the principles of R. R is an object-oriented language: objects have values and attributes, and the combination of those values and attributes dictate the manner in which the objects are plotted, printed, and manipulated. CSS does something similar with HTML: each part of the document (web page or slideshow) is already enclosed in something like an object (HTML components are known as elements: dividers, paragraphs, images, and others–including slides!), and CSS offers a means by which we can specify formatting (attributes) for each element by pre-defining styles. A style can be applied to the all elements of a specified type (e.g. all paragraph formats: <p>), or by defining a class with specific styles that we will use occasionally, and then naming the class in the element declaration tag. If you only need a particular style once, you can define an ID for the element and then refer to the ID in your CSS style definition.
CSS styles are defined either at the top of the web page in the <style> section, in each object declaration using a style argument (e.g. <p style="text-align:center;">), or externally in text files with a css file extension. You will probably use all three methods when you prepare your own slideshow. The pre-packaged external css files are stored in a directory named “libraries/frameworks/io2012”, which is created the first time you run slidify(‘index.Rmd’).
Regardless of where they are defined, CSS styles must be defined in a specific format to be parsed correctly. The correct format is an identifying name, which is either a existing HTML tag (e.g. img, p, div, a, ul, ol), a class you are defining right now, or an ID, followed by some curly braces and one or more parameter:value pairs separated by semi-colons. Here is the generic structure:
classID {
  parameter1: value;
  parameter2: value;
}
Placing each parameter:value pair on a new line improves readability, but it is an optional format choice. In fact, if you write inline style declarations you must separate each pair with a semi-colon, but newlines are prohibited, and the ID and curly braces are unnecessary. Here is the default style for the title slide, found in “libraries/frameworks/io2012/css/slidify.css”:
.title-slide {
  background-color: #CBE7A5; /* #EDE0CF; ; #CA9F9D*/
  /* background-image:url(http://goo.gl/EpXln); */
}

.title-slide hgroup > h1{
 font-family: 'Oswald', 'Helvetica', sanserif;
}

.title-slide hgroup > h1,
.title-slide hgroup > h2 {
  color: #535E43 ;  /* ; #EF5150*/
}
What can you decipher from this? The first thing you notice is that the style for the first slide is defined with the name .title-slide. This is not a standard HTML element, so it is a CSS class applied to the first slide. To indicate this, the class name is preceded by a dot (.). Elsewhere you may also see custom CSS IDs preceded by a hash mark (#). The convention is to start a name with a dot (and hence create a class) if it will see multiple uses, and use a hash mark (and hence create an ID) if the style will only be used once. When you specify a class or ID in your slides you can omit the dot or the hash character and just use the name.
Another thing you see is that the parameter:value; pairs to specify things like background color are written using pre-defined parameter names. You can find a comprehensive list of these at the w3schools.com CSS tutorial, along with examples and a sandbox section to make sure you are using them correctly. In Slidify, the title slide is simply the product of applying the class=title-slide CSS definition to the first slide; this defines the background color (here as a hex value, but they could also be named) and specifies the format of the text (the h1 and h2 groups). Not a difficult process to imagine, and it is just as simple to perform. Even so, we can be glad it is completely automated in the package!
The last thing you should notice is that CSS comments are enclosed in /* … */ characters. These will be useful as you try new styles but want to save existing styles. Notice that a background image linked to on the web has been commented out. Background images on the title slide are not simple, as the class of the title slide rules them out. You could change the class, but for simplicity we will just change the color. Copy this section (either out of slidify.css or off this page), paste it into a new script file, change the color value, save the style sheet as “assets/css/custom.css”, and slidify your Rmd file (slidify(‘index.Rmd’)). In the example below I change the background to white:
.title-slide {
  background-color: #FFFFFF;
  /* background-color: #CBE7A5; #EDE0CF; ; #CA9F9D*/
  /* background-image:url(http://goo.gl/EpXln); */
}

.title-slide hgroup > h1{
 font-family: 'Oswald', 'Helvetica', sanserif;
}

.title-slide hgroup > h1,
.title-slide hgroup > h2 {
  color: #535E43 ;  /* ; #EF5150*/
}
If you really want to completely customize the title slide you may have to alter the layout itself, as that is where the class of the title slide is defined. Next we will learn what layouts are and how to modify them, so we will revisit the title slide shortly.
14.3.3 Specify a slide layout
The slide layout is a pre-defined format that you select and apply to as many slides as you wish. There is a default layout for the io2012 framework located in “libraries/frameworks/io2012/layouts/slide.html”. If you double-click this file it will open in a browser by default, but that is not very informative. Instead you should right-click and open it with your text editor. You will see this HTML code:
<slide class="{{ slide.class }}" id="{{ slide.id }}" style="background:{{{ slide.bg }}};">
  {{# slide.header }}
  <hgroup>
    {{{ slide.header}}}
  </hgroup>
  {{/ slide.header }}
  <article data-timings="{{ slide.dt }}">
    {{{ slide.content }}}
  </article>
  <!-- Presenter Notes -->
  {{# slide.pnotes }}
  <aside class="note" id="{{ id }}">
    <section>
      {{{ html }}}
    </section>
  </aside>
  {{/ slide.pnotes }}
</slide>
Let’s take a minute and interpret this code. What we have here is what Ramnath V. calls a “dry” whisker layout, in which standard HTML code tags are placed on the page but many arguments are not assigned values. Where values would normally be assigned, or content inserted, we instead see curly braces and variable names: {{ slide header}}. When you slidify your Rmd file, Slidify will use the whisker package to translate your R Markdown V2 formatting and content into R objects, then it will drop the objects into the proper place in the slide. It’s a slick system because it allows user modification without requiring us to write any HTML (yet).
So how to identify the slide class, ID, or background? Slidify will look for the slide variables in the slide separater bar. You should separate them with spaces, but do not place spaces within the parameter:value pairs. Here is an example that you do not need to insert into your slide deck yet:
--- class:span12 bg:url(http://goo.gl/6xnjrQ)Specifying the slide parameters is one of the most difficult parts of Slidify because there are three ways to do it, and they all use a different syntax and a different parsing algorithm. You can use the method above, and it is fairly easy; no curly braces, and parameter:value pairs are separated by spaces and hence provided without spaces after the colons. You could also use curly braces around the parameter:value pairs, but it will change the syntax and parsing; here is another example, which you do not need to use yet:
--- {class: span12, bg: "url(http://goo.gl/6xnjrQ)"}If you do it this way there must be a space between the parameter and the value (after the colon), and the parameter:value pairs are separated by a comma. Furthermore, the text value for the parameter “bg” must be quoted.
A third option is to use shortcuts written into Slidify. A shortcut exists to name the CSS ID (#), the class (.), and the layout (&), and additional parameters can be specified using the first format above. These values are placed without curly braces, separated by spaces, and without spaces inside parameter:value pairs. Here is the last example before we choose one method to use in the next section:
--- &twocol .span12 bg:whiteYou will specify layouts regularly (e.g. the slide layout can create two columns or centered images), classes on occasion (e.g. to specify preset slide margins), and IDs now and then (e.g. to specify a unique style on a single slide). Let’s look at how to create a slide with two columns, using the pre-packaged twocol.html layout.
14.3.3.1 Two column layout
To call in this layout for a slide, we can use the ampersand character and name the layout in the slide separator. Slidify will look for the layout in your “assets/layouts” directory, and if it doesn’t find it there it will look in the “libraries” directory. Your slide separator for a slide in which you want two columns will look like this (just another example, don’t use it yet):
--- &twocolIf you right-click on the file “libraries/frameworks/io2012/layouts/twocol.html” and open this layout with an editor, you will see this:
---
layout: slide
---
{{{ slide.content }}}
<div style='float:left;width:48%;' class='centered'>
  {{{ slide.left.html }}}
</div>
<div style='float:right;width:48%;'>
  {{{ slide.right.html }}}
</div>
What we learn from viewing the code for the layout is that Slidify will import the layout for a default slide, and it will insert some slide content at the top with two columns of additional content below.
To specify the left and right content we use a blank line followed by a line with three stars as a separator, followed by a side identifier. Go ahead and delete everything in your slide deck after the YAML metadata, including the horizontal rule at the bottom of it, and copy thge following into your slide deck as the first slide:
--- &twocol

## Put your header here
And maybe a line of description, or a plot you want to appear above the columns

*** =left
### This will be the left header
* this is a list on the left
* second item in the list

*** =right
### This will be the right header
you could place a descriptive image on the right
Now save the deck, slidify it, and refresh the webpage with the slide show. You should see something like this:

14.3.3.2 Centered content layout
The default slide layout left-justifies text, but maybe you want (horizontally and vertically) centered images or text on a couple of slides. To do this you would use the vcenter layout. Copy the following block and paste it below the first slide in your deck, so this will become the second slide:
--- &vcenter
## This heading will not be centered...
but any additional text will be.
Now save the deck, slidify it, and refresh your browser window. You should see this:

If you have an image to center, your slide could look like this:
--- &vcenter
## Tauntauns in popular culture
Copy the block above and paste it into your slide deck, save it, slidify it, and refresh your webpage. You should see this:

These are the three included layouts. It is easy to modify them to add custom aspects, so let’s customize them with some useful modifications.
14.3.4 Adding a slide background color or image
To learn a little more about layouts, let’s modify the slide.html layout and apply it to all of our slides. The default io2012 background appears white, but look closely and you’ll notice it has a gentle gray-gradient at the bottom. I like to place my plots and tables below text or code on the slide, and the result is that you can see the edge of the white box of the plot where it overlays the gradient. Copy the slide.html file to your “assets/layouts/” directory, then at the top replace style="background:{{{ slide.bg }}};" with style="background:white;". Save it. That’s it! Now you have a custom slide background that will be used on every slide, unless you specify a different layout in the slide divider. Because your copy of slide.html is in your “assets/layouts” directory it will override the original, even though the original is still intact. The “libraries” directory will also be regenerated by Slidify on occasion, so storing your layouts in the “assets” directory protects them from loss.
What if we now want to specify a backgound image for a single slide? We have removed the option to place one-off images on the default slide background, because we fixed them all as white. We are creative, so I’m sure you agree we can still do it! Re-open the original “libraries/frameworks/io2012/layouts/slide.html” file and save another copy to your “assets/layouts” directory with a new name such as “slidebg.html”. The name indicates we want to use this one when specifying a picture background. Now when we want to call it up for a slide, we specify it in the separator bar using the ampersand character, and we specify the value to substitute for the “bg” variable. Copy the following empty slide and paste it into your slide deck:
--- &slidebg bg:url(http://goo.gl/yJFbG4)Save. Slidify. Refresh.

Notice this image doesn’t fit perfectly in the background. The photo is smaller than the slide, and the default handling for this situation is to repeat the background until full coverage is achieved. That is not what I want–I want a single image resized and cropped to fit. Using the online CSS tutorial, I see I can specify the background-size, which I can do directly in my slide header as long as I use proper CSS formatting (omitting any spaces for syntactically correct YAML). Edit the slide metadata so it looks like this:
--- &slidebg bg:url(http://goo.gl/yJFbG4);background-size:coverSave. Slidify. Refresh.

At this point we’ve covered how to make the most of the default layouts, how to customize them, and how to specify background images. Much of learning the finer points will involve some trial and error on your part, particularly as you build custom layouts.
Earlier we said we would revisit the layout of the title slide. You can find this layout at “libraries/frameworks/io2012/partials/titleslide.html”. Opening this file in a text editor you should see this:
<slide class="title-slide segue nobackground">
  {{# page.logo }}
  <aside class="gdbar">
    <img src="{{page.url.assets}}/img/{{{ page.logo }}}">
  </aside>
  {{/ page.logo }}
  <hgroup class="auto-fadein">
    <h1>{{ page.title }}</h1>
    <h2>{{ page.subtitle }}</h2>
    <p>{{ page.author }}<br/>{{ page.job }}</p>
  </hgroup>
  {{# page.github }}
    <a href="https://github.com/{{user}}/{{repo}}/zipball/gh-pages" class="example">
     Download
    </a>
  {{/ page.github }}
  <article></article>
  {{# page.license }}
  <footer class = 'license'>
    <a href='http://creativecommons.org/licenses/{{{ page.license }}}/3.0/'>
    <img width = '80px' src = 'http://mirrors.creativecommons.org/presskit/buttons/88x31/png/{{{ page.license }}}.png'>
    </a>
  </footer>
  {{/ page.license }}
</slide>
The first line opens a <slide> element, and the class of the slide is defined as “title-slide segue nobackground”. Each of these classes are included separately, even though they are on the same line. So the title slide is really using styles from the classes .title-slide and .segue., and the nobackground definition is defined in the stylesheet (“libraries/frameworks/io2012/css/default.css”) only where this class is absent! It is a complicated system to jump into, and we won’t go farther than this. However, using what you have learned so far you should feel safe exploring and learning more about how to customize your title slide through trial and error.
14.3.5 Using MathJax
Many math departments suggest homeworks and theses be written in LaTeX because it looks really great and has fantastic facilities for typesetting formulas. Slidify and RStudio implement a cool widget named MathJax that will take formulas written in LaTeX, send them off to a server, have the server typeset the formula with the proper fonts and font sizes, and then it sends the typesetting metadata back to be used in the slide. This process typically takes a second or two each time the slides are opened or refreshed. If you happen to be without internet access, some typesetting is still done locally, but it will probably not be as cool looking as if the server did it.
Right now you are probably still thinking about how MathJax reads formulas written in LaTeX. LaTeX. LaTeX. Worry not! Writing a formula in LaTeX is certainly no more difficult than writing it in Powerpoint with the equation tool, provided you have access to a good instruction manual. If you can scroll a web page then you can typeset a formula in LaTeX. There are only two things you need to do to make sure your formulas are properly formatted.
First, you need to be sure to select MathJax as one of your widgets in the YAML metadata, by typing it into the braces. When you do this, the next time you slidify the document Slidify will copy the javascript that runs MathJax from slidifyLibraries to your “library/widgets” directory. This partially explains why slidifyLibraries is so bulky!
The second thing you need to do is identify the places you want math typesetting to occur. R Markdown and Slidify use the same shortcut as TeX or LaTeX to declare a math environment: a pair of dollar signs ($$) to open the math environment and another pair to end it, or enclose it in slash-brackets (\[ … \]). If you want to write a simple formula in your first slide and have it typeset by MathJax, and you want it centered in the slide, your YAML metadata and first slide would look like this:
---
title       : Tauntauns
subtitle    : Imagery and Utility In Popular Culture
author      : Jonathan Katz, Therese Donovan, and Michelle Brown
job         : Information Dissemination and Outreach
framework   : io2012        # {io2012, html5slides, shower, dzslides, ...}
highlighter : prettify      # {highlight.js, prettify, highlight}
hitheme     : tomorrow      #
widgets     : [mathjax]            # {mathjax, quiz, bootstrap}
mode        : selfcontained # {selfcontained, standalone, draft}
knit        : slidify::knit2slides
--- &vcenter

## This is a linear relationship
$$ y = \beta_1x + \beta_0 $$
Save. Slidify. Refresh.

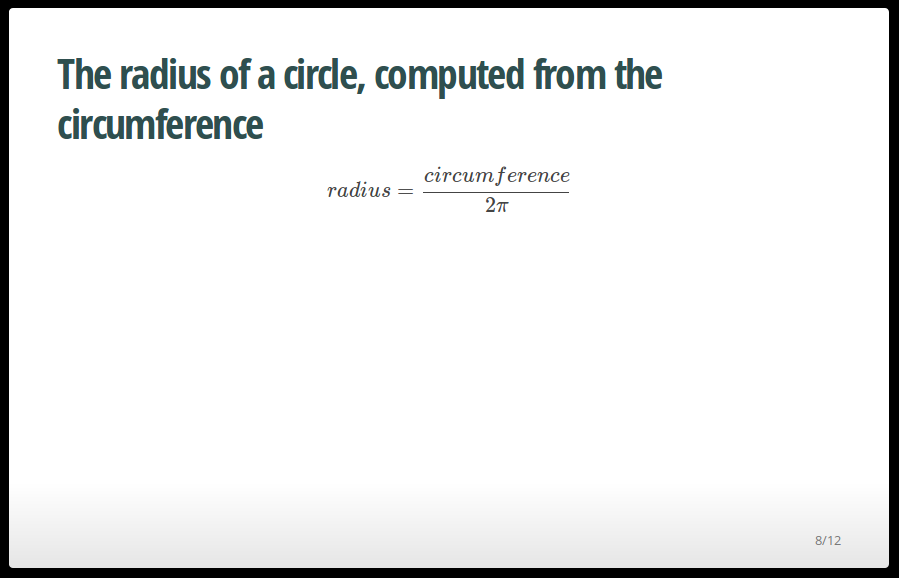
Look at the WikiBook linked above, and try writing the formula to compute the radius of a circle given the circumference on a slide.
Did you do it?
Don’t peek ahead until you have given it a shot.
You should have something like this on your slide:
---
## The radius of a circle, computed from the circumference

\[ radius = \frac{circumference}{2\pi} \]
Save. Slidify. Refresh.
Take note that in a math environment spaces are automatically inserted around each operator in the final product, but all spaces inserted by you, the user, are ignored. If you have a short phrase to insert into your equation, you can do it by either using the \text environment or by specifying each space with a special space character such as a slash-semi-colon (\;):
---
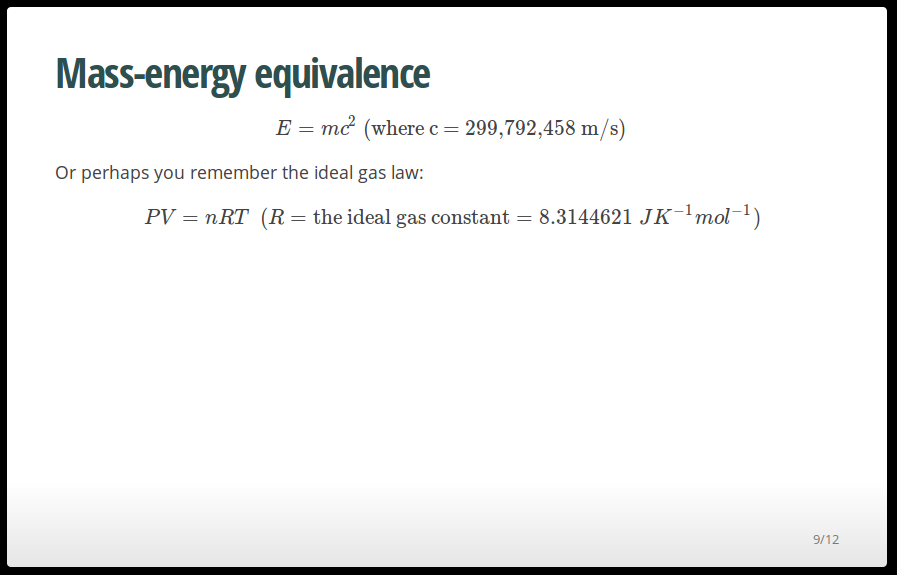
## Mass-energy equivalence
$$E=mc^2\text{ (where c = 299,792,458 m/s)}$$
Or perhaps you remember the ideal gas law:
\[ PV=nRT \;\; (R = \text{the ideal gas constant} = 8.3144621 \; JK^{-1}mol^{-1}) \]Save. Slidify. Refresh.
Note that the wikibook page recommends the LaTeX slash-bracket over the TeX dollar sign to indicate the math environment.
Another widget available is bootstrap, which can be used to produce image carousels that automatically cycle on a timer. These aren’t as handy as they sound, but for some reason I don’t stop trying to use them as a presentation tool. I usually disable the cycling so I can time the advances manually to synchronize with my oratorial remarks.
14.3.6 Bootstrap widget for cycling images on a slide
There are some creative-but-complex ways to incorporate bootstrap slideshows into each slide, but fortunately Ramnath has since built in a really simple system that uses the same syntax as defining multi-columns slides.
The first step is to include the bootstrap widget into your YAML metadata, possibly alongside MathJax:
---
title       : Tauntauns
subtitle    : Imagery and Utility In Popular Culture
author      : Jonathan Katz, Therese Donovan, and Michelle Brown
job         : Information Dissemination and Outreach
framework   : io2012        # {io2012, html5slides, shower, dzslides, ...}
highlighter : prettify      # {highlight.js, prettify, highlight}
hitheme     : tomorrow      #
widgets     : [mathjax, bootstrap]            # {mathjax, quiz, bootstrap}
mode        : selfcontained # {selfcontained, standalone, draft}
knit        : slidify::knit2slides
---
The next time you slidify your slide deck, slidify will copy the required javascript from slidifyLibraries to “libraries/widgets”.
There is no default carousel layout, but Ramnath has one in an example slideshow that works well. You need to copy the layout and save it to “assets/layouts/carousel.html”:
---
layout: slide
---
{{{ slide.content }}}
<div id="{{slide.id}}-carousel" class="carousel slide {{slide.class}}">
<!-- Indicators -->
<ol class="carousel-indicators">
{{# slide.blocks }}
<li data-target="#{{slide.id}}-carousel" data-slide-to="{{num}}" class="{{class}}"></li>
{{/ slide.blocks }}
</ol>
<!-- Wrapper for slides -->
<div class="carousel-inner">
{{# slide.blocks }}
<div class="item {{class}}">
<img src="{{img}}" alt="{{alt}}">
<div class="carousel-caption">{{{ content }}}</div>
</div>
{{/ slide.blocks }}
</div>
<!-- Controls -->
<a class="left carousel-control" href="#{{slide.id}}-carousel" data-slide="prev">‹</a>
<a class="right carousel-control" href="#{{slide.id}}-carousel" data-slide="next">›</a>
</div>
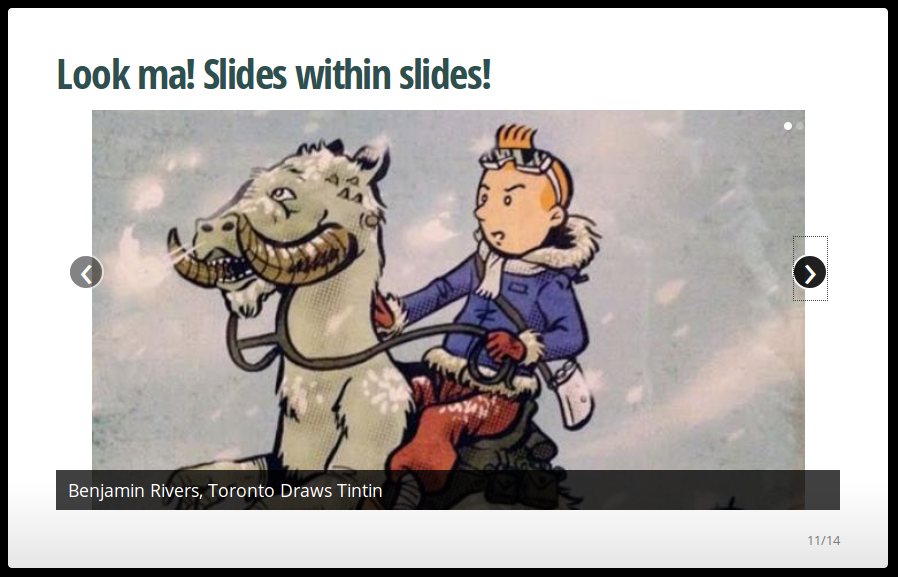
To add content to your bootstrap slideshow you will need to call the carousel layout in the slide separator and specify that the first image will be of class:active while subsequent images will have no class assigned. Then you use the three-stars familiar from the twocol layout and an img tag. Copy the following to your slide deck:
--- &carousel
## Look ma! Slides within slides!

*** {class: active, img: "http://goo.gl/kcRF4e"}
Bruce Lowell http://bruce.kus-numa.net/

*** {img: "http://goo.gl/GwVFOh"}
Obama Wins! http://southpark.wikia.com

*** {img: "http://goo.gl/5LfD62"}
Benjamin Rivers, Toronto Draws Tintin

*** {img: "http://goo.gl/yJFbG4", alt=""}
Something, Something, Something, Dark Side http://familyguy.wikia.com/

---
Save. Slidify. Refresh.

Clicking the control arrow will start the carousel cycling. You can manually advance it, or it will auto-advance every 5 seconds.

The parsing of the image separator parameters is the same as the parsing of slide separators, so you need to pay attention to spaces, commas, and quotation marks. The text below each image source will become the caption; if you want no caption, be sure to leave a blank line where the caption would be and another blank line to separate the images. For some self-directed practice you can try to edit the layout of “assets/layouts/carousel.html” and see if you can disable the caption display, or change its style.
If you are trying this on your own and the image sizes look slightly different, then you can probably guess I have already monkeyed with the css style for my images. I did it as inline style definitions within my layout, and I set the max and min height value to 500px to automatically scale my images to fit the height of the box, like this:
---
layout: slide
---
{{{ slide.content }}}
<div id="{{slide.id}}-carousel" class="carousel slide {{slide.class}}">
<!-- Indicators -->
<ol class="carousel-indicators">
{{# slide.blocks }}
<li data-target="#{{slide.id}}-carousel" data-slide-to="{{num}}" class="{{class}}"></li>
{{/ slide.blocks }}
</ol>
<!-- Wrapper for slides -->
<div class="carousel-inner">
{{# slide.blocks }}
<div class="item {{class}}">
<img src="{{img}}" alt="{{alt}}" style="margin: auto; max-height: 500px; min-height: 500px;">
<div class="carousel-caption">{{{ content }}}</div>
</div>
{{/ slide.blocks }}
</div>
<!-- Controls -->
<a class="left carousel-control" href="#{{slide.id}}-carousel" data-slide="prev">‹</a>
<a class="right carousel-control" href="#{{slide.id}}-carousel" data-slide="next">›</a>
</div>
You could make this change too and save, slidify, and refresh to see if it works for you.
Notice with the layouts above you could change the img tag in the layout to something like an inline-frame tag, which would allow you place additional html pages into the carousel–which could be R Markdown pages with plots, for example. Carousels have a lot of potential, but the disadvantage is that you need to start them running with a click of the mouse on the right arrow, and that takes your focus off the audience when you present. The other disadvantage is that they cycle on a timer, so if you want to turn that function off just delete or comment out line 1713 of “libraries/widgets/bootstrap/js/bootstrap.js” – the line that reads else if (options.interval) data.cycle(). It is not a great solution, but it seems to work.
14.3.7 Specifying absolute location on the slide for text or images
Up until now, we have accepted that everything we type and every image we insert will be either left-justified or centered on the slide. While this may be fine some of the time, there are plenty of times when you just want to place a little caption or reference in the bottom corner, or you want to place a small banner of images across the bottom of an acknowledgement slide. To do this you don’t want to add the HTML equivalent of a bunch of returns; instead, you identify the location of the object relative to the top or side of the slide. This can be very precise, and you can allow images and text to overlap, but you will need to be comfortable writing the tiniest bit of HTML code to get it to work.
The general outline of what to do is this:
1. Place each item in its own <div> container.
2. Specify the location of the <div> container.
3. Optional: specify the z-index, or layer number, of the <div> container.
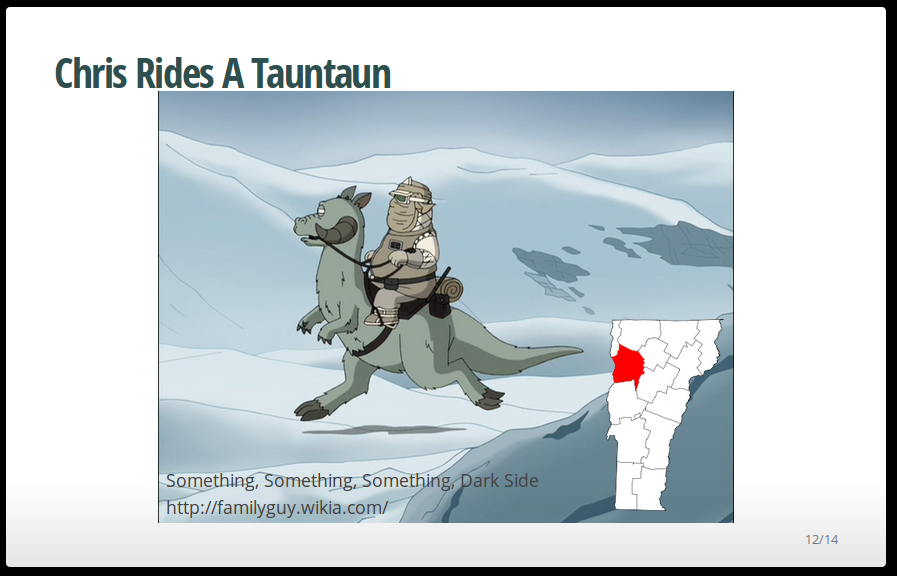
Imagine this scenario. I pulled a GPL v2 licensed photo off Wikipedia, and I want to include it in my slideshow, and I want to attribute the photographer discretely at the bottom of the photo. I also will include another image of a map as a small inset to the main photo. The first thing I do is place the main image, then the text, and finally the inset. I will place the main image using standard markdown image placement, then I’ll use HTML to place the rest of the slide content. The HTML will specify the position and z-index as an inline CSS style. The z-index component is easy: if unspecified, the last item placed will be on top. If specified, larger z-index values will be on top. If specified z-indices and unspecified z-indices are used, specified z-indices are placed on top of unspecified z-indices. Copy the following block to your slide deck:
--- &vcenter
## Chris Rides A Tauntaun

<div style="position: absolute; left: 200px; top:575px; z-index:10">
<p>Something, Something, Something, Dark Side<br>http://familyguy.wikia.com/</p>
</div>
<div style="position: absolute; left: 750px; top: 390px; z-index:100">
<img src="http://goo.gl/2nLPLz" alt="">
</div>
---Save. Slidify. Refresh.
Specifying the position of each <div> is tedious, so my recommendation is to keep your slides simple. Simple slideshows will look more professional and sophisticated, and that is why you chose Slidify anyway, is it not?
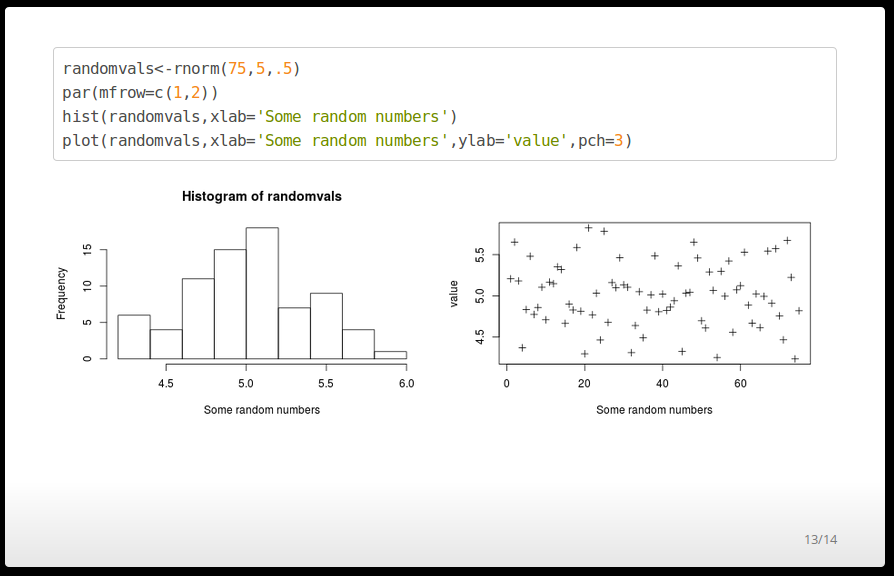
14.3.8 Inserting plots into your slideshow
Inserting plots into a slideshow is identical to inserting them into any other HTML document from R Markdown V2. You can specify the plot size in inches, the alignment (left, center or right), and the displayed width. With these combinations of parameters it should be possible to produce any font size or plot layout imaginable*. Copy this next block into your slide deck:
    ``` `{r fig.width=12,fig.height=3,fig.align="center",out.width="1100px"}
    randomvals<-rnorm(75,5,.5)
    par(mfrow=c(1,2))
    hist(randomvals,xlab='Some random numbers')
    plot(randomvals,xlab='Some random numbers',ylab='value',pch=3)
    ` ```
Save. Slidify. Refresh.
 *I can’t get the layout() function to work, so that actually rules out anything you can’t do with plot() or par(mfrow=c()).
Try changing the fig.width, fig.height, and out.width paramters in the chunk options to see how that affect the appearance of the plots on the slide.
The strategies listed here are by no means the only ones you will ever use in a slideshow, but they offer the foundation upon which to learn new skills, interpret different types of code, and customize layouts to create the appearance you envision. If you ever need help you should have no trouble finding it on the web; the most difficult part of searching for help is trying to decide if you have an R Markdown question, a knitr question, a Slidify question, a CSS question, or an HTML question!
Good luck with your slideshow!