
Downloading the Software
Go to http://www.statprograms4u.com/ and select LazStats from the list of programs on the left. (If you have a Mac, there is a Mac version that you can easily find with an Internet search.) On the page that comes up, click on LazStatsWinSetup.exe . That will open a window that asks if you would like to save the file, at which point you click on "Save File." That will immediately load the executable copy of LazStats to your machine. You can click on that and then tell it where you would like it to install the program. I installed mine in the Program folder, but you can store yours wherever you please. That is all there is to it. As soon as the program is installed, you can go to the appropriate folder and open the program by double clicking on it.
Getting Data
Most of the time you will want to run a data file that has already been created. For example, you might load the data for Table 3.1 in the text. I will assume that you want to load that file. The way that I would do it is to open up your Web browser and go to https://www.uvm.edu/~dhowell/fundamentals8/DataFiles/DataSets.html. You can scroll down that page until you see the entry for Tab3-1.dat. Click on that link and the file will open for you on your screen. Now just go to the File menu, click on Save Page As, and select a destination. I would suggest that you create a folder on your computer that will hold all data files. That is all you need to do.
Reading Data into LazStat
You are now ready to read the data into LazStats. Just start LazStats as usual. To get LazStats to read the data. go to the Files menu and select "Import File of Type Tab separated." You need to specify that the data are tab separated because that is the way that I created all of the data files. You will be asked if the variables labels are included in the file, and you should click "OK." That will open another window that will be disappointingly empty. It really isn't empty, but it is only showing files that have a "tab" extension. The file you want is named Tab3-1.dat, not Tab3-1.tab, so it doesn't show up. Just click on the box for "files for type" and select "all files." Now any file that you had saved in that directory will appear, and you just scroll to the one named Tab3-1.dat. When you click on that, the LazStats window should show all of the data--600 lines and 7 columns. Now you are ready to get to work. If you want to save this file for later use you coould save it as "Tab3-1.laz," but I don't usually bother. (However, I do recommend reading their Help file about the Grid. There is a bunch of useful information about applying labels for your variables, changing the kind of variables there are, etc.)
A Word of Warning
In my experience, not everything will run as smoothly as you would like. You may get odd error messages, something you ask for doesn't appear--or, even worse, appears occasionally, and so on. Don't get all upset--it probably isn't your fault. I have spent my life writing programs, and I know how difficult it is to get everything perfectly set. Sometimes errors just creep in. Don't yell at the author, I assume that he tried really hard, and he does write quite sophisticated programs. Just plod ahead. Often the best thing to do is to close the program and restart it. And you can always go to his help screens if you have a problem. If you really like to play, you can download the Pascal source code from his web site and read that.
Plotting the data and looking at Frequencies
We will start by looking at what shape the distribution of data takes. First I want to create a simple frequency distribution, but to do a good job of doing that we need to also ask for a histogram, which we want anyway. To get a histogram from LazStats, we go to "Analyses/Descriptive/Frequency Analysis." We get the window shown below.
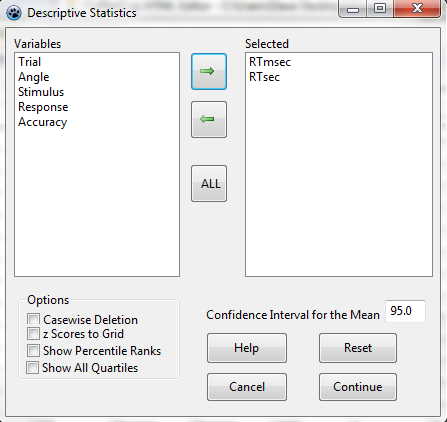
To get a histogram, we not only need to click on the "Histogram" button, but we also need to specify what the bars will look like. So click on the 2D Vertical Bars button. I suggest that you don't click on "Plot Normal Distribution." When you click OK you will see the following dialog box.
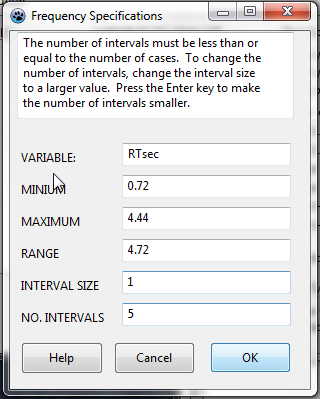
For RTsec our numbers run from .72 to 4.42. If we take the default interval size in that box, we would only have 5 intervals--(0-1, 1-2, 2-3, 3-4, 4-5), which would not be very informative. So I will ask it to use an interval width of 0.25. But after I type that width, I need to hit "Enter", which will calculate the number of intervals that will be produced. Then click on OK. You will see a tabulated frequency distribution, but you won't yet see the histogram you expect.
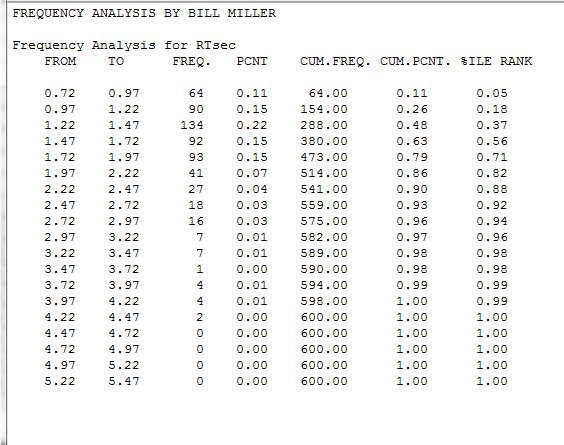
That's OK, we'll get there. First notice the frequency distribution that you have printed out. You will see that the interval of 0.72 - 0.97 has 64 observations, while the interval 1.22 - 1.47 has 134. The distribution rapidly tappers off after that, giving us a positively skewed distribution. If you just click on "Return," a very colorful histogram will appear.
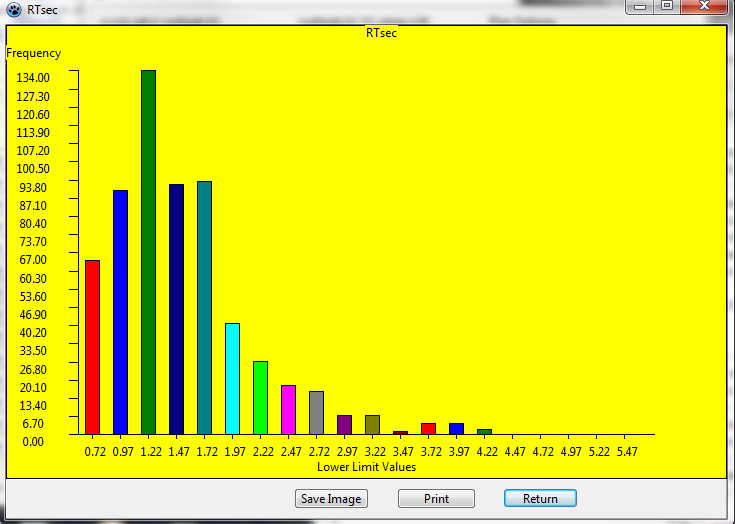
It is obviously, as we saw in the frequency distribution, that the distribution is very positively skewed.You can save that image if you want. You might think that you will see a normal distribution (see Chapter 6) if you ignored my advice and clicked on Normal Distribution Plot, but no such luck. I don't get one. Although the "Help" menu brings up quite a good help page, it doesn't say anything about this. (Ahhh!! If you look closely at his Pascal source code you see that you can only get the normal distribution if you ask for 3D bars. And you certainly don't want to be guilty of plotting two-dimensional data in three dimentions. Yuk!!
You can read more about using LazStats by going to the second page on LazStats.
Last revised 1/7/2013
dch