
Describing Data
Now that we have seen how to enter and plot our data--at least by using a histogram--we can move ahead to look at descriptive statistics such as the mean and variance. I know that I have skipped other graphics, but I'm sure that if you can plot a histogram you can figure out how to plot other graphs.
I will assume that you still have the data in Tab3-1.dat loaded. If not, load it now.
It is simple to get descriptive statistics just by going to Analyses/Descriptive/Descriptive Statistics. The dialog box that will open is pretty much self descriptive, so I will skip that. Simply enter your variables (RTMsec and RTsec and press continue. If for some reason you wanted to also convert those variables to standard (z) scores, you could click on that box, but I won't do so. Doing that will save the resulting z scores to your data file. Now click on the Continue button and you will see the following output.
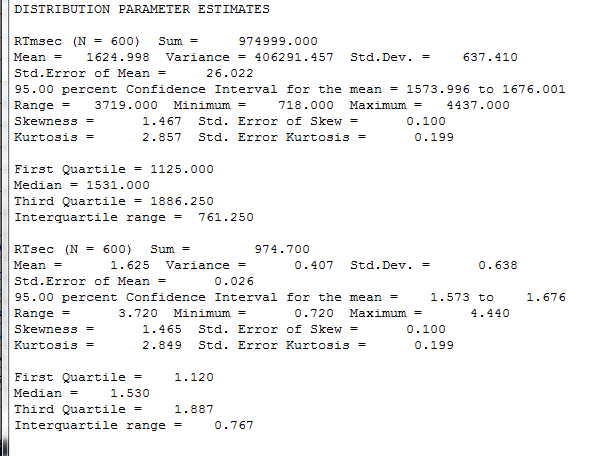
Notice that you have just about any descriptive statistic that you could want. Notice also that because RTmsec is just RTsec measures in milliseconds, the two sets of results just differ by a factor of 1000.
Correlations
I want to go ahead and show you how to get correlations based on these data. Things are pretty clear, so you could probably figure it out for yourself. First go to Analyses/Correlation/Product Moment. I am interested in looking at whether the speed of response varies as a function of the degree to which the stimulus has been rotated. I would assume that there is a reasonable correlation there. So I enter Angle and RTsec as my variables. Just for fun I will also enter Trial as a variable, because I suggested in the text that scores appear to decrease over trials. You will notice a box that you can choose labeled "Autmented." I assume that this is just a mistyping of "Augmented," but I can't imagine that word used in this context, so we will ignore it. The resulting correlations follow.
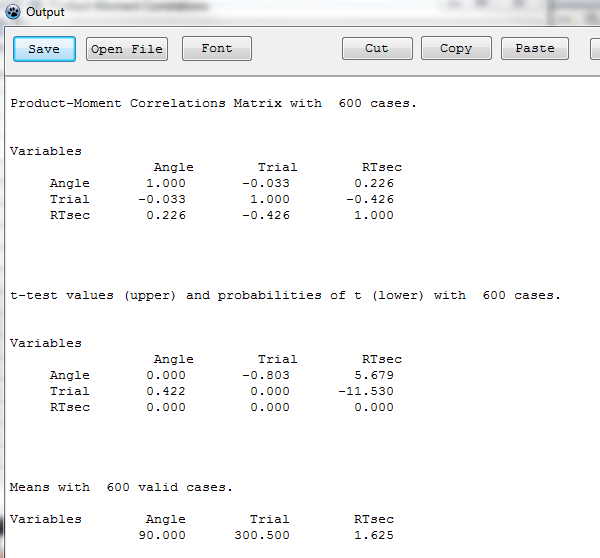
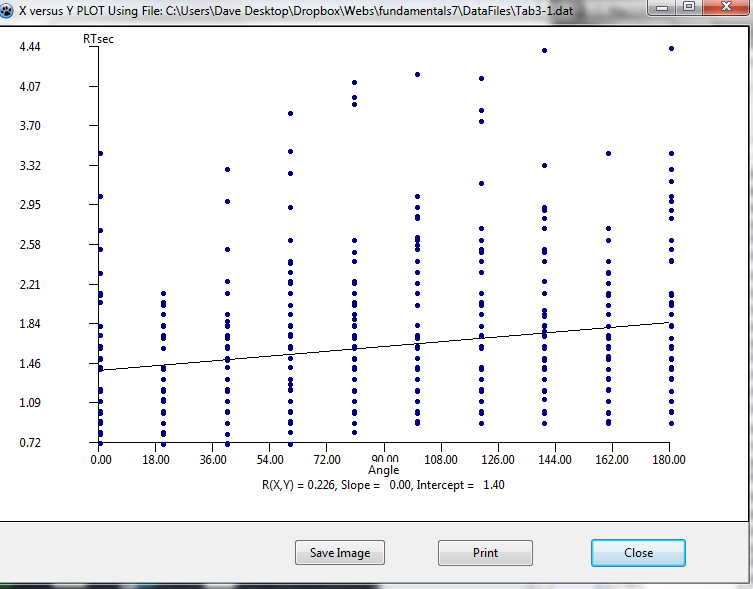
I was surprised to see that the correlation between RTsec and Angle as only 0.226. I would have though that it would be higher than that, although it is statistically significant. To push this one step further, let's go back to graphics and plot RTsec against Angle. That is shown below using the Analyses/Descriptives/Plot X vs Y link. The figure follows, and I now see much of the reason for a low correlation. Although reaction time does increase with the angle of the rotation, there is so much variability (error variance) at each level that the correlation is pretty much washed out.
Regression
The next thing that you might want to do is to regress reaction time (RTsec) against either Angle, Trial, or both. We don't come to multiple regression (two or more predictors) until later, but it won't hurt to show the results here. It is just an extension of simple regression. You want Analyses/Multiple Regression, and you want to tell it to use block entry (enter both predictor variables at the same time). Please don't use stepwise! Just enter RTsec as the dependent variable and Angle and Trial as the independent variables. Click Continue. You will get the following output.
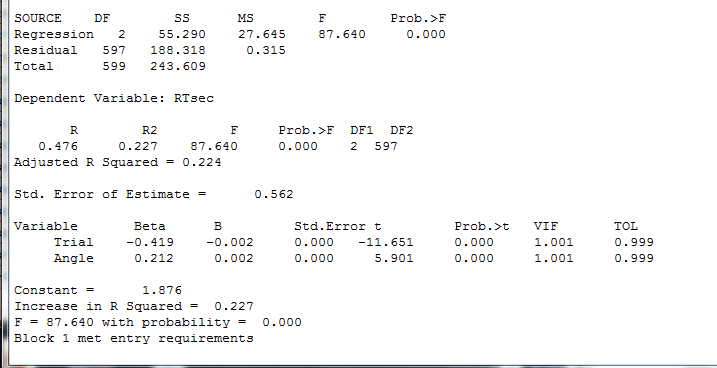
If you look near the bottom of this printout you will see values for B. These are the slopes of the regression surface in raw score units. What they tell you is that the best fitting regression equation would be
Ŷ = -.002*Trial + .002 * Angle + 1.876
Both of those regression coefficients are statistically significant. There is no test given for the intercept (1.876), but we rarely care about it anyway.
The End
I think that if you have gotten this far, you can do everything else on your own. Don't expect not to make mistakes. I make them all the time. Some of the commands are not completely obvious, but if you use a bit of trial and error, you should do fine.
Last revised 1/7/2013
dch