The OrganicA Project Progress Report: June 2006 - March 2009
Objective 1: Accomplishments
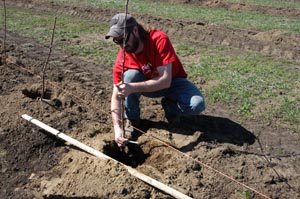
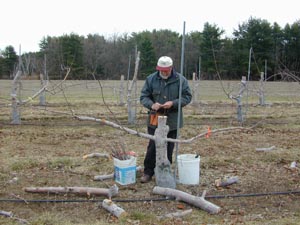
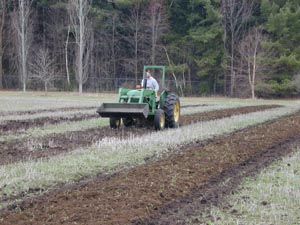
●During the first year of the project, two orchard systems that represent the way growers are changing to new apple cultivars were planted/top-grafted with five cultivars that were identified by growers as important to the future of the apple industry. Orchards are located at the University of Vermont Horticulture Farm in South Burlington, VT.
●Orchards received organic certification in 2008.
 
|
|
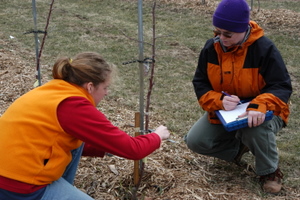
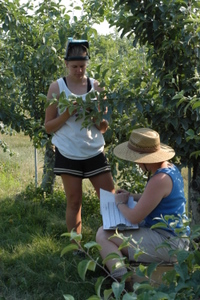
| ●Collected extensive data in the following areas for determining differences during the “orchard establishment years” (first three years) among cultivars in the two orchard systems (i.e., new orchard planted with young nursery trees; a top-grafted older orchard): Disease incidence and severity; Arthropod pest damage and population levels; Beneficial arthropod levels; Horticultural data; Measurements of tree ‘health’; Measurements of soil ‘health’; and Economic inputs (i.e., detailed records have been kept on amount of labor used, tasks performed and time required, cost of supplies, maintenance, pest management, harvest, etc. for each orchard). |
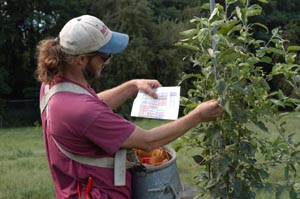  |
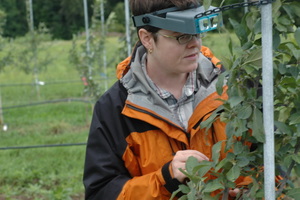
| ●Complementary organic research entitled ‘Evaluation of alternative fungicides for organic apple production in Vermont’ was conducted as a Graduate Research Project in 2007-2008 by graduate student Morgan Cromwell. The objectives of this study were to: (i) compare the efficiency of alternatives to a standard organic lime sulfur/sulfur fungicide program; (ii) evaluate potential non-target impacts of these fungicides on pest and beneficial insect populations; and (iii) conduct a preliminary experiment evaluating the potential of raw milk as a fungicide in organic apple production in Vermont. |
  |
| ●Research results have been presented at numerous grower and scientific meetings in the state, region, the Midwest, Italy, and France. Currently, summaries are being prepared for dissemination via the OrganicA website and scientific journals. |
    |
Objective 1: Preliminary Summary of Research Results and Insights
(a) Horticulturally -- what we have learned ….
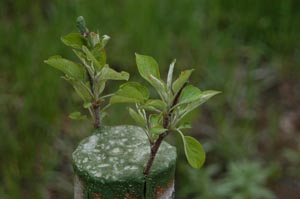
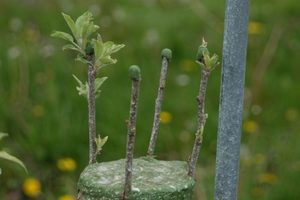
During the establishment years of the OrganicA orchards, we collected horticultural data on tree growth and survivability, blossom density and fruit yield. Since the two orchards were established in uniquely separate ways, the orchards were assessed separately but provide valuable data on top-grafting existing trees versus planting new young trees. Survivability data include both initial graft success in Orchard 2 and final tree survival in both orchards. In Orchard 1, only one of the 250 planted trees died in the year of establishment, with no further losses from biotic factors during the next two growing seasons. However, two trees were lost during cultivation exercises in 2008. In Orchard 2, initial survival of new grafts was very good for most cultivars (94-100%) except Zestar! which had only 84% of trees with at least one live scion in April 2007 (one year after grafting) (Table 1). Block 1 and 2 indicate the original cultivar on which the new cultivars where grafted (Liberty and McIntosh, respectively). No differences were detected based on what the original cultivar was.
Table 1. Scion survival of five cultivars in a top-grafted orchard.
OrganicA Project, Orchard 2 (2008) |
 |
Cultivar |
Proportion of trees with at least one living scion
April 2007 |
Block 1 |
Block 2 |
All trees |
Ginger Gold |
1.0000 |
0.9545 |
0.9737 a |
Honeycrisp |
0.9375 |
0.9545 |
0.9474 ab |
Liberty |
1.0000 |
1.0000 |
1.0000 a |
Macoun |
1.0000 |
1.0000 |
1.0000 a |
Zestar! |
0.8125 |
0.8636 |
0.8421 b |
Block 1 and 2 indicate the original, existing cultivar (Liberty and McIntosh, respectively) on which the scions were grafted. There were no significant block effect in this data set.
During the 2007 growing season a condition in Orchard 2 was noted where some trees exhibited peeling of bark below the scion graft and tree health decline. In September 2008, general vigor and health of each tree were rated. This was done in order to determine if there were cultivar differences in growth of top-grafted trees. Each tree was rated on a scale from 0 to 3 where 0= tree dead, 1= small, stunted tree, 2= healthy smaller tree in relation to maximum growth for the cultivar, and 3= healthy tree vigor reasonable for the cultivar (Table 2).
The percentage of trees with a health rating of 3 varied by cultivar, with Ginger Gold and Honeycrisp faring best, followed by Liberty and Macoun which were statistically equal to the best and worst cultivars. Zestar! showed the greatest tree decline or death, with only 63.2% receiving the healthiest rating of 3. Many Zestar! trees, and to a lesser extent, Macoun trees were completely dead or of such low vigor they would not be profitable for commercial production. A multi-year analysis of tree survivability and quality under the two systems used for orchard establishment (newly planted trees vs. scions grafted onto existing trees with mature root systems) is essential to assist in determining economic differences between the systems. Growers who choose to top-graft an orchard rather than remove trees and start fresh do so under the conventional wisdom that bypassing a two-year fallow period, followed by three establishment years for the new trees, will give them a marketable crop sooner. The initial results from this study indicate that poor survival of certain top-grafted cultivars may negate the benefit of earlier production
Table 2. Proportion of trees with good health and vigor in a top-grafted orchard.
OrganicA Project, Orchard 2 (2008) |
 |
Cultivar |
Proportion of trees with Tree health rating of 3
September 2008 |
Block 1 |
Block 2 |
All trees |
Ginger Gold |
0.9375 |
0.9545 |
0.9474 a |
Honeycrisp |
0.9375 |
0.9545 |
0.9474 a |
Liberty |
0.8750 |
0.8636 |
0.8684 ab |
Macoun |
0.6875 |
0.7727 |
0.7368 bc |
Zestar! |
0.5625 |
0.6818 |
0.6316 c |
Block 1 and 2 indicate the original, existing cultivar (Liberty and McIntosh, respectively) on which the scions were grafted. There were no significant block effect in this data set.
There were few differences in overall growth between the cultivars, as measured by trunk cross sectional area (TCSA) in both orchards. In Orchard 2 there were no differences between cultivars in TCSA change over the three years indicating that cultivars grew at a similar rate. In Orchard 1, Honeycrisp TCSA change was statistically greater than the other four cultivars, likely due to the more vigorous rootstock (M.26 vs. Bud.9) used for this less vigorous cultivar.
Differences among cultivars in precocity (tendency to fruit quickly) occurred in both organic orchard systems. Zestar!’s tendency to set flowers on one year-old wood showed a correlation to graft survival in 2006 in the top-grafted trees. Because flower development and fruiting occur at the expense of vegetative growth, it is not preferable to have flowers develop on newly grafted shoots which must become established in the first year of growth in order to survive winter and other field conditions. On established trees in 2008, Ginger Gold, Zestar!, and Liberty exhibited much higher flower density, indicating that these trees have the potential to bear commercial crops earlier and therefore may be more profitable to the grower. While flower density measures potential precocity of a particular cultivar, actual fruit harvested is how a grower will judge a cultivar which, in turn, relates to its ability to generate an early return on investment.
A cultivar’s tendency to bear fruit early, and therefore provide quicker financial return to a grower, is especially important. For all trees in both orchard systems, yield was recorded as harvested weight of fruit as well as number of apples per tree. Dropped fruit were counted and weighed separately but not included in the marketable yield, although they were included in determining the yield efficiency of the tree. Yield efficiency was calculated by dividing the yield by the trunk cross-sectional area (TCSA) of that tree. Yield efficiency allows us to compare yield of cultivars that differ in size because of natural variations in vigor.
In 2008, the third growing season and traditionally a time when growers will allow at least some fruit to develop on a tree, fruit were counted and the total kg yield per tree recorded for each orchard. Trees in Orchard 1 were still quite small in 2008, and bore a minimal crop averaging 0.15 to 4.5 fruit per tree, with Liberty and Macoun having significantly more fruit harvested (Table 3). Yield efficiency was different across the cultivars, with Liberty the greatest followed by Macoun and Zestar! which were significantly greater than Ginger Gold and Honeycrisp. This yield would be considered below the level of a commercial harvest. However, trees were pruned at planting to eliminate differences in tree size among the different cultivars. When trees of one cultivar are larger at planting than trees of another cultivar, it compromises subsequent comparisons in yield since large trees tend to begin bearing sooner than smaller trees. Because of this initial pruning, trees in Orchard 1 are potentially one year behind in size and yield of trees not pruned at planting.
Table 3. Yield in 2008 of Five Cultivars.
OrganicA Project, Orchard 1 (2008)
Data Title: Gross Harvest |
 |
Cultivar |
Number fruit
on tree |
Net kg of fruit
on tree |
Yield efficiency
(net kg yield on tree / TCSA (cm2)) |
Ginger Gold |
0.19 c |
0.04 c |
0.0147 c |
Honeycrisp |
0.15 c |
0.05 c |
0.0109 c |
Liberty |
4.50 a |
0.73 a |
0.2338 a |
Macoun |
1.69 b |
0.27 b |
0.0933 b |
Zestar! |
0.73 bc |
0.14 bc |
0.0655 b |
|
p<0.001 |
p<0.001 |
p<0.001 |
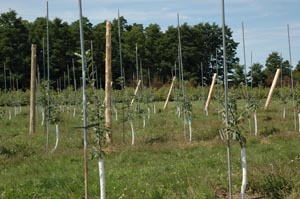
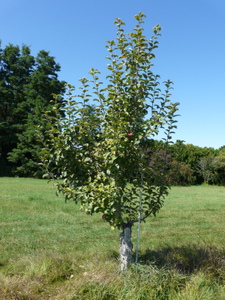
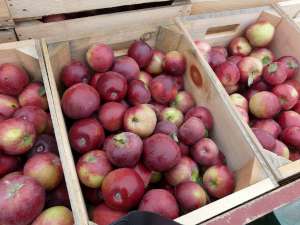
Yield in Orchard 2 was much greater than in Orchard 1 in 2008 due to the larger size of the trees (Table 4). Many of these trees, due to the well-established root systems remaining from the previous, original orchard, had reached a height and spread comparable to established, mature dwarf trees in the three years since grafting. Trees were top-grafted onto two cultivars, but there was no difference in yield due to the original cultivar (McIntosh or Liberty), so data were combined for both. Ginger Gold produced a significant and marketable crop in year 3, which was greater than the other four cultivars in this trial. This was in contrast to Orchard 1 in which Liberty had greater yield than other cultivars.
Table 4. Yield in 2008 of five cultivars in a top-grafted organic apple orchard.
OrganicA Project, Orchard 2 (2008)
Data Title: Gross Harvest |
 |
Cultivar |
Yield
(kg/tree) |
Yield efficiency
(kg yield / TCSA (cm2)) |
All trees |
All trees |
Ginger Gold |
15.26 a |
0.1150 a |
Honeycrisp |
2.87 b |
0.0248 b |
Liberty |
6.53 b |
0.0447 b |
Macoun |
0.97 b |
0.0079 b |
Zestar! |
2.31 b |
0.0164 b |
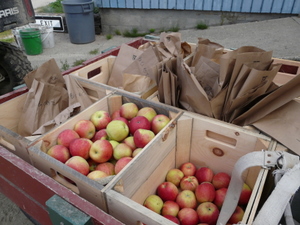
The quality of fruit harvested was variable across all cultivars although the proportion of each cultivar’s yield sorted into economic size and grade categories was not statistically significant. Fruit quality and pack-out will be further discussed in the economics section.
We expect that both orchard systems will reach their mature size within the next three years and will begin to bear at their full potential, allowing for important analyses of differences in fruit yield and quality, including full economic analysis and risk assessment. These next years will be income-producing years which will help to recoup investment costs and see a return on funds invested. The next three years are critical to determining the sustainability and profitability of the five cultivars within the two organic orchard systems.
Our experience with the two orchard systems and stakeholder input have identified key limiting factors to tree health which require further research -- organic nutrient management and ground cover management. Therefore, we will also be addressing these areas in the next three years of the project.
(b) Disease and Arthropod Management -- what we have learned ….
We have learned that it is extremely important to assess the surrounding orchard ecosystem for sources of disease inoculum. Abandoned, decayed apple trees near the two orchard systems were providing high levels of disease inoculum which impacted disease management decisions and disease incidence in the orchards. Diseased trees within 100 m of the orchards are being removed to reduce the necessity of fungicide applications to protect the trees from inoculum coming in from these outside sources.
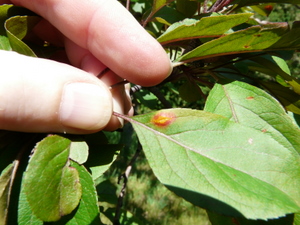
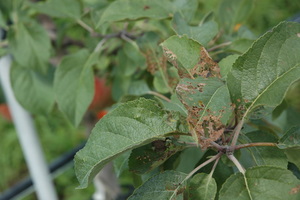
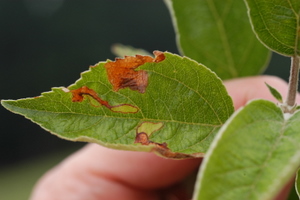
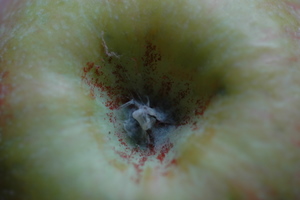
Based on initial foliar disease assessments during the establishment years of the orchards, Honeycrisp appears more resistant to apple scab than the other scab-susceptible cultivars Zestar!, Ginger Gold, and ‘Macoun, but appears more susceptible to cedar apple rust, than ‘Liberty and Zestar!. Macoun and Zestar! exhibited a higher incidence of necrotic leaf spots than the other cultivars; this may indicate a higher presence of fungi that also can cause fruit rots ( samples of data collected are in Tables 5, 6). This research is on-going and will document disease challenges and the economic costs, returns, and risks associated with managing diseases of these five cultivars being grown with organic production practices within the two orchard systems.
Table 5. Orchard 1 - Percent Vegetative Terminal Leaves Infected, August, 2006
Cultivar |
Scab |
Rust |
Necrotic Leaf Spot |
 |
Ginger Gold |
41.3 a |
25.6 a |
5.4 bc |
Honeycrisp |
2.7 c |
13.5 b |
3.8 c |
Liberty |
0.0 d |
0.3 c |
3.1 c |
Macoun |
28.4 b |
1.5 c |
10.8 a |
Zestar! |
34.1 ab |
0.7 c |
10.2 ab |
Table 6. Orchard 2- Percent Vegetative Terminal Leaves Infected, August, 2008
Cultivar |
Scab |
Rust |
Necrotic Leaf Spot |
 |
Ginger Gold |
11.2 a |
39.6 a |
15.1 |
Honeycrisp |
0.6 c |
22.2 ab |
14.7 |
Liberty |
0.0 d |
7.1 b |
14.6 |
Macoun |
1.2 bc |
8.6 b |
25.0 |
Zestar! |
2.1 b |
5.4 b |
20.1 |
Data in Tables 7, 8 and 9 indicate that Honeycrisp and Liberty appear more attractive to Japanese beetles and, although beneficial insects were often very prevalent in the orchards, European red mite populations are increasing over time. This may be an indication that the organic pesticides we have used in the orchard systems may be negatively impacting the predacious mite, T.pyri, which can provide biological control for pest mites. We will be monitoring these populations more closely over the next three years. Beneficial insects such as lady bug beetles (larvae and adults), syrphid fly larvae and cecidomyid larvae have played a role in the biological control of green apple aphids.
Table 7. 2006 Orchard 1: % Veg. Terminal Leaves – Incidence Aug. 9-11, 2006
Cultivar |
Aphids |
ERM* |
STLM mines |
WALH damage |
Japanese beetle damage |
 |
Ginger Gold |
0.0 |
0.2 |
5.7 |
0.9 |
0.4 bc |
Honeycrisp |
0.0 |
0.0 |
6.7 |
1.4 |
5.1 a |
Liberty |
0.0 |
0.1 |
5.2 |
0.6 |
2.3 ab |
Macoun |
0.4 |
0.2 |
3.7 |
0.3 |
0.0 c |
Zestar! |
0.3 |
0.0 |
5.2 |
0.9 |
0.4 c |
*ERM=European red mite; STLM=Spotted tentiform leafminer; WALH=White apple leafhopper
Table 8. 2007 Orchard 1: % Veg. Terminal Leaves – Incidence Aug. 7, 2007
Cultivar |
Aphids |
ERM* |
STLM mines |
WALH damage |
Japanese beetle damage |
 |
Ginger Gold |
3.7 a |
11.3 |
2.2 |
0.0 |
1.7 b |
Honeycrisp |
2.0 ab |
6.7 |
1.3 |
0.0 |
10.4 a |
Liberty |
1.0 ab |
0.9 |
1.0 |
0.0 |
11.8 a |
Macoun |
0.0 b |
5.2 |
1.4 |
0.0 |
0.6 b |
Zestar! |
0.0 b |
2.0 |
3.8 |
0.0 |
1.5 b |
*ERM=European red mite; STLM=Spotted tentiform leafminer; WALH=White apple leafhopper
Table 9. 2008 Orchard 1 & 2: % Veg. Terminal Leaves – Mite Incidence Aug., 2008
|
Orchard 1 |
Orchard 2 |
 |
Cultivar |
TSSM* |
ERM |
TSSM |
ERM |
Ginger Gold |
17 c |
100 a |
8 bc |
95 |
Honeycrisp |
19 bc |
99 a |
29 a |
91 |
Liberty |
36 ab |
98 ab |
21 a |
91 |
Macoun |
17 c |
99 ab |
7 c |
74 |
Zestar! |
39 a |
96 b |
18 ab |
72 |
*TSSM=Two-spotted spider mite; ERM=European red mite
(c) Soil Health Management -- what we have learned ….
Soils of poor health are described as those with reduced soil organic matter, which in turn are associated with reduced water infiltration, porosity, and biological activity, and increased compaction, soil erosion, and pest problems (Herrick and Wander, 1998). It is unclear how organic orchard management impacts the overall quality of the soil. The goal of this project was to evaluate soil quality in a newly planted organic orchard (Orchard 1) and in the top-grafted older orchard (Orchard 2).
Prior to establishment in 2006, soil health tests were taken from across the field where Orchard 1 was established. In 2007 and 2008, soil health tests were conducted in both the alleys and rows of Orchard 1. In 2006, 2007, and 2008 soil health tests were conducted in both the alleys and rows of Orchard 2. When soils were sampled, ten soil wedges (13 cm x 5 cm x 15 cm) were taken randomly from rows and alleys of the orchards with a trowel. The soil wedges were composited and a 600 ml subsample was taken for soil health analysis. The soils were processed at the Cornell Soil Health Lab (Cornell University, Ithaca, NY) to quantify the quality of soils from the two orchards. The soils were evaluated for physical (aggregate stability, surface and subsurface hardness), biological (organic matter, active carbon, potentially mineralizable nitrogen), and chemical properties (pH, phosphorus, potassium, and minor elements) as described by Gugino et al. (2007). |
 |
Orchard 1: Soil health analysis was measured at the end of April in 2007 and 2008. Soils were sampled using the methodology developed by Cornell (Gugino et al., 2007).
- Orchard 1 Alleys: With the exception of aggregate stability, the physical properties in the alleys of Orchard 1 were considered poor based on the Cornell Soil Health Test (CSHT) rating system (Gugino et al., 2007). The alleys are the area with the most equipment traffic. Often pressure from equipment will result in soil compaction and degraded physical properties. The biological measurements of soil quality were considered poor based on the CSHT rating system. The soil organic matter levels and biological activity were low as compared to other sandy soils. This might be a result of low food source and poor habitat for microorganisms to function properly. Since no organic matter had been added to the soil since planting the biological population is low. The chemical parameters were sufficient as compared to other sandy soils.
- Orchard 1 Tree Rows: The physical properties in the tree rows was considered high based on the CSHT rating system. Interestingly the physical properties of the soils improved slightly from 2007 to 2008. This might be attributed to the fact that the tree roots had started to create improved soil structure. It might also be a reflection of low equipment traffic. All of the biological properties in the tree rows were considered high in 2007. Interestingly, by 2008 the level of active carbon had declined to a sub-optimal level based on the CSHT rating system. The organic matter in sand-textured soils is often prone to rapid decomposition and therefore active carbon would be decomposed quickly. The chemical soil properties were sufficient in the tree rows of Orchard 1.
Based on our limited observation of the soil health of the newly planted orchard, it is likely to continue to see a decline in soil biological activity in the coming years. If management is changed to include organic matter amendments or ground cover in the rows this might be deterred. Once the orchard is established it might become an option to establish a sod ground cover in the tree rows and alleys. It has not been determined how these ground covers are impacting yields and orchard pests such as weeds, insects, and diseases. [Note: This will be a focus of advanced research over the next three years.]
Orchard 2: Soil health analysis was measured at the end of April in 2007 and 2008. Soils were sampled using the methodology developed by Cornell (Gugino et al., 2007).
- Orchard 2 Alleys: With the exception of aggregate stability, the physical properties in the alleys of Orchard 2 were considered poor based on the CSHT rating system. Surface and subsurface compaction may have been a result of equipment traffic on the soils. The biological measurements of soil quality were considered adequate based on the CSHT rating system. Interestingly, the biological properties of the orchard alleys were rated higher than the tree rows in Orchard 2. This might be a reflection of the long term sod management in the alleys of this orchard. In the future the soil health of the tree rows might improve as the sod cover remains intact over time. The chemical parameters were rated sufficient as compared to other sandy soils.
- Orchard 2 Tree Rows: With the exception of subsurface hardness the physical properties in the tree rows was considered high based on the CSHT rating system. Interestingly, the subsurface hardness improved from poor to excellent from 2007 to 2008. This might be attributed to the sod ground cover established within the tree rows. The sod might be growing and breaking up compacted layers. The soil organic matter and active carbon are considered poor in the tree rows. It will be interesting to see if the levels of organic matter increase over time with the addition of the sod ground cover. The chemical soil properties were sufficient in the tree rows of Orchard 2. Interestingly, the biological properties of the orchard alleys were rated higher than the tree rows in Orchard 2. This might be a reflection of the long term sod management in the alleys of this orchard. In the future the soil health of the tree rows might improve as the sod cover remains intact over time.
Gugino BK, Idowu OJ, Schindelbeck RR, van Es HM, Wolfe DW, Thies JE,
Abawi GS. 2007. Cornell Soil Health Assessment Training Manual. New York State Agric. Experiment Sation. Geneva, New York
Herrick, J.E., and M.M. Wander. 1998. "Relationships between soil organic carbon and soil quality in cropped and rangeland soils: the importance of distribution, composition, and soil biological activity." In Soil processes and the carbon cycle, 405-425. Boca
Raton, FL. CRC Press.
(d) Economically -- what we have learned ….
To date, we have compared the economics of the two organic systems through calculating the Net Present Value (NPV) of cash inflows and outflows during the establishment period. Total annual cost includes labor, supplies, equipment, grafting, and new plant stock. To no surprise, neither system has produced a positive cash flow in any year since startup. This is the period of time when orchard plantings normally experience negative cash flows simply due to the fact it takes several years before any apples are available to generate revenue.
The NPV of Orchard 1, the newly planted orchard, is nearly 4 times worse than the NPV of Orchard 2, the top grafted orchard, after 3 years (Table 10). However, both orchards still display a negative cash flow as neither has developed a commercial quantity of produce. The analysis to date indicates a significantly higher investment in Orchard 1, the orchard planted with young trees. However, the lower interest rates as experienced in 2006-2009 may dampen the NPV difference between the two orchards. While having a substantially lower initial investment, Orchard 2 presents a challenge with the death of host trunk system and some loss of top-grafted scions.
Planting orchards presents significant risk from disease and weather. However, any risk analysis at this point does little to shed light on the economical returns over the life of the orchard. Despite the relatively higher NPV of Orchard 2, we cannot make any assessment of the economic vitality of either system until saleable produce emerges beyond year 4. Therefore, at this point we can only conclude Orchard 2 requires lower initial costs, however, the net benefits over the productive life of the orchard cannot as yet be assessed. We expect the economic analysis of the two systems to emerge over the next 2 to 3 years of orchard development.
Table 10. Net Present Value for Orchards 1 & 2 during the establishment years.
| Year |
Income |
Total
Annual
Costs |
Net Cash
Flow per
Acre |
Accumulated
Cash Flow
per Acre |
Net Present
Value of
Cash Flow
per Acre |
Net Present
Value of
Accumulated
Cash Flow
per Acre |
Orchard 1 |
|
|
|
|
|
|
2006 |
$0 |
$21,247 |
($21,247) |
($21,247) |
($21,247) |
($21,247) |
| 2007 |
$0 |
$3,243 |
($3,243) |
($24,491) |
($3,049) |
($24,296) |
2008 |
$181 |
$5,131 |
($4,949) |
($29,440) |
($4,373) |
($28,669) |
| Orchard 2 |
|
|
|
|
|
|
| 2006 |
|
$4,000 |
($4,000) |
($4,000) |
($4,000) |
($4,000) |
| 2007 |
$949 |
$3,765 |
($2,816) |
($6,816) |
($2,647) |
($6,647) |
| 2008 |
$2,496 |
$3,231 |
($735) |
($7,551) |
($649) |
($7,297) |
|
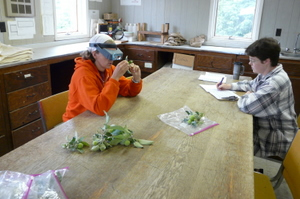
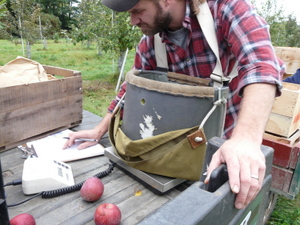
economic data collection sheets
|