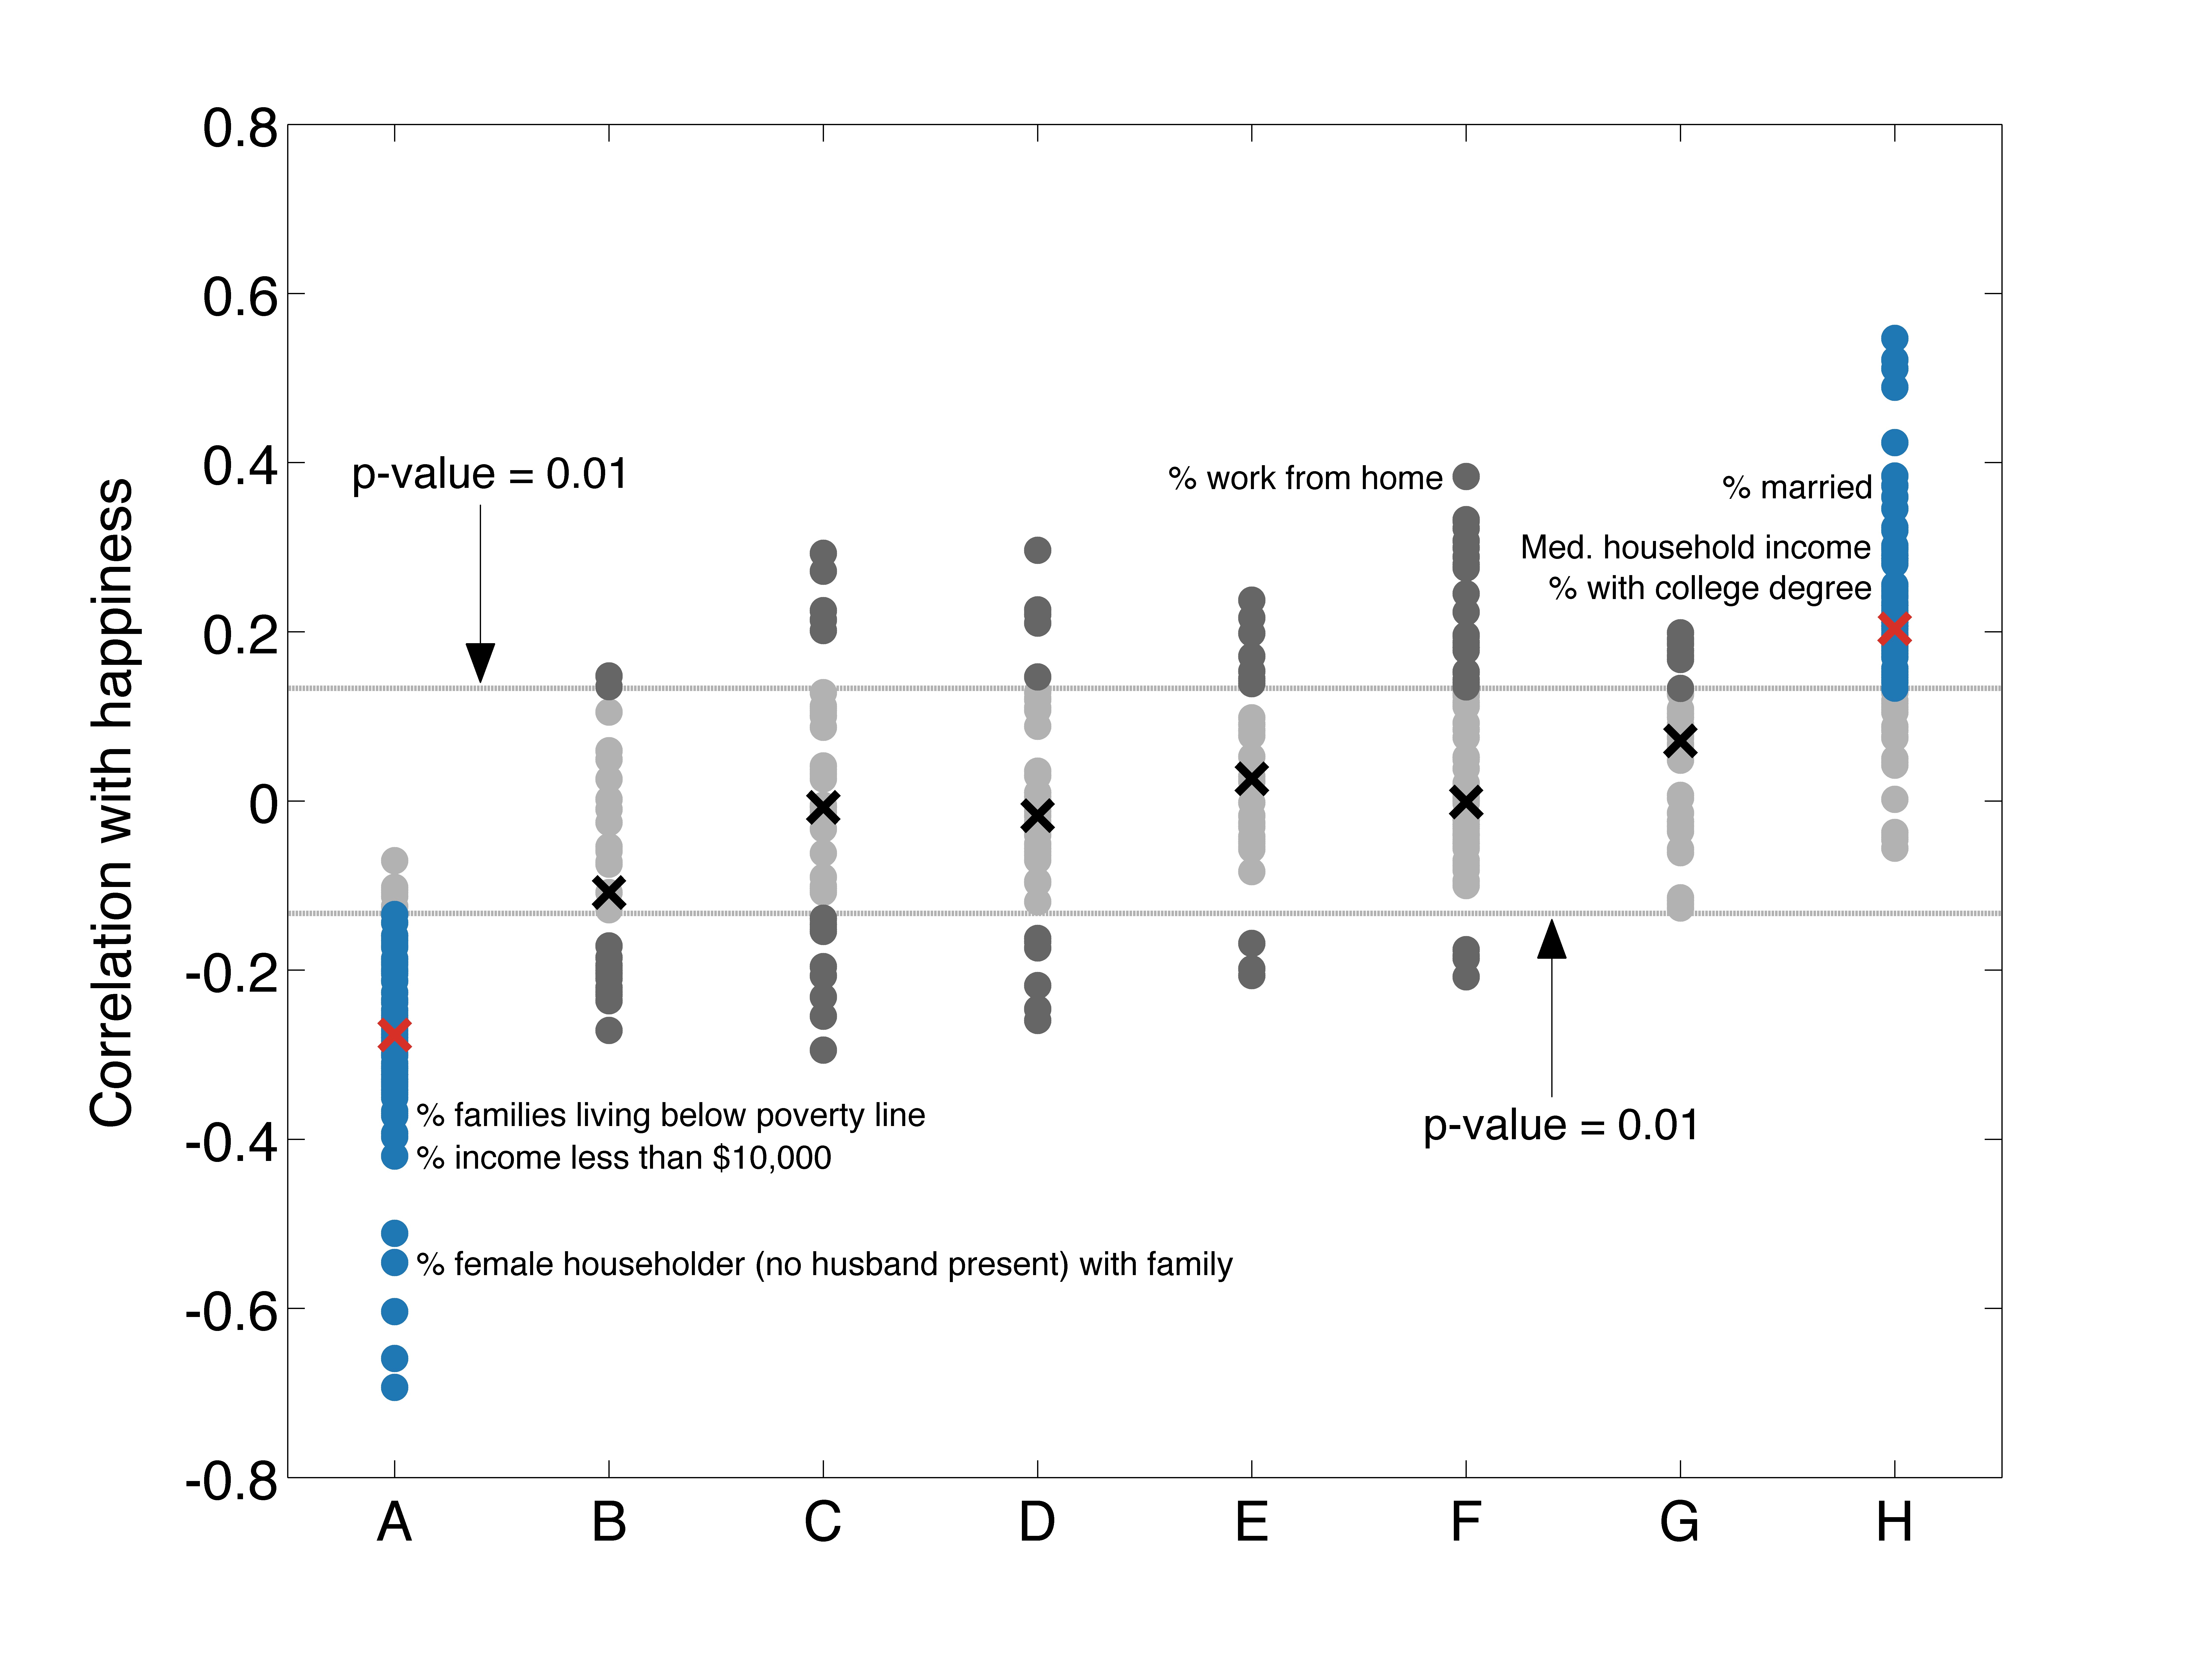
Figure 10: Spearman correlations for 432 demographic attributes with happiness. The 8 groupings along the horizontal axis are for covarying attributes identified by agglomerative hierarchical clustering, independently of happiness. Crosses lie on the median of each cluster, and the dashed lines represent the 1% significance level. The two clusters which have medians that correlate significantly with happiness are colored blue. A complete list of the correlation of all attributes with happiness can be found below the figure.

Select an attribute to display a scatter plot of happiness against that attribute for all cities, as well as a table of correlations between that attribute and each LabMT word. (Note: due to the large amounts of data some tables can be slow to load)