
trend is
up
over time
Acid rain harms forests and other ecosystems by damaging leaves and leaching nutrients.

trend is
flat
over time
The length of the growing season varies from year to year, but large or persistent changes can be problematic to forests.
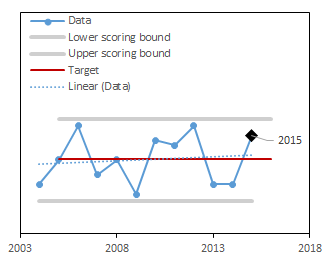
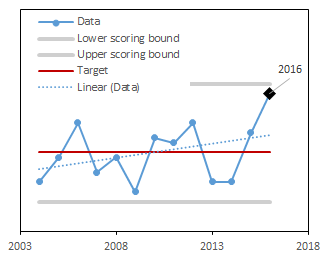
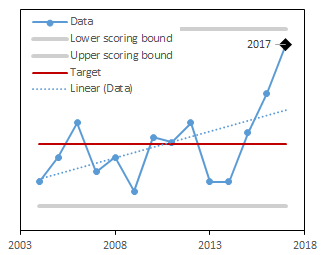
trend is
up
over time
Ozone can cause many negative impacts to forests by reducing regeneration, productivity, and species diversity.

trend is
down
over time
Mercury is a toxin that persists in the environment for long periods by cycling back and forth between the air, water, soil and organisms - resulting in long-term, negative effects to forest ecosystems.
trend is
flat
over time
Warmer winter minimum temperatures can allow for non-native species to proliferate, while at the same time stressing native forest trees.
trend is
flat
over time
Higher maximum summer temperatures can stress forests, reducing productivity and health.
trend is
flat
over time
Changes to precipitation can alter the water balance in Vermont’s forests, causing either drought or deluge.
trend is
flat
over time
Snow insulates the soil and tree roots from cold temperatures and provides water when it melts.
trend is
flat
over time
Climate change will continue to result in more extreme weather events, which can stress forests beyond what they are accustomed.
trend is
flat
over time
Lack of sufficient precipitation can cause both immediate and long-term stress to trees.
trend is
flat
over time
As native trees are not adapted to defending themselves from non-native, invasive insects and diseases, widespread damage and mortality can result.
Latest Score:
5/5
in 2024
score trend is up over time
Ground-level ozone is formed through a chemical reaction between air-born organic compounds (VOCs) and nitrogen oxides (NOx) when exposed to sunlight1. High levels of ozone exposure can cause leaf damage, which can reduce the efficiency of processes such as photosynthesis. Foliar damage due to ozone exposure is the first visible sign of injury, and indicates impaired physiological processes in the leaves1. For some trees, ozone exposure can increase the likelihood of secondary stressors, like damage caused by diseases, insects, or weather events. Ozone is expressed as the average concentration (in parts per million) between the hours of 8:00 am and 8:00 pm2 from April 1 to September 30. Due to regulations, ground-level ozone pollution has improved gradually over the past decade. Here, we selected the W126 standard3 because it is thought to be better representation of ozone injury to plants. The target ozone concentration has been set by the EPA at 0.07 ppm-hour2. A high score means that ozone levels are below this threshold.
The score is calculated using a target value and the historical range of the the entire long-term dataset. The higher the score, the closer this year's value is to the target.
Once the score is computed for each year, the trend in scores over time is calculated. If the trend is significantly positive or negative, the long-term trend is marked as increasing or decreasing respectively.
| Component | Description |
|---|---|
| Scored as | Distance between target and maximum (scaled 1-5) |
| Target value | 7 |
| Directionality of scores | Lower values in the data are better. |
| Minimum value used in scoring | 0 |
| Maximum value used in scoring | Data maximum + 10% of range |
Daily ozone data (ppm-hour) was accessed from the air quality monitoring sites at Underhill (Proctor Maple Research Forest) and Bennington (Morse Airport), Vermont1. To compute an ozone exposure index, we selected the W126 standard2 because it is thought to be better representation of ozone injury to plants. Under this, Vermont’s ozone monitoring season runs April 1 to September 30 and growing hours are 8:00 am to 8:00 pm. We determined the minimum detection limit per site (here 0.005 for both sites over the entire record). We backfilled missing values with the minimum value observed per year, restricted to the established monitoring season and growing hours. All months must have >75% completeness in daily records to be utilized. Data were transform following the equation: OZ*(1/(1+4403*EXP((OZ*(-126))))). A daily index value was calculated by summing the transformed values per day; these were then summed per month to compute a monthly index value. These monthly indices were multiplied by the ratio of collected and backfilled samples to total possible samples within the month. For each month, we computed a three-month maximum -- the current month plus the two preceding months (i.e., the3-month maximum for June is the maximum of June, May and April). In Vermont, this results in 3-monthmaximum values for June, July, August and September. To compute the annual W126, we took the mean of the largest 3-month maximum over the current year and the previous two years. We set the target for ozone exposure at 7 ppm-hour3. The annual score was computed as a difference between 7 and the upper scoring bounds (maximum value in the dataset plus 10% of the range), scaled between 1 and 5. Values below 7 were given a score of 5.
Dataset: VT Ozone