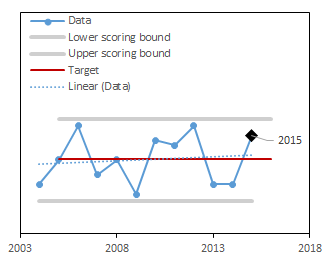

trend is
flat
over time
The average crown dieback of trees in Vermont's forest provides us information on overall forest health.
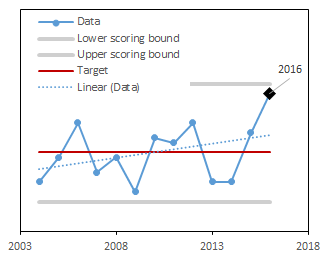
trend is
flat
over time
Damages to forests occur from insects, diseases, weather events, animals, and human impacts.

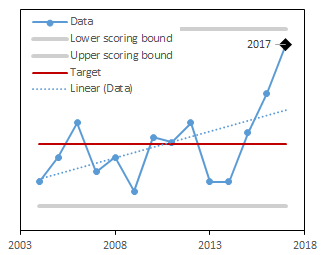
trend is
up
over time
Forest growth provides information on how much biomass Vermont's trees add annually.
trend is
flat
over time
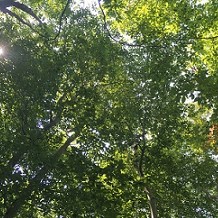
Higher values of canopy density indicate a more lush, green, and productive forest.
trend is
flat
over time
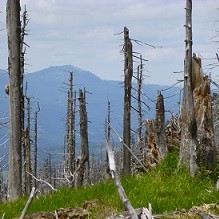
Mapped forest mortality is an assessment of the total area of current-year tree mortality across the landscape.
trend is
flat
over time
The proportion of trees with damage and decay provides information on the condition and the potential timber quality of Vermont's trees.
trend is
flat
over time
Individual tree mortality is a natural and common event, but changes to the baseline rate can signify worsening environmental conditions for trees.
Score is trending flat over time
Condition is the overall health and status of the trees in forests. While forest condition can vary from year to year due to weather or pests and pathogens, long-term trends often indicate a more persistent problem. The condition of the forest dictates provisioning of the important ecosystem services we rely on, like wood and maple syrup production, and carbon storage.
Condition provides insight into how the forest is reacting to its surrounding environment and whether or not the forest is showing signs of long-term decline or impacts form external stresses. Tracking condition over time provides an early warning sign of impacts from potential and current threats to the overall health of the forest.
To assess forest condition, the Forest Indicators Dashboard uses data on tree dieback, growth, damage and mortality, as well as landscape-level metrics like canopy density.
| Indicator | Weight |
|---|---|
| Crown Dieback | 8% |
| Forest Damage | 8% |
| Tree Growth | 8% |
| Canopy Density | 8% |
| Forest Mortality | 8% |
| Damage and Decay | 8% |
| Tree Mortality | 8% |
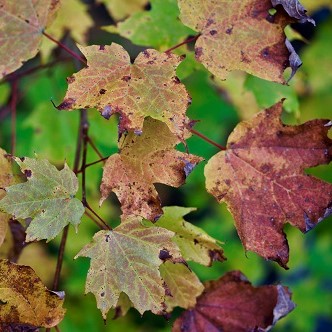
Crown dieback is assessed by visually inspecting the leaves and crown of trees. When trees experience stress, they begin to move resources from the outermost leaves and fine branches, and these areas will die. While dieback can vary from year to year based on weather or insects, trends over time can indicate more subtle issues in overall health. A higher score means that dieback is staying low over time.
Crown Dieback contributes to 8% of the overall Condition category score.
Forest damage is assessed by a visual inspection of forest damage via fixed-wing aircraft. These damages could be caused by pests, weather, disease, fire, or a range of other causes. We tallied the area of all identified damages, except for mortality. . A high score means the acreage of forest damage is staying low over time.
Forest Damage contributes to 8% of the overall Condition category score.
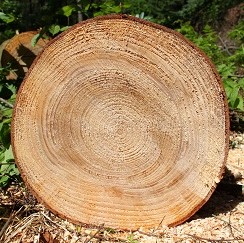
Trees grow to different sizes and at various rates depending on species, age, and site characteristics, and here we report on measured growth of trees per year. A high score means that tree growth is remaining stable over time.
Tree Growth contributes to 8% of the overall Condition category score.
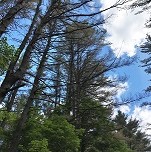
Canopy density or ‘greenness’ is estimated using data collected by the MODIS satellite mission, and represents the thickness of the forest foliage. Higher greeneness is associated with a greener and more photosynthetically-active forest. A higher score means that canopy density is staying high over time.
Canopy Density contributes to 8% of the overall Condition category score.
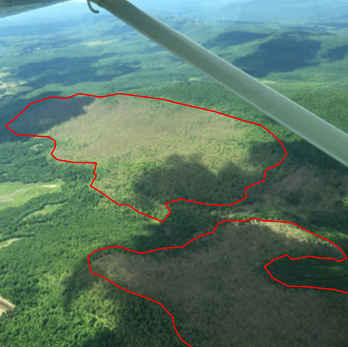
Forest mortality is assessed by a visual inspection and mapping of areas of dead trees via fixed-wing aircraft. These damages could be caused by pests, weather, disease, fire, or a range of other causes. We tallied the area of mortality since the last survey. A high score means that forest mortality is remaining low over time.
Forest Mortality contributes to 8% of the overall Condition category score.
While damaged and decaying trees have a vital role in the forest ecosystem through providing habitat and food for a variety of organisms from fungi to insects, an increase in the proportion of our trees that are classified as damaged or decaying can impact the value of timber and non-timber resources and suggest that trees are being negatively impacted by stressors. A higher score results from stable amounts of damage and decay over time.
Damage and Decay contributes to 8% of the overall Condition category score.
Every year trees die for a variety of reasons, from windstorms and lightning strikes to fungal or insect infestations. However, changes to this baseline rate of tree mortality may signify that environmental conditions are changing and could pose problems to the lifespan of our trees. A high score means that tree mortality is remaining stable over time.
Tree Mortality contributes to 8% of the overall Condition category score.