TUTORIAL (15-30
minutes)
The RCSB Protein structure Data Bank
(PDB).
| Note that the
RCSB Protein Data Bank is not to be confused with the NCBI
Protein Data Base! The Research
Collaboratory for Structural Bioinformatics
is a non-profit consortium of Rutgers University, The San Diego Supercomputer
Center and the University of Wisconsin. |

The Protein Data Bank (PDB) is
a database of three dimensional biomolecular structures derived from X-ray
crystallography and NMR-spectroscopy. Understanding the 3-dimensional shape of
any molecule is essential to understanding its function. The "PDB
data files" provide the exact location of every atom in a molecule
in all three dimensions (X, Y, Z). The PDB is the single worldwide
repository for the processing and distribution of 3-D structure data of large
molecules of proteins and nucleic acids. It was established at Brookhaven
National Laboratory in 1971, and originally contained only 7 structures! The
RCSB PDB provides a variety of tools and resources for studying the structures
of biological macromolecules and their relationships to sequence, function, and
disease. The RCSB is a member of the wwPDB whose mission is to ensure that the
PDB archive remains an international resource with uniform data. Details about
the history, function, progress, and future goals of the PDB can be found in
About the PDB as well as in the PDB Annual Reports and PDB Newsletters.
The Molecular Modeling Database (MMDB)
is a database of three dimensional biomolecular structures derived from X-ray
crystallography and NMR-spectroscopy. MMDB is a subset of three dimensional
structures obtained from the Brookhaven Protein DataBank (PDB), excluding
theoretical models. MMDB reorganizes and validates PDB information in a way that
enables cross-referencing between the chemistry and the three dimensional
structure of macromolecules. Its data specification includes a description of a
biopolymer's spatial structure, a description of how it is organized chemically,
and a set of pointers linking the two. By integrating chemical, sequence, and
structure information, MMDB is designed to serve as a resource for
structure-based homology modeling and protein structure prediction. MMDB records
are stored in ASN.1 format and can be displayed with the Cn3D, Rasmol, or
Kinemage viewers. In addition, similar structures within the database have been
identified using VAST, and new structures can be compared against the database
using VAST search.
|
As demonstrated earlier in these
tutorials, the "Entrez Gene" data base at NCBI contains a great deal of
information on DNA, transcript and protein sequence as well as conserved
domains. It also contains links useful in mining data about the 3D structure and
function of the gene product.
Do a search (protein) for human beta globin |
|
Click on the
image to see full-size! |
The screen with links to records for the
human beta globin protein.
Click on the link for the RefSeq record (NP_000509). |
|
Click on the
image to see full-size! |
The RefSeq record has a link to structures
related to human beta globin. Click on Links on the right hand side of
the yellow bar and select Related Structures from the drop down menu. |
|

Click on the
image to see full-size! |
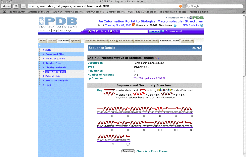
The "Related Structures" page, as shown in
the thumbnail to the left, lists all the related structures, with associated
information:
(From the List pull down menu select Medium redundancy)
-
A link to the structure record in the NCBI Molecular
Modeling Data Base (MMDB).
-
Rollover information on the link. In the case illustrated, 2DN2 is a file which
contains the structure of human beta globin at a resolution of 1.25 A0.
Question:
What is the definition of an Angstrom? How many A0
are in a mm?
-
The red line is a graphic illustration of the structural similarity to the query
protein sequence.
-
E-value (Expect value) is the number of
matches that could be expected by chance in the search of the data set. The
smaller the E-value, the lower the probability of a hit simply by chance.
-
A pull-down menu allows several options to limit the list.
|
|
Click on the
image to see full-size! |
Unfortunately the MMDB link for
2DN2 does not work.(However, this may work for your protein of interest!)
And this will bring you to the MMDB page where you will see a link to PDB.
The MMDB contains much of the same information as the PDB and contains a link
for PDB (see thumb nail). |
|

Click on the
image to see full-size! |
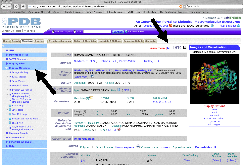
You can access RCSB(PDB) directly
at
http://www.rcsb.org/pdb/home/home.do
Type 2DN2 in the search bar.
The Protein Data Bank (PDB) records also
display with a number of tabs. For introductory purposes the two most relevant
are:
-
Biology and Chemistry
-
Sequence Details
Underneath the graphic, there are a number of "Display Options". These are links
to various viewers which can display PDB data files as an interactive graphic
(the tutorial which follows will introduce WebMol). |
|
|
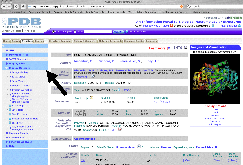
The "Biology and
Chemistry Report" tab opens a screen
with information about the chemical structure and biological function of the
beta globin chain.
As shown in the graphic to the left, there are also links to "Entrez Gene".
Finally, the
cytogenetic locus (11p15.5), is provided. |
|
 |
Click on the
"Sequence Details" tab this opens a screen showing that the beta
globin chain folds into a series of
helices and turns. As shown in the graphic to the left, this is depicted
with these secondary structures mapped onto the primary structure (amino acid
sequence).
|
|
Click on the
image to see full-size! |
Underneath the graphic, there are a number
of "Display Options". These are links to
various viewers which can display PDB data files as an interactive graphic (the
tutorial which follows will introduce WebMol). |

| The sidebar menu
offers access to additional information which is best illustrated with another
structure file from PDB.
Go back to the RCSB (PDB) home
page and Enter "1HT0" into the search box, and click on the "Search"
button. |
|
 |
At the top of the record click on the [M]
next to Learn more. This will bring you to a page with an overview of the
protein and its function. In the blue sidebar, click on the "Display Molecule"
toggle. The menu which opens is shown in the thumbnail to the left. It has links
to some of the viewers displayed under the graphic, but also to others such as "RasMol"
and the "Swiss-PDB" viewer. Click on some of the various displays to what they
look like.
|
|
 |
In the blue sidebar, click on the
"External Links" toggle shown in the thumbnail to the left.
A new page will open with a list of links. Scroll down the page and click on
the link to "PDBSum" (near the bottom of the page).
|
|
Click on the
image to see full-size! |
The link goes to the "Top Page" of the EBI
PDBSum website. This page provides information:
-
the secondary, tertiary and quaternary structure of the protein from several
aspects,
-
descriptive and taxonomic information
-
PDB files of similar structures
-
biochemistry and substrates
|
|
| Click on the Protein tab at the top which brings you to
the "Protein Page" of the EBI PDBSum website provides information on primary and
secondary structure and the location of important functional sites. As seen on
the left panel, this page has two views: 1.) "Wiring Diagram" (red circle
in the thumbnail to the left); 2.) "Residue Conservation". |
Click on the
image to see full-size! |
Click on "Wiring Diagram".
this shows that the Chain B contains two
domains, as shown in the thumbnail to the left:
-
Domain 1 (alpha-beta complex) is
depicted in red. The
N-terminal
part of domain 1 extends from residues 1-178. The
C-terminal
portion of domain 1 extends from residues 318-374.
-
The 3 catalytic residues in the active site (S48, H51, L57) are shown within
small red boxes.
-
Residues which interact with, and bind, the ligand
are indicated with small red squares.
-
Residues which interact with, and bind, the Zinc cofactor
are indicated with small blue squares.
-
Domain 2 (alpha-beta 3-layer
sandwich) is depicted in blue. It extends from residues 179-317.
-
Residues which interact with, and bind, the ligand
are shown.
|
Click on the
image to see full-size! |
Click on "Residue Conservation".
In this diagram each amino acid in Chain B is colored to indicate the degree to
which it is similar to its' counterpart in similar proteins. These data are
important in Comparative Genomics,
because residues which are highly conserved
(always the same), are very likely to participate in the biological
function of the protein. For example:
-
The 3 catalytic residues in the active site (S48, H51, L57) are highly
conserved.
-
Other residues which interact with the ligand, such as 199-203, are more
variable, but still more highly conserved than most.
-
Residues which interact with the Zinc, such as 97, 100 and 103, are highly
conserved.
NOTE: Be aware
that such data must be considered critically ...... what are the exceptions? |
|
