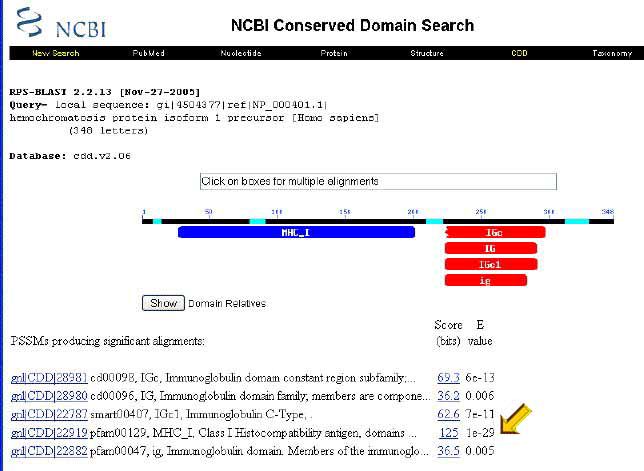
Click on the image to see full-size!
Click on this link.
Click on the image to see full-size!
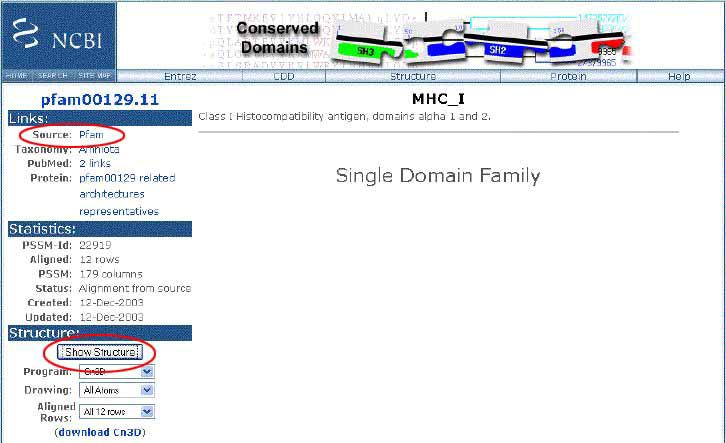
- The "Show Structure" button, which will launch a 3-D visualization of the IGc domain in Cn3D (the NCBI molecule viewer).
- The "Pfam" link, which goes to a portal providing access to protein and domain families.
Click on the "Structure" button.
A dialog box appears: Select "Open with
Cn3D (default)" and click "OK".
Click on the image to see full-size!
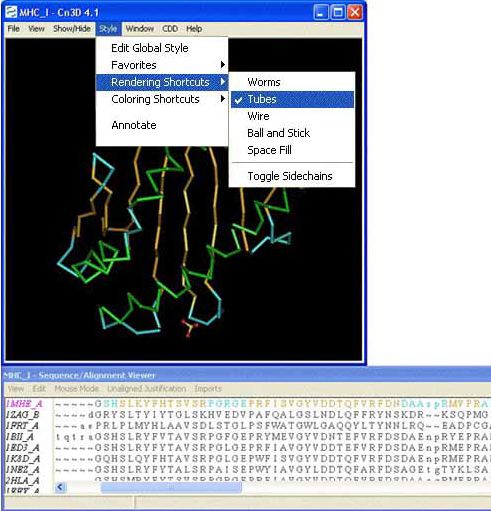
Select the following menu options, as shown in the thumbnail to the
left:
![]() Style
--> Rendering shortcuts --> Tubes
Style
--> Rendering shortcuts --> Tubes
The image which is shown to the left is colored to show the secondary structures (such as b pleated sheet, a helix and random coil). Figure out how this was done.
How does the "Sequence/Alignment Viewer" correspond to the image?
- What happens when you highlight a few amino acids in the 1MHE_A sequence?
- What happens when you double-click on an amino acid in the structure?
- X = roll.
- Y = yaw (pointing left or right).
- Z = pitch (pointing up or down).
Click on the image to see full-size!
Click on the "Pfam" link.
A new screen appears which looks like the
thumbnail below.
Click on the image to see full-size!
Included in this are links to PubMed for a deeper literature review of the subject.
Click on the image to see full-size!
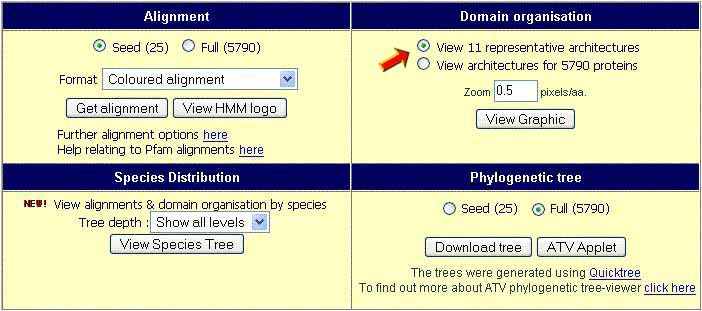
- Domain Organization
- Phylogenetic Tree
Click on the image to see full-size!
| A conserved domain is a recurring
sequence pattern or motif which occurs within a larger sequence. It has
a characteristic structure and function, and in concert with other domains,
determines the function of the entire protein. Before you proceed
with this section be certain that you REVIEW and
understand the importance and functionality of
|
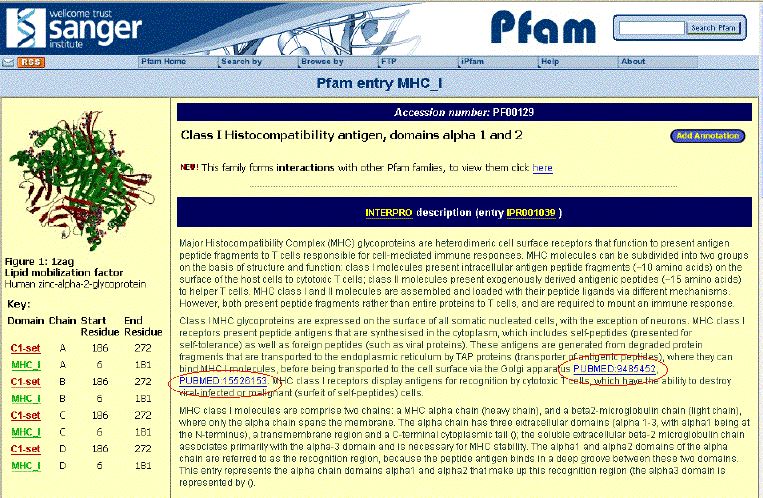
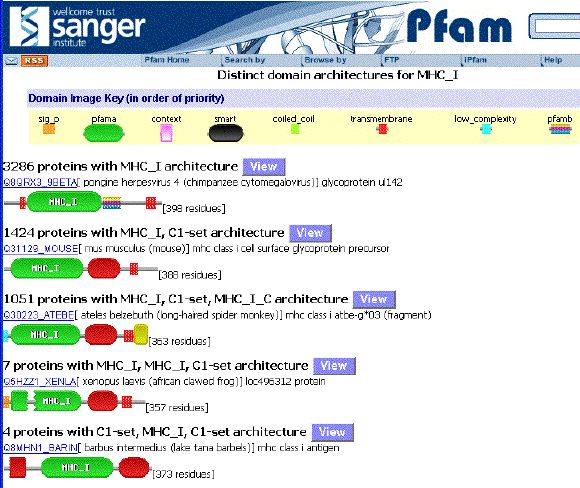
This Pfam screen shows the variety of sequences which contain the IGc conserved domain.
Click on the ![]() button
to see all of the sequences in a particular architectural group. For example,
details of each of the 7 sequences
in the MHC-1, MHC-1, c1 set group can be viewed, with links
to their GenBank records.
button
to see all of the sequences in a particular architectural group. For example,
details of each of the 7 sequences
in the MHC-1, MHC-1, c1 set group can be viewed, with links
to their GenBank records.
In this case, the IGc domain can be deployed in a variety of different ways to produce Immunoglobulin molecules with different immune activities!
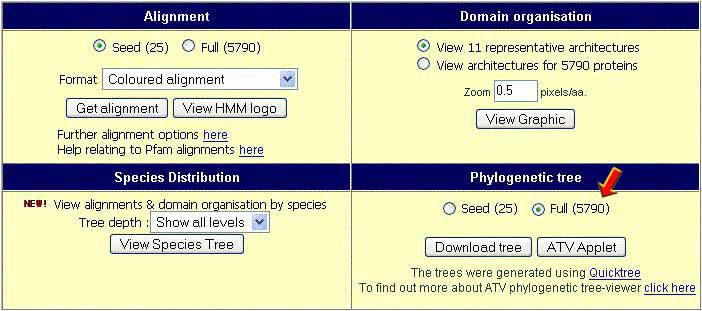
Click on the image to see full-size!
Select "Full", and click on "ATV Applet".
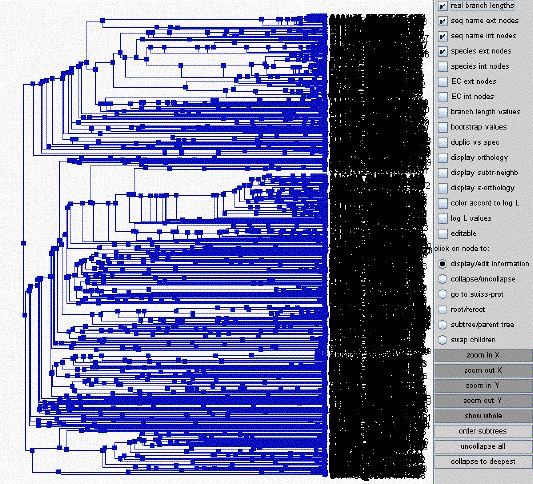
Click on the image to see full-size!
- the small squares are called "nodes" and indicate putative evolutionary ancestors.
- the length of the lines indicates evolutionary distance.
- the black mess is actually composed of all the species names. The screen contains so much data however, that they appear on top of each other.
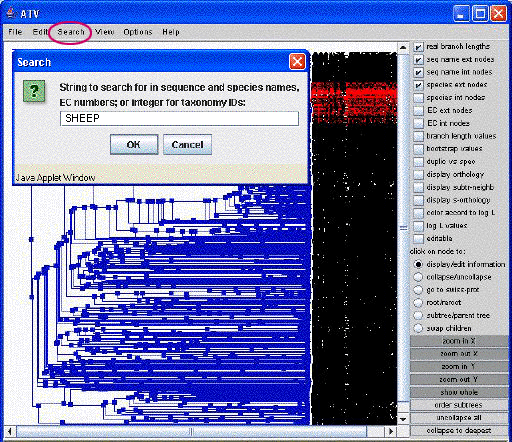
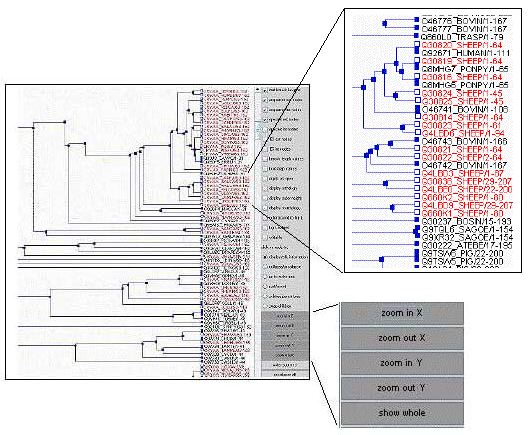
Click on the image to see full-size!
Text which contains the word "sheep" will now appear in red as shown.
Click on the image to see full-size!
- "Zoom in Y" to spread the text vertically.
- Zoom in X" to shorten the tree horizontally.