

R is a "programming environment" that allows you to perform a huge array of statistical (and non-statistical) tasks with very few commands. You can use it in at least two ways. You can cut and paste programs that I or others have written, make minor edits, and run the program. For this you don't really need to know anything about programming other than editing the program that is there. Alternatively, you can write extensive programs that will do just about anything you want. The nice thing is that if you want to take the latter course, you will find that someone has been there before you. If you want to calculate confidence limits on a population proportion, you just download the code that someone else has written, provide the necessary information, such as sample size and sample proportion, and click "run."
As I have said elsewhere, if you can download and install iTunes on your laptop, you can download and install R. You can also download and install RStudio, which is both a very nice editor for R and a graphical user interface that loads R when you start it up and provides a frame for R output and another frame for graphics. This document is simply designed to help you download those two programs.
R is available for Windows, Macs, and Unix. I now only have a Windows machine, so I will focus on that. However you should easily be able to adapt what I say to other environments. The R software is available at http://cran.r-project.org/. Click on that link and it will take you to the site where you will see something like:

On the left are links you might want to use in the future but can ignore for now. In the center top are the links for downloading what you want. Because I have a Windows machine, I would click on the Windows link. Click on your choice now, and you will see the screen shown below. (Ignore the links in the section labelled "Source Code for all Platforms.")
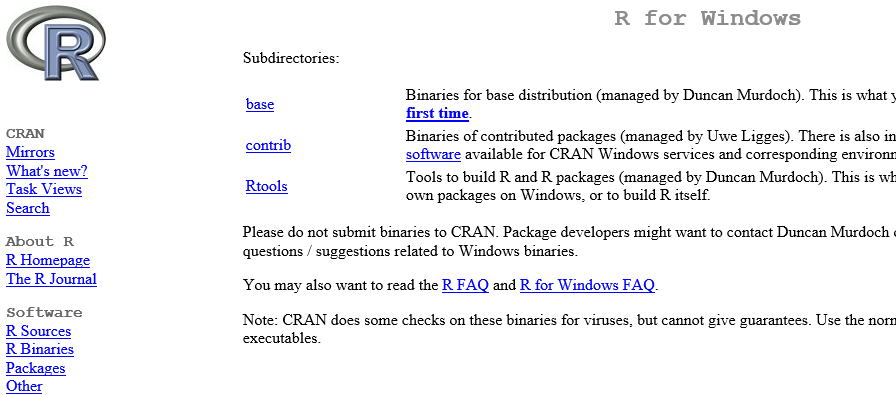
At this point click on "base," which will give you:
The last link that you need to worry about is the Download link near the top of that window. Just click on that and, when asked, click on "Save File." It will take a while to download, but that's just because it is a huge set of files. When downloading is complete, click on the file you just downloaded and it will install R. You will probably be happy just to take the defaults. Don't worry about the scary messages from Windows that you might get asking if you really want to load this dangerous software. Just tell it to go ahead.
If you start up R you will see a screen that looks very much like the following.

(I haven't the slightest idea why it says "Frisbee Sailing" at the top--a year ago it said "Roasted Marshmellows"-- , but you can't trust Unix geeks.) The important thing for you is the ">" prompt below the text. This is where you can enter commands. For example, you could type
>x = 5.2347 or you could type
xbar <- mean(x)
and the mean would be printed. This works just fine, but I prefer to have my commands collected somewhere so that I can go back and immediately see what I have done. Or maybe I want to enter a bunch of commands and run them all at once. For this we need an editor.
Well, there is always NotePad I suppose. You could type your commands into a NotePad page and then cut and paste them into the command window. But you can do better. For several years I used a program called Tinn-R. It is a very nice editor and I like it a lot. Recently I started using RStudio, and I like it too. My memory is that RStudio was a bit easier to install. The nice thing about either of these editors is that they keep track of what you are doing. If you type "print(b", both editors will automatically supply the closing ")" that you need. Sometimes blocks of text are set off with brackets, as in{abcd}. If you have a bunch of nested brackets, it can be very confusing to figure out which "{" is closed with which "}". The editors will highlight the relevant bits, which can be very very helpful. An example of the RStudio interface is shown below. Notice that there is a place for the code in the upper left, a place for responses from the console (the answers) in the lower left, a graphic frame, and information of current variables. The way that we generally use R, it will echo our commands to the command line. Thus if you run a program that has a line that says 'y <- sqrt(5)', then that line will appear on the command window. That makes it a bit hard to read everything, but you can do it.

Lastly, let me say something about Rweb. As I will use it, Rweb is a small bit of code that I can enclose in a web page. If gives you a window in which you can write R code, or paste some of mine. You then click "Submit" and it will send the code off to someone's server, run R on it, and give you back the answer just as if you had been running R on your own computer. It's kind of neat. It has a few quirks, but it is better than starting an R session everytime you want to do some little thing. You can read about it at
We will start with a very simple set of commands that will plot a graph showing the probability of getting x heads out of n tosses of a fair coin. (I know it's boring, but at least people can easily understand what we have.) The first thing to do is to start up R by going to the start menu, clicking on Programs, and finding R. Alternatively, you may have a shortcut on your desktop left over from the installation. Next open your browser and go to http://www.uvm.edu/~dhowell/methods8/Supplements/R-Programs/binomial.R Select all of the lines in that file and copy them to the clipboard. Now go back to R, click on File/New Script and paste the commands into the window that opens. It should look like the following. Assume that you are going to flip n = 50 coins and count the number of heads that come up. The coin is so biased that it will only come up heads only p = 30% of the time. We want to know what would happen if you repeated this coin flipping over and over again, counting the number of heads on each repetition of 50 flips. (The symbol "<-" is just the way that R writes "=". Similarly, "#" indicates that what follows is just a comment.) How you run this program depends on the kind of editor you are using. If you went ahead and downloaded Tinn-R or RStudio, you can start that editor and then paste the code there. Then you can execute it line by line using the "run" command. (My only complaint with RStudio is that you have to be careful where the cursor is. It says to enter a number, but if you type "5" that will appear in the code in the upper box, rather than in the command window where it belongs. You'll get used to it, but it is a pain.) (Make sure that the window of the editor is wide enough that the code is not all squnched up.) If you just have R, go to File/New Script. This will open a blank script and you can paste the code there. Then put your cursor at the beginning of the code and use Ctrl-R to execute one line at a time. However you do it, you will be asked to enter a value for n and one for p. Just type in 50 and a carriage return, click Ctrl-R again and type in .30 and a carriage return. A couple more Ctrl-R commands and you will have your plot. That may look like a very simple program, and it is. But when we come to Chapter 8 and I tell you that there is a program on the Web site in R that will calculate statistical power, you will be doing pretty much the same thing. You paste in the program, make changes to correspond to the problem you want to solve (e.g. a different sample size), and run the program. Now we will go to something a bit more complicated, but you still don't have to do any programming. The code looks messy, but you don't need to worry about that. The output also looks complex, but all you have to do is look at the plot and tell yourself how great it looks even if you don't know what it means. For this demonstration program you are going to need some data. I have suggested that you create a new folder on your computer, either a folder under My Documents or on the Desktop, or wherever you find convenient. Name this folder R-Stuff or whatever you like. Now go to http://www.uvm.edu/~dhowell/methods8/DataFiles/Tab9-2.dat. That is a data file from the book. When it opens, highlight it with "Select All" and copy it to the clipboard. Now go to any text editor on your computer (even Notepad) and paste in what you just copied. Save that to your R-Stuff folder as Tab9-2.dat. (Alternatively, you can right-click on that file and select "save as," or, if you have donwloaded all of DataFiles.zip and saved those, you can just select this file from that folder.) Now you have the data. Go to http://www.uvm.edu/~dhowell/methods8/Supplements/R-Programs/CIforRegressionDemo.R, and select and copy it to the clipboard. Next start up R if you haven't already, and click on File/New script. That will open an empty file, and you can just paste the program that you copied to there. Alternatively you can paste the code into Tinn-R or RStudio. I have added a twist to this program because you are going to have to open the data file that you just created. If you look at the fourth line in this file you will see the command "file.choose()" as well as "header = TRUE." The last means that the variable names are on the first line of the file. The former means that when you run the program it will open a search box and ask you to find the data file that you have saved. The program won't do anything until you do that. So run the program just as you did before, and select the data file. As soon as you do that the program will take over, perform a whole bunch of tasks, and draw you a nice graphic. You probably have no idea what that graphic is all about, but you have to admit that it is a nice graph. This is about all of the introduction to R that you will need to run the examples in the book. If you want to learn more about R, there are some excellent sources on the web. Elsewhere I have recommended an online tutorial by Kelly Black. It can be found at http://www.cyclismo.org/tutorial/R/, and is a good place to begin. I have some additional material on R at I indicate some of them at http://www.uvm.edu/~dhowell/methods8/Supplements/R-Programs/Using-R.html. That page links to files that give you a bit more material on the R environment. First, you need to know that R is case sensitive. (I said that before, but it bears repeating.) That is a holdover from the fact that it was written by a bunch of Unix types. Unix people seem to like to make things messy by making them case sensitive. So when you try to run a program and it tells you that the data file doesn't exist, the first thing to do is to check the capitalization in the calling command. Another thing that you need to know is that when you supply a URL to R, it makes a big difference how you type your "slashes." If you use the right click on your mouse to copy a file path from Windows, it will probably look like "C:\Users\Dave\Documents\Webs\methods8\Supplements\R-Programs". But R won't accept that because the slashes go the wrong way. (Remember, these were Unix types.) What R wants is "C:/Users/Dave/Documents/Webs/methods8/Supplements/R-Programs." There is another way to sneak around that, but there's no point in adding clutter. One additional fact, until I think up more. If you get lost in R and want help, you can try typing, for example, "help(plot)" I don't think that their help windows are always the clearest, but they are better than nothing. If you want to look further, try "RSiteSearch("Student's t") if you are on the Internet. That will send you to a whole bunch of good sources.Now We Can Get Started
    # Binomial distribution with p = .30 and n = 50.
    # Created Figure 5.6
    # You are asked to specify p, the probability of success on any trial,
    # and n, the number of trials.
	# I suggest that you start with n = 50 and p = .30.

    cat('Enter number of observations \n') ;n <- scan(nmax = 1)
    cat('Enter the probability of success \n') ;p <- scan(nmax = 1)
    successes <- c(0:n)

    y <- dbinom(successes, n, p)  #If you want cumulative distrib, change to "pbinom"
    plot(y, type = "h", xlab = "Number of successes", ylab = "Probability")
But, a few important points