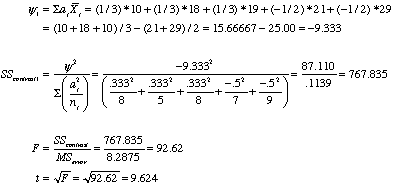
This page is necessitated by the fact that I messed up when I created the answers for Exercise 12.14. The answer isn't really wrong, but it wasn't what I intended or want. This was brought home to me by David Morse at Mississippi State, and I very much appreciate his contribution. Where I went astray was that in the last two editions I changed the approach to such contrasts but forgot about it when I wrote the answers. On top of that I did a poor job of writing the answers.
When you have a design with equal samples sizes (called a balanced design) it doesn't matter if you get the mean of two groups by adding up all of their scores and dividing by the number of scores, or if you just average their means. For example, if we have
Group 1 5 6 7 9 10 sum = 37, mean = 37/5 = 7.4
Group 2 8 9 12 7 14 sum = 50, mean = 50/5 = 10
Combined scores Mean = (5 + 6 + 7 + 9 + 10 + 8 + 9 + 12 + 7 + 14)/10
= (37 + 50)/10 = 87/10 = 8.7
Average mean Mean = (7.4 + 10)/2 = 17.4/2 = 8.7
You can use a formula that is based on the totals of the groups or on the means of the groups and you will come out at the same place with the same answer.
But when you have an unbalanced design there can be a very large difference.
Group 1 5 6 sum = 11, mean = 11/2 = 5.5
Group 2 8 9 12 7 14 sum = 50, mean = 50/5 = 10
Combined scores Mean = (5 + 6 + 8 + 9 + 12 + 7 + 14)/7
= (11 + 50)/8 = 61/7 = 8.71 weighted mean
Average mean Mean = (5.5 + 10)/2 = 15.5/2 = 7.75 unweighted mean
Notice that those two calculations lead to different answers, and their difference will usually increase as the difference in sample sizes increases. The weighted mean with unequal n's is more heavily influenced by the larger size of Group 2, which pulls the combined mean closer to the mean of that group. For the unweighted mean the groups are weighted equally, regardless of sample size, and the combined mean falls half way between the two group means. This may be a bit clearer if I recalculate the mean resulting from lumping all the scores together as
Combined groups Mean = (5 + 6 + 7 + 8 + 9 + 12 + 7 + 14)/8 = (3*6 + 5*10)/8
= 8.5 =
Here you can see that this approach explicitly weights the means by the sample sizes, giving more weight to the mean based on a larger sample. The other approach treats the means equally, and is often known as an unweighted or equally weighted means solution or the least squares solution.
When computing the answers that appear in the Instructor's Manual, I made two errors. In the first place I just used answers from an earlier edition without thinking about what I was doing. As a result the formulae that I used do not appear explicitly in the text and the answer is not what you would get if you used the text's approach. What you have is called the weighted means approach. Those answers are correct for a weighted means approach but they are not correct for an unweighted means approach, which is what I implicitly endorse in footnote 5 on page 351. In the book I argue that there is no reason why sample sizes should play an important role in the contrast if they simply reflect random noise--some participants just happened to not appear for reasons having nothing to do with the treatment.
What follows in the revised answer to Exercise 12.14. It is based on means rather than totals and uses the appropriate denominator to handle the unequal sample sizes. I am only giving the answer for the first contrast. The same approach applies to the second contrast, and this is an even numbered exercise so I would normally not provide either solution--I hope I don't anger some instructor :-( .

This approach is the one that I prefer unless there are good reasons to weight means differently. But what if we do want to weight them differently because the sample sizes clearly reflect something about population sizes? The formula that I use in the Instructor's Manual will work, but David Morse pointed out two alternative formulae that are simpler.

or, an alternative formula

This second formula is just about what you would do if you took the first three groups and lumped them together and took the last two groups and lumped them together and then ran a t test on the difference between the two sets.