
| Page | Line | Correction |
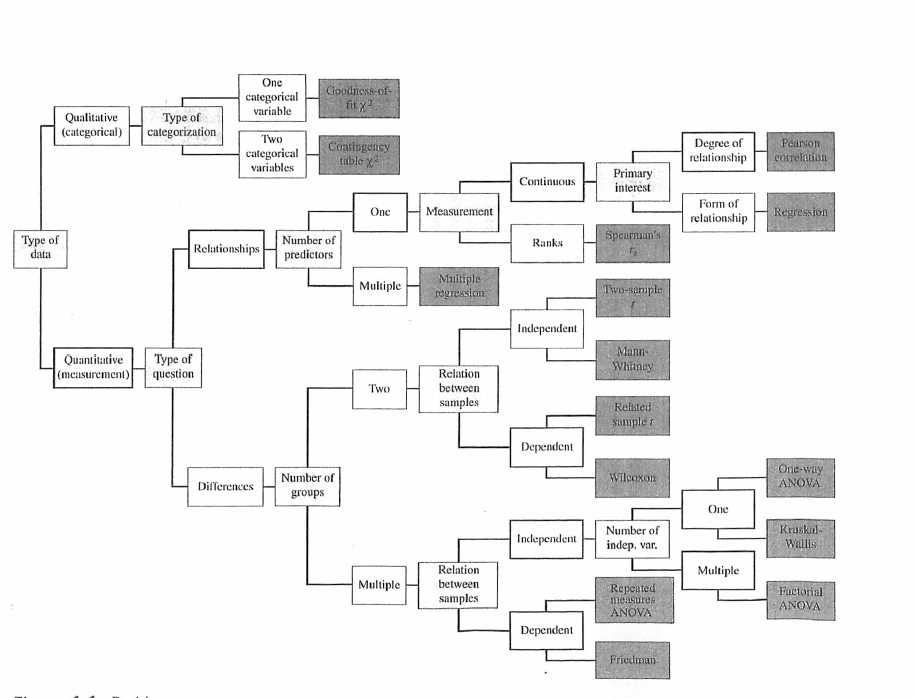
| Throughout | Decision Tree | I keep referring to the "decision tree" at the front of the book, but it isn't there. You can get a copy (not a very good one) at this link. I want to thank Elizabeth Parco for pointing this out. |
| 31 | Table 2.4 | Andrea Eves at Edith Cowan University in Australia noted that the 5th equation should read sigma(X-Y), not sigma(XY). |
| 44 | 1st line | Elena Harman at Claremont Graduate University pointed out the the equation should read "(10-5)2 = 25." |
| 56 | Exercise 2.5 | The reference to Figure 2.5 should be to Figure 2.9. Credit for finding this should go to Jacqueline Lucas of Hawaii Pacific University. |
| 57 | Exercise 2.15 | The reference to Exercise 2.17 should be to Exercise 2.14. This was pointed out by Charles Van Liew at SDSU. |
| 64 | Last full paragraph | Park Hyeon noticed that when I say "6% of cases were among clients of commercial sex workers...", the true value is 7%. |
| 67 | First Partial paragraph | Jodi Goodman, of West Verginia University, pointed out that density is discussed in Chapter 5 |
| 75 | Last partial paragraph | Michael Erickson at Hawaii Pacific University pointed out that I reversed the axes. The expected quantiles would go on the X axis. It doesn't really matter in the abstract, but I wrote them out the other way in Figure 3.10. You have to be consistent, and I wasn't. |
| 76 | First paragraph | Andrew Waters at the Uniformed Services University pointed out that I corrected Figure 3/10 from the previous edition, but that the text describing the relationship between expected and obtained quantiles is still reversed. The numerical values of -1, -2, 2, and 3 should be -2, -1, 3, and 2. |
| 115 | Section 5.5 | The reference to Chapter 6 should be to Chapter 3. |
| 145 | First equation | The denominatior should be 825. Jackie Schroeder at Cal State San Marcos found this error. |
| 148 | End 2nd full paragraph | Elena Harman noted that I have my examples confused. When I said "just as it was for the standard chi-square test," I should have said "for the data in Table 6.4." |
| 155 | Second paragraph | The bold entries refered to are the main daigonal in the table. |
| 163 | 5th line from bottom | Jodi Goodman pointed out that the risk ratios should be 1.40, 2.13, 4.20. |
| 172 | Exercise 6.22 | The reference should be to Exercise 6.8. |
| 173 | Ex6.28 | This example is correct, but the solutions manual reversed "presence" and "Absence" for rater B. |
| 182 | Near bottom | The reference to Figure 12.3 should be Figure 7.2. I think that I am getting my books mixed up. |
| 184 | Last word | The word should be "smaller," not "larger." |
| 191 | Third line from bottom | H0 should be H1. |
| 192 | Middle | "m" should be μ |
| 195 | First equation | I can't multiply correctly. Brian Stephens pointed out that the result should be 66.4, not 64.4. It is there twice. |
| 199 | Figure captiontd> | Thge relationship is between "Before Therapy" and "Weight Gain." |
| 208 | Figure 7.8 | There is some bad typesetting here. If you put a carriage return just before the row that starts with "mean", it is easier to see that the first mean is μ1. The line with = X̄1∞ etc. is separate. |
| 219 | 13 lines from bottom. | Take out "not" so as to read "If the variances are homogeneous you pool the variance estimates, ..." Thanks again to Michael Erickson. |
| 234 | 10th line from bottom | The word "interesting" should be "interested." Thanks to Matt Semmel at UNLV. |
| 235 | Last line | "d" should be "delta." Thanks to Mark Yates at the University of South Alabama." |
| 245 | Two lines below Figure 8.6 | "d" is the "effect size." Thanks to Michael Erickson Yates at the Hawaii Pacific University. |
| 256 | Table 9-1 | The file in the dataset named "Tab9-1.sav" was the wrong file. I have since corrected that. |
| 267 | Last line before last equation | that should read "Ŷ" instead of" Ȳ" Thanks to Jodi Goodman at the West Virginia University. |
| 274 | 2nd line from bottom | This should say "conditional on a fixed value of X." |
| 276 | Middle page | John Woodard at Wayne State pointed out that I wrote s'Y.X when I meant to write s''Y.X. The numerical part of that set of equations is correct. Nic Barreta at Claremont Graduate University found the same error. |
| 281 | Last line before last equation | That correlation is really r = .529. Thanks to Jodi Goodman at the West Virginia University. |
| 283 | Last three equations | My terminology is sloppy here. I am solving for the pooled variance estimate, so I should have used sp2 instead of writing sY.X2. |
| 292 | Fig9.11 | The dashed line with the steeper slope should be dotted. Thanks to Dale Berger at Claremont Graduate University. |
| 293 | Section 9.16 | Dale Berger pointed out that in those equations the values for ρ1 should be ρ′1--i.e. use Fisher's transformation. This will change the computed results slightly. I feel bad when I make a careless mistake, but I feel much worse when I make a stupid one. Using G*Power to solve this would leave the correct answer of N = 82 |
| 297 | Ex9.22 | The printout here is wrong. John Woodard at Wayne State pointed out that it is based on only 48 states. I have no idea why that happened. It does not alter the answer to the question, but it is certainly a foolish error. |
| 327 | Table 11.1 | You need to add 0.40 to all of the data in column D6. The statistics given there are correct. I get credit for finding that error. |
| 332 | Table 11.2 | THIS TABLE IS CORRECT AS GIVEN. At least I got something right. |
| 334 | middle of page | I wrote "variance" when I meant "variation.". |
| 343 | Reference to Figure 11.3 | This should refer to Figure 11.4. |
| 345 | 6th line after BUT! | Now for a grammer lesson. As I learned in high school, "group" is singular. |
| 350 | Reciprocal transformation | Dale Berger pointed out that by its very nature, a reciprocal transformation reverses the direction of the scale--high points become low points and vice versa. |
| 359 | 2nd and 3rd equations | John Woodard at Wayne State, who catches a lot of my errors, pointed out that the right side of the numerator on the right ends in 43.346 when it should end in 46.346. |
| 359 | 2nd equation | Then Jodi Goodman came back and pointed out that I typed nΣαj |
| 359 | The second full paragraph | I have this all messed up. It should read "For calculating power, most approaches begin with an effect size measure (denoted as d, φ, or f, depending on who is writing). This measure is simply the square root of the variance of the expected population means divided by the expected within-cell variance, which we will estimate with MSerror." Then two lines down change "standard deviation" to "variance." See-- I can even catch my own errors, and this page is one of my worst. |
| 403 | Table 12.5 | You need to add 0.40 to all of the data in column D6. The statistics given there are correct. |
| 425 | Last Row | The difference due to SmokeGrp is clearly significant. This error was found by a student of Michael Brannick at the University of South Florida.. | 428 | Last equation | Peter McCormick at St. Francis Xavier Univ. in Canada pointed out that the formula for phi′ αβ is incorrect. He said that one of his "Very!!" bright students once figured out that for all effects, we can define phi′ as √(SSeffect/(N*MSerror)). That is a much simpler way to do the calculation. |
| 527 | First paragraph under Sample Size | It is R2, and not R, that is equal to p/N-1. Dale Berger also reminded us that if you are testing for the unique contribution of an individual variable, you will need quite large sample sizes if the variables are highly correlated. |
| 538 | First equation | Laura Gil-Trejo, at Claremont Graduate University, noticed that the divisor in that equation (664.646) came from the reduced model. The correct number is 680.403 from the previous page.I wonder how many editions that wrong number went through. |
| 551 | First paragraph | Kris Preacher has moved to Vanderbilt. The new link should be http://quantpsy.org/sobel/sobel.htm. |
| 552 | Hassles data | There is a weird problem that I can no longer explain. The data file has 66 cases, but if you delete the 10 cases where there are no values for the centered variables, the file will produce the results I give. I have no idea why I have negative id scores. I just changed the data, so you may not come across this problem. I think that I have corrected the whole file now. Thanks to Sabry M. Abd-El-Fatta. |
| 575 | Third equation | Mark Yates, at the University of South Alabama, noted that the equation should read Y = Xb + e. The first + sign is wrong. |
| 626 | First equation | Mats Nilsson at Stockholm University noted that the second equals sign in that equation should be a minus sign. |
| 627 | Variance LogOddsRatio | Johan Krabbe at Copenhagen University noticed that the equation should actually be 1/A + 1/B + 1/C + 1/D. I have no idea where my equation came from. |
| 636 | Last equation | The numerator should begin with a capital sigma. Also due to Johan Krabbe |
| 639 | Variance LogOddsRatio | See correction for page 627 |
| | | ANSWERS TO EXERCISES |
| Answers | Exercise 7.25 | This is all screwed up. The correct answer is t = 3.186, p = .002 |
| Answers | Exercise 7.27 | This is all screwed up too. The correct answer is t = 5.00 |
| Answers | Exercise 7.49 | This is all screwed up because earlier ones were. The correct answer is d = 0.47, using the pretest standard deviation. Katherine Long, at Fordham University, pointed me to the last three errors. No wonder she couldn't get the answer that I gave. |
