
The reference to Figure 3.3 is wrong--it is the wrong figure. The correct figure is shown below.
If we have a problem when we try to lump together everything between 50 and 59, perhaps what we should be doing is breaking that interval into smaller intervals. We could try using the intervals 50 to 54 and 55 to 59, and so on. But then we couldn't just use 5 as the stem, because it would not distinguish between the two intervals. Tukey suggested that we use "5*" to represent 50 - 54, and "5." to represent 55 - 59. But that won't solve our problem here, because the categories still are too course. So Tukey suggested an alternative scheme, whereby "5*" represents 50 - 51, "5t" represents 52 - 53, "5f" represents 54 - 55, "5s" represents 56 - 57, and "5." represents 58 - 59. (You might wonder why he chose those particular letters., but "two" and "three" both start with a "t", and you can figure out the rest.) If we apply the scheme to the data on reaction times, we obtain the results shown in Figure 3.3. In Figure 3.3 I have represented only some of the data for purposes of illustration, but the complete stem-and-leaf display is there, allowing you to reproduce the complete data set.
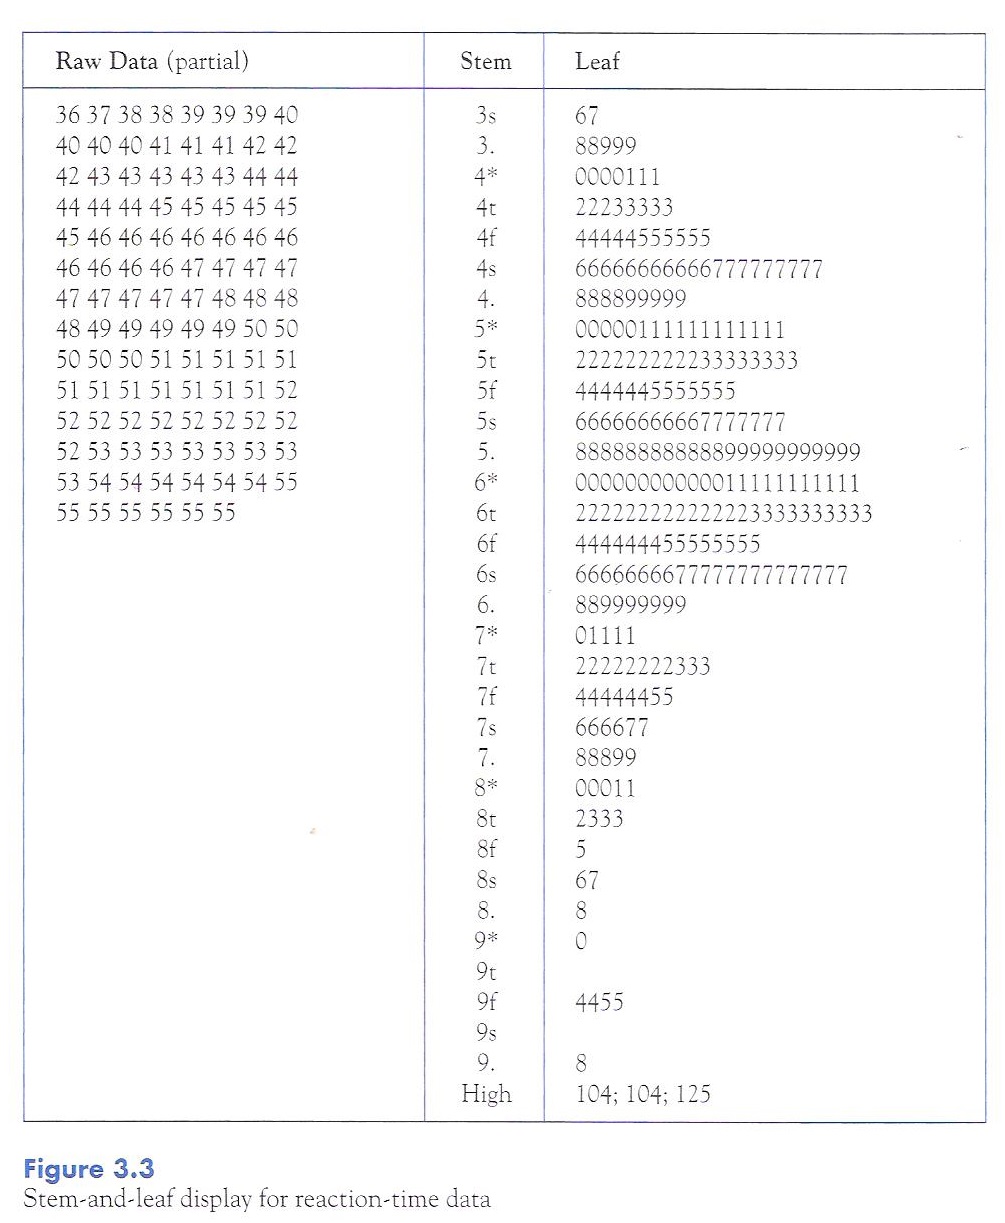
Notice that in Figure 3.3 I did not list the extreme values as I did the others. I used the word "high" in place of the stem, and then showed the actual values. I did this to highlight the presence of extreme values as well as to conserve space. I would have done a similar thing if there had been extreme values on the low end.