
This document was prepared as an illustration of the use of both t tests and correlation/regression analysis in drawing conclusions from data in an actual study. It can be used as a free-standing lecture example, as a take-home exam question, as an assignment, or as a study aid. I recommend reading the original source to see how the data fit with the hypotheses to be tested.
Prepared by: David C. Howell
Date: 11/7/94
Revised:4/29/09
This document is a description and analysis of a study by Seligman, Nolen-Hoeksema, Thornton, and Thornton (1990). The data are contrived, but they mirror the results that can be found in that paper (specifically Study 2).
Seligman et al. were concerned about the role of explanatory style in determining how people respond to negative events. To quote from their paper:
"Some people habitually explain bad events by causes that are stable in time, global in effect, and internal, but explain good events by causes that are unstable, specific, and external...A pessimistic explanatory style is claimed to lead to poor performance because it contributes to the expectation that bad events recur in several domains. In turn, this leads to lowered voluntary response initiatives following failure."
Seligman et al. ran a simple experiment to examine how optimists and pessimists respond to failure. They took 33 male and female members of the swim teams at the University of California at Berkeley. Each subject took that Attributional Style Questionnaire (ASQ; Peterson, Semmel, von Baeyer, Abramson, Metalsky, and Seligman, 1982). This is a self-report scale assessing how subjects respond to positive and negative events along three dimensions (stabile-unstable, global specific, and internal-external). The scores for positive events are summed across those three dimensions to create a composite-positive score, and negative events are summed to create a composite-negative (CN) score. In this study we are focusing on the CN score because we are interested in how subjects respond to negative events.
At a team practice, all subjects were asked to swim their best event as fast possible, but in each case the time that was reported was falsified to indicate poorer than expected performance, hence disappointing each swimmer and presenting them with a negative outcome. Half an hour later, each swimmer was again asked to perform, and their times were recorded.
According to theory, optimistic subjects, when presented with a negative event, would have a positive outlook for the future, would try harder, and thus should do better on the second trial (taking into account any fatigue from the first trial). On the other hand, Seligman et al. predicted that pessimistic subjects would not voluntarily try harder on the second trial, but would have an expectation that there is little that they can do. They would not be expected to do better on a retry.
The dependent variable for this analysis was the ratio of Time2/Time1. Any ratio greater than 1 would mean that the subject did better on the second trial, while a ratio less than 1 would indicate poorer performance. Thus Seligman et al. would expect lower values for pessimistic subjects.
You might ask yourself why Seligman et al. used this particular measure. They could have just taken the difference, rather than the ratio, of the two times. One simple answer might be that these subjects swam best in different events, and times for a 100 meter swim would obviously not be comparable with times for a 200 meter swim. Another answer might lie in the shape of the distribution of responses, with ratios perhaps being more normally distributed than differences.
There are at least two possible ways of looking at these data, and the authors used both of them. The first is to dichotomize subjects and optimists and pessimists and then ask if the two groups differed significantly on the dependent variable. The second is to look at the correlation between performance and CN scores.
The data for our analyses appear below. The first column is the ratio of Time2/Time1, the second is the CN score, and the third, to be explained shortly, is the grouping that results from a median split. (The median CN score was 12, and I flipped a coin for those three subjects who scored at the median. What other alternatives did I have?) For this variable, pessimists are coded as 1 and optimists as 2.
Ratio	    CN  OptimGrp             Ratio      CN   OptimGrp

0.9833	10.0000	1.0000               0.9441	 9.0000	1.0000
1.0447	 9.0000	1.0000               0.9658	15.0000	2.0000
1.0323	12.0000	1.0000               1.0410	12.0000	1.0000
0.9846	13.0000	2.0000               0.9226	13.0000	2.0000
1.1075	13.0000	2.0000               1.0000	13.0000	2.0000
1.0748	11.0000	1.0000               0.9313	11.0000	1.0000
1.0435	17.0000	2.0000               0.9363	10.0000	1.0000
0.9518	15.0000	2.0000               0.9985	11.0000	1.0000
0.9980	13.0000	2.0000               0.8719	11.0000	1.0000
0.9139	11.0000	1.0000               1.0029	14.0000	2.0000
0.9548	11.0000	1.0000               0.9344	14.0000	2.0000
1.0017	12.0000	2.0000               0.9450	10.0000	1.0000
1.0771	13.0000	2.0000               1.0098	14.0000	2.0000
0.9749	 9.0000	1.0000               0.8640	 7.0000	1.0000
1.0255	14.0000	2.0000               1.0645	15.0000	2.0000
1.0454	13.0000	2.0000               1.0525	15.0000	2.0000
0.9619	11.0000	1.0000
The data file can be downloaded by clicking on Download Data but be sure to chose the menu item to send the data to a file.
Seligman et al. divided the swimmers into two groups on the basis of the subject's CN score, splitting the group at the median. Descriptive statistics for the two groups on the Time2/Time1 ratio follow:
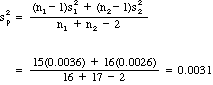
Group           Mean      St. Dev.      N
__________________________________________
Pessimists (1)  0.967       0.060       16
Optimism(2)     1.011       0.051       17
Here you can see that Optimists did about as well on the second trial as they had done on the first, but that the performance of Pessimists declined. Seligman et al. (1990) assure us that among Olympic quality swimmers such ratios are meaningful and could easily make a difference in the outcome of an event.
Given two groups and one dependent variable, we can ask if those group means differ. With larger samples I would first examine the shapes of the distributions, and perhaps compare the variances statistically, but with only 16 or 17 subjects in each group, little can be seen by visual examination. (It is unfortunate that just when the assumptions behind the test are most important, we have the least data for making a reasonable assessment of those assumptions. By the time we have enough cases to make meaningful tests on assumptions, the robustness of the test has long since taken over and the assumptions are far less important.)
We can tell from the data that the variances (as reflected in the standard deviations) are nearly equal, and we will pool the variances.
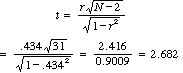
This leads to a simple t test.
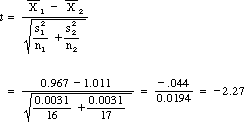
This is a t on 31 df. From that tables of Student's t we find t.025(31) = 2.042. Because our value of t is more extreme, we can reject H0 and conclude that improvement, as measured by the ratio of times, is significantly different in the two groups, with Optimists outperforming Pessimists.
These data are in line with the theory as proposed by Seligman et al. In the face of failure Optimists seem to rally, whereas Pessimists fall further behind (as they always knew they would do.)
An alternative way of looking at performance as a function of the Optimism-Pessimism distinction is to look at the regression of our measure of post-disappointment performance as a function of the CN score on the ASQ. If people's response to negative events fits the Seligman et al. theory, we would expect there to be a correlation between the two major variables (CN and Ratio).
You might ask why Seligman et al. didn't do this in the first place. I have the same question, but in fairness to them, they didn't really just predict one variable (Ratio) from another (CN), they predicted Ratio from several variables, also including Sex and the coaches judgments of how swimmers would perform after a defeat. Since neither of these other variables played a significant role in the results, I am dropping them here. At the same time, this might have been a better starting point for the analysis than the median split used above.
These data were generated to have a correlation approximately equal to the one that Seligman et al. must have found, although they don't give the actual value. The results are shown below in a scatterplot generated by Systat. I have gone ahead and fit the regression line as a frame of reference.
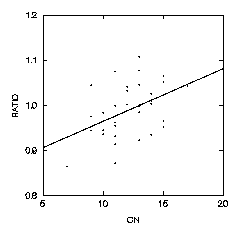
Here you can see that Ratio increases with CN, although there is a lot of dispersion of points around the regression line. To get a measure of the fit of these points, we can first calculate the correlation coefficient between Ratio and CN. These calculations are given below.
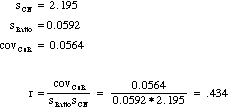
Notice that the correlation is positive, and, while not terribly large, does a surprisingly good job of predicting how nearly professional swimmers will respond to failure as a function of their view of the world. We can use a simple t test to test this r for significance.
This is also a t on 31 df, and we have already seen that t.025(31) = 2.042. Hence we can again reject H0, in this case concluding that there is a linear relationship between optimism and response to negative events.
Given the nature of these variables there is not a lot to be gained by calculating the regression equation, but I will go ahead a do it to illustrate the procedures. I will first show how it is calculated by hand, and then I'll present printout from Systat giving the same results.
To calculate the regression coefficients by hand we need descriptive statistics. These have been given above, but it would be useful to repeat them here.
        Var     N     Mean    St. Dev.   Covariance
		____________________________________________________
        Ratio   33   0.990      0.0591
                                            0.0564
        CN      33  12.152      2.1955
Then
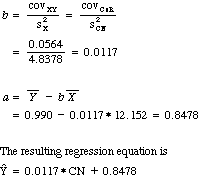
Here we can see that for every one unit difference in CN we would expect a 0.0117 unit difference in the ratio of Time2/Time1, and with a score of 0 on CN we would expect a ratio of only about .85. Given the nature of the variables, perhaps neither of these two numbers is particularly meaningful. That does not, however, make the regression itself meaningless. We can still see that improvement after failure is predicted from the person's score on the ASQ.
I have not shown the test on the slope, because as you should know it will produce the same statistic as the test on the correlation coefficient. This can be seen below in the printout from Systat, which does include that test.
DEP VAR: RATIO N: 33 MULTIPLE R: 0.435SQUARED MULTIPLE R: 0.189 ADJUSTED SQUARED MULTIPLE R: 0.163 STANDARD ERROR OF ESTIMATE: 0.0540 VARIABLE COEFFICIENT STD ERROR STD COEF TOLERANCE t P(2 TAIL) CONSTANT 0.8475 0.0537 0.0000 . 15.7844 0.0000 CN 0.0117 0.0044 0.4351 1.0000 2.6905 0.0114 ANALYSIS OF VARIANCE SOURCE SUM-OF-SQUARES DF MEAN-SQUARE F-RATIO P REGRESSION 0.0211 1 0.0211 7.2387 0.0114 RESIDUAL 0.0905 31 0.0029
I will not discuss this printout because most of what is there should be self-explanatory, either from what I have said or from the book. The Analysis of Variance table really comes down to an F test on the significance of the regression (or correlation), and you should verify that t is the square root of F.
There are perhaps additional analyses that you would like to apply to these data, but I leave those to you. A good starting point would be to go back to the original paper and the work from which is was derived. A good analysis of data cannot possibly be undertaken without some idea of the underlying theory and the hypotheses that are being tested, let alone an understanding of the measuring instruments that are used.
We have seen in these analyses that Explanatory Style (how one explains to oneself or others why things happen) is important in understanding and predicting the response to negative events. Seligman et al. Try to explain this in terms of expectations. To quote from the original paper:
"In the theory of learned helplessness, the expectation of future failure works by undermining the incentive to try, thereby lowering the probability of voluntary response initiation. (Seligman, 1975). The performance of swimmers after experimentally manipulated defeat in Study 2 suggests that lowered response initiation following defeat may be the mechanism by which pessimistic explanatory style hurts achievement in natural settings."
In other words, those who expect the worst don't try, and then they get the worst.
Seligman, M.E.P., Nolen-Hoeksema, S., Thornton, N., & Thornton, C.M. (1990). Explanatory style as a mechanism of disappointing athletic performance. Psychological Science, 1, 143-146. Return
Peterson, C., Semmel, A., von Baeyer, C., Abramson, L. Y., Metalsky, G.I., & Seligman, M. E. P. (1982) The Attributional Style Questionnaire. Cognitive Therapy and Research, 6, 287-299.Return
 Return to
Dave Howell's Statistical Home Page
Return to
Dave Howell's Statistical Home Page
Send mail to: David.Howell@uvm.edu
Last revised: 4/29/09