![]()
We can expand our randomization test on two independent groups to a one-way analysis of variance on multiple groups quite easily. (Expanding it to factorial designs is a different story). We will do this simply by permuting the combined data across all of the groups.
With the two group example, I said that the choice of a test statistic was simplified by the fact that we would get the same result if we chose the mean of the first group, the difference between the two means, or a t on the two means, because these are equivalent statistics. The problem is not quite so simple when it comes to an analysis of variance, because we have multiple means. Thus, at the very least, we have to take into account the means of all of the groups. But that still leaves a lot of latitude, but unfortunately not all of our choices will lead to equivalent statistics--though some will.
One common choice is to calculate SSbetween on the group means, and use that as our metric. I prefer to go a step further and calculate the traditional F on group differences. This is an equivalent statistic to SSbetween, and it is one with which we are familiar. It does take slightly longer to compute, but that is not a problem here--we are talking about the difference of a very few seconds.
The basic procedure is quite predictable from what you already know. We will
A good example of a traditional one-way analysis of variance is the study by Foa et al. (1991) comparing treatment of rape victims. I have described this study elsewhere, but it can be summarized briefly by saying that there were four conditions. One group received Stress Innoculation Therapy (SIT), a second received Prolonged Exposure (PE), a third received standard Supportive Counseling (SC), and the last was a Wait-List control group (WL).
The means, standard deviations, and sample sizes are shown below, and the data can be found at Foa1way.dat.
Group n Mean St. Dev. SIT 14 11.07 3.95 PE 10 15.40 11.12 SC 11 18.09 7.13 WL 10 19.50 7.11
The results of 5000 random resamplings from these 45 observations appear below.
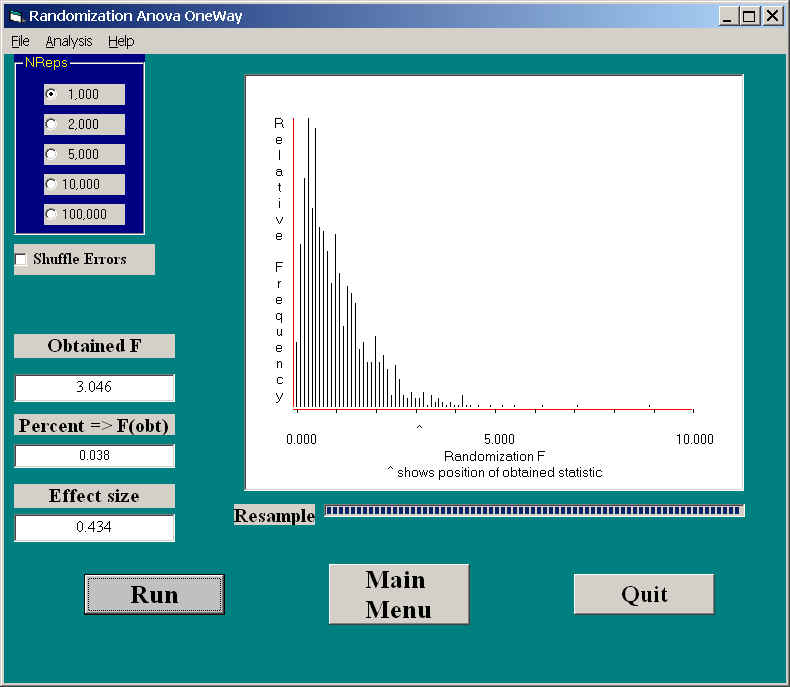
Here you can see the sampling distribution of F, which, in this case, looks very much like the tabled sampling distribution. You can see an F = 3.046, which is exactly the same as the F you would have from any standard analysis of variance program. The associated p value is .038. This is obtained by noting the number of resamplings with an F greater than 3.046. It happens to agree well with the probability obtained from the standard F distribution on 3 and 41 degrees of freedom, but that need not always be the case.
When we looked at the randomization test on two independent means, I modified the data very slightly (in a perfectly reasonable way) and obtained an unusual (bimodal) sampling distribution of the resulting t. We can apply the one-way analysis of variance procedure to those data. We would not expect the sampling distribution to look quite so extreme, because F is the square of t, and thus the bimodal feature of the t distribution will be eliminated, but we will still have a sampling distribution of F that would not agree with the standard F distribution. The results of this analysis follow.
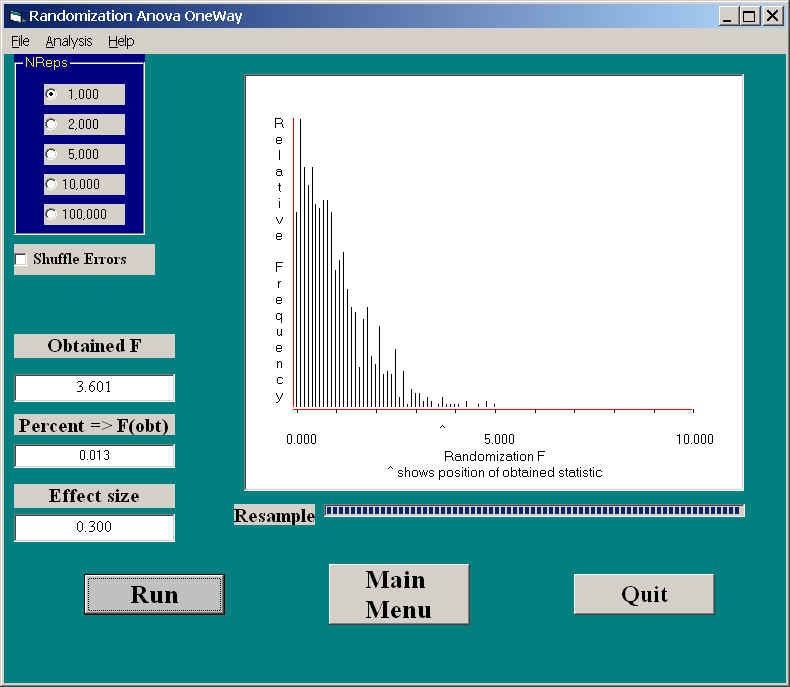
Because the differences are more subtle, you and I probably would not notice how distorted this sampling distribution is. However, the obtained F, on 1 and 38 df, would have a tabled F probability of .0654, whereas our probability (which is correct) is .013. This reflects the fact that violating assumptions behind the standard analysis of variance can seriously affect the resulting probability. In this case it was noticeably larger than it should, and would lead to a type I error.
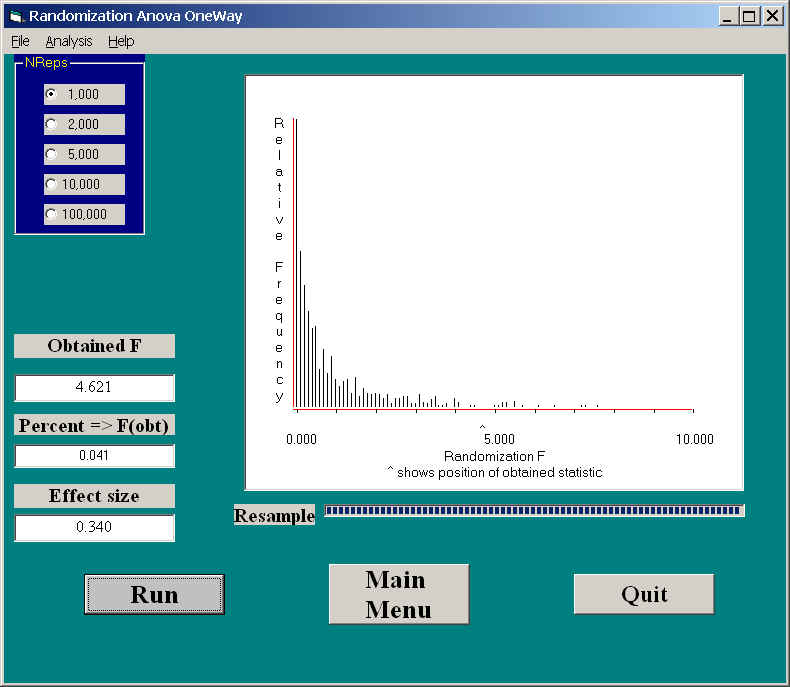
If you want a sense of just how distorted it is, see the following distribution. This is the randomization sampling distribution when we remove the outlier. Because we still have the same number of degrees of freedom, any differences between these two distributions are due to the fact that we have added an outlier.
Multiple Comparisons
I still need to work on this section, but I will say for now that with a one-way between-subjects analysis of variance, the simplest way to deal with multiple comparisons is to restrict yourself to pairwise comparisons of groups, to use only the groups in your contrast, and to run a randomization test of two independent groups. If you run several of these, you should use a standard Bonferroni adjustment (or a more powerful variant of that) to control error rates. An excellent book on this topic is Westfall and Young (1993).
Foa, E. B., Rothbaum, B. O., Riggs, D. S., & Murdock, T. B. (1991) Treatment of posttraumatic stress disorder in rape victims: A comparison between cognitive-behavioral procedures and counseling. Journal of Consulting and Clinical Psychology, 59, 715-723.
Westfall, R. H. & Young, S. S. (1993) Resampling-based multiple testing. New York: John Wiley & Sons.
![]()
![]()
Last revised: 01/16/2006